departmentfortransporttrunkroadsgenerationtraffic1994.md 611 KB
category: literaturenote citekey: departmentfortransporttrunkroadsgenerationtraffic1994 title: Trunk roads and the generation of traffic authors: "Department for Transport, Great Minster House" year: 1994 date: 1994-12-19 1994-12-19 url: "http://webarchive.nationalarchives.gov.uk/20121107103953/http:/www.dft.gov.uk/publications/trunk-roads-and-the-generation-of-traffic/" zotero_key: 2ES5ENHT zotero_storage: 73F7JWWW collections: kursusetööd / Sissejuhatus erialasse folder: 001_artiklid firstAuthor: "Department for Transport, Great Minster House"
status: converted

TRUNK ROADS AND THE GENERATION OF TRAFFIC
The Standing Advisory Committee on Trunk Road Assessment
Chairman: Mr D A Wood QC


THE STANDING ADVISORY COMMITTEE ON TRUNK ROAD ASSESSMENT
TRUNK ROADS AND THE GENERATION OF TRAFFIC
Chairman: Mr D A Wood QC
December 1994
London: HMSO
© Crown copyright 1994 Applications for reproduction should be made to HMSO First published 1994
ISB~ 0 11 551613 1

Rt Han John MacGregor aBE MP Secretary of state for Transport THE STANDING ADVISORY COMMITTEE ON TRUNK ROAD ASSESSMENT 2 MARSHAM STREET LONDON SWIP 3EB
CHAIRMAN: MR DEREK WOOD QC
My Ref:
Your Ref:
J 6 May 1994
Sir
This Committee was invited to consider the question of whether new or improved roads generate e~tra traffic over and above the growth in traffic which would be expected in the absence of any improvement to the road network.
We now have pleasure in submitting our Report.
We have consulted a large number of bodies and individuals, and we have carefully weighed the very substantial volume of evidence submitted to us. We have also had the benefit of extensive discussions wi th your Department. We would like to place on record our very great appreciation of all the help given to us in the course of our work.
Yours faithfully, ~~
D A Wood / Chairman
D Coombe
p~
~u.
fu·~~~
7 P J Mackie
R H stewart
Vice Chairman
P B Goodwin
Dtt~
.................,'rs..-....~ ......_--
MEG Taylor
CONTENTS
| Chapter | Page | |
|---|---|---|
| EXECUTIVE SUMMARY |
||
| PART I |
OF THE PROBLEM INTRODUCTION AND DEFINITION |
|
| 1 | Introduction to the Report |
1 |
| Terms of Reference |
1 | |
| of Method Working |
1 | |
| Form of the Report |
2 | |
| Miss Lee's |
2 | |
| Conventions | 3 | |
| Acknowledgements | 3 | |
| 2 | Identifying the Nature of the Problem |
5 |
| Introduction | 5 | |
| 'Generated' and 'Induced' Traffic |
7 | |
| By What Processes Might Road Improvements Induce More Traffic? |
8 | |
| of Responses Connected with the Total Volume Activities |
8 | |
| of Responses Connected with the Location Activities |
9 | |
| of Responses Connected with the Timing Activities |
10 | |
| of Responses Connected with the Mode Transport Used |
10 | |
| of Responses Connected with the Co-ordination Activities by |
||
| Different Individuals |
11 | |
| Responses Connected with the Route Chosen |
11 | |
| of Responses Connected with the Effects the Other Responses |
11 | |
| Conclusion Four Key Questions |
11 12 |
|
| The Burden of Proof |
12 | |
| The Structure of the Rest of our Report |
12 | |
| References | 12 | |
| 3 | Defining the Problem in More Technical Terms |
15 |
| Introduction | 15 | |
| of The Importance Behavioural Responses |
15 | |
| Generalised Cost and the Elasticity of Demand |
16 | |
| of Formal Definition these Processes in Transport Models |
16 | |
| Modelling Land-Use Changes |
17 | |
| Trip Generation |
18 | |
| Trip Distribution |
18 | |
| Mode Choice |
18 | |
| Journey Scheduling |
18 | |
| of Assignment Traffic |
19 | |
| Activity Models |
19 | |
| Economic Models of Demand Elasticity |
19 |
| of Combinations and Hierarchies Modelled Effects Our of Definition Induced Traffic of Induced Traffic in the Context a Fixed Trip Pattern of Induced Traffic in the Context Variable Trip Patterns References |
19 20 22 24 25 |
|
|---|---|---|
| PART II | THE EVIDENCE OF INDUCED TRAFFIC | |
| 4 | General Evidence on Whether Road Capacity Influences the Amount of Traffic |
29 |
| of Introduction: Limits to the Possibility Proof of The Common Sense Argument and Observations Traffic Growth Evidence on Professional Confidence in the Current Assumptions of Attitude Surveys Drivers on on Amount of Evidence Other Influences the Traffic of Implications the Research Findings Conclusion References |
29 31 34 35 37 45 47 47 |
|
| 5 | Evidence from Traffic Counts on Improved Roads | 51 |
| Introduction of Review Traffic Growth on the M25 Literature Reviews of Transport of and Department Monitoring Forecasts |
51 51 54 |
|
| Observed Traffic of Detailed Analyses Traffic Flows on Specific Schemes Pells' Literature Review: Results for M62, York Northern Bypass |
55 67 |
|
| and Severn Bridge |
69 | |
| London Trunk Road Schemes Schemes in the Greater Manchester Area |
70 80 |
|
| Amsterdam Orbital Motorway |
83 | |
| Research in Progress |
85 | |
| General Conclusion on Evidence from Traffic Counts |
85 | |
| References | 85 | |
| PART III | THE IMPLICATIONS OF INDUCED TRAFFIC | |
| 6 | The Department's Current Procedures for Traffic Forecasting | 89 |
| Introduction | 89 | |
| The Overall Framework |
89 | |
| Scheme Appraisal Models |
90 | |
| The Area Covered by a Scheme Appraisal Model |
90 | |
| Form of The Scheme Appraisal Models |
91 | |
| of Principles Forecasting Traffic |
93 | |
| The National Planning Data Files |
93 | |
| Road The National Traffic Forecasts (NRTFs) The National Submodels |
94 95 |
| The National Forecast Adjustment Factor (NFAF) Forecasts for Scheme Appraisal |
95 96 |
|
|---|---|---|
| Other Models Used for Forecasting |
98 | |
| Regional Highway Traffic Models | 99 | |
| Variable Trip Matrix Appraisal of Trunk Road Schemes |
100 | |
| Constraints on Traffic Growth in Urban Areas |
100 | |
| Models Used for Motorway Widening Schemes |
100 | |
| References | 101 | |
| 7 | The Role of Traffic Forecasts in the Department's Design |
|
| and Assessment Procedures | 103 | |
| Introduction | 103 | |
| Selection of Geometric Standard |
103 | |
| Traffic Flows for Geometric Design | 104 | |
| Traffic Flows for Pavement Design | 104 | |
| Traffic Flows for Environmental Appraisal | 106 | |
| Traffic Flows for Safety and Economic Evaluations |
108 | |
| References | 108 | |
| 8 | The Department's Approach to the Economic Evaluation of Schemes |
111 |
| Introduction | 111 | |
| The Role of Economic Evaluation |
111 | |
| Principles of Economic Evaluation |
112 | |
| Safety Appraisal | 120 | |
| The COBA Program |
120 | |
| How COBA is Used |
121 | |
| References | 122 | |
| 9 | Implications of Induced Traffic for Economic Evaluation |
123 |
| Introduction | 123 | |
| The Robustness of the Traffic Benefits to the Fixed Demand Assumption |
123 | |
| The Commercial Benefits of Road Investment |
129 | |
| The Department's Appraisal Practice |
131 | |
| References | 133 | |
| 10 | Implications from Experience of Transportation Modelling |
135 |
| Introduction | 135 | |
| Theoretical Model Based on a Single Link |
137 | |
| Network-Based Modelling of Cardiff |
140 | |
| Four-Stage Modelling of Belfast |
146 | |
| Elasticity Modelling of Belfast, West London and Norwich |
149 | |
| Modelling of Strategic Transport Demand Bristol |
152 | |
| Land-Use/Transport Interaction Modelling in Leeds, | ||
| Dortmund and Bilbao |
155 |
| Land-Use/Transport Interaction Modelling of a Hypothetical |
||
|---|---|---|
| New Motorway |
156 | |
| Land-Use/Transport Interaction Modelling in Norwich |
157 | |
| of of Modelling the Effects Changes in Road Conditions on |
||
| Freight Distribution |
158 | |
| Concluding Remarks |
159 | |
| References | 161 | |
| PART IV |
CONCLUSIONS FROM THE EVIDENCE AND THE IMPLICATIONS OF INDUCED TRAFFIC |
|
| 11 | Conclusions from the Evidence and the Implications of Induced Traffic |
165 |
| Introduction | 165 | |
| Is Induced Traffic a Real Phenomenon? |
165 | |
| Does Induced Traffic Matter? |
168 | |
| When and Where Does Induced Traffic Matter Most? |
170 | |
| References | 171 | |
| V PART |
THE WAY FORWARD | |
| 12 | The Need for Change | 175 |
| Introduction | 175 | |
| The Current Planning Process for Trunk Roads |
175 | |
| OUf Concerns about the Current Approach to the Planning |
||
| of and Appraisal the Trunk Road Network |
176 | |
| The Current Appraisal Hierarchy |
178 | |
| Deficiencies in Current Appraisal Practice |
180 | |
| Road The National Traffic Forecasts |
180 | |
| Traffic Forecasts for Regions and Interurban Corridors |
182 | |
| Traffic Forecasts for Urban Areas and Conurbations |
182 | |
| Traffic Forecasts in Peri-Urban Areas |
183 | |
| Traffic Forecasts for Scheme Appraisal |
183 | |
| Forecasts of Land-Use Data for Input to the Traffic |
||
| Forecasting Process |
184 | |
| The Key Issues |
184 | |
| References | 185 | |
| 13 | Our Recommendations for Change | 187 |
| Introduction | 187 | |
| Basic Research |
187 | |
| Our Recommended Approach |
187 | |
| Road National Traffic Forecasts |
188 | |
| Regional and Interurban Corridor Traffic Forecasts |
188 | |
| Urban Area or Conurbation Traffic Forecasts |
190 | |
| Peri-Urban Scheme Appraisal |
192 | |
| Scheme Appraisal |
192 | |
| | Data
Land-Use
and
Land-Use/Transport
Interaction
Models
Appraisal
Strategy
Appraisal
Methodology | 193
194
194 | |
|------------|-----------------------------------------------------------------------------------------------------------------------------|-------------------|--|
| 14 | Interim
Procedures | 197 | |
| | Introduction
National
Road
Traffic
Forecasts | 197
197 | |
| | Regional,
Interurban
Corridor,
Urban
Area,
Conurbation
and | | |
| | Peri-Urban
Traffic
Forecasts
Individual
Schemes | 197
200 | |
| | Economic
Evaluation | 201 | |
| | References | 202 | |
| PART
VI | MAIN
CONCLUSIONS
AND
SUMMARY
OF
RECOMMENDATIONS | | |
| 15 | Main
Conclusions
and
Summary
of
Recommendations | 205 | |
| | Introduction | 205 | |
| | Our
Answers
to
the
First
Three
Questions | 205 | |
| | Our
Fourth
Answer
to
the
Question | 206 | |
| Annexes | | | |
| I | of
Membership
the
Standing
Advisory
Committee
on | | |
| | Trunk
Road
Assessment | 213 | |
| II | Letter
to
Consultees
(June
1992) | 215 | |
| III | of
List
Those
Who
Provided
Evidence | 225 | |
| IV | Consultants'
Studies | 229 | |
| V | of
Road
The
Main
Stages
in
the
Planning
and
Construction
a
Trunk | 231 | |
| VI | Rt
Dr
Miss
Lees
letter
to
the
Hon.
Brian
Mawhinney
MP | 235 | |
| Tables | Page | |
|---|---|---|
| 4.1 | Driver Responses to Changes in Congestion |
36 |
| 5.1 | of Comparison Forecast and Observed Traffic Flows |
|
| Road on Trunk Schemes |
56 | |
| 5.2 | Barnstaple Bypass A39, Two-Way Average Annual Daily |
|
| Traffic Flows, pcu/day |
67 | |
| 5.3 | of of York Results Roadside Interviews Drivers Using |
|
| Northern Bypass (1988) |
69 | |
| 5.4 | Westway (M40) Traffic Flows, 1970, veh/day |
72 |
| 5.5 | (MIl Traffic Counts Corridor) 24-hour Two-Way Flow, veh/day |
73 |
| 5.6 | Traffic Counts (A316 Corridor) 24-hour Two-Way Flows, veh/day |
74 |
| 5.7 | Traffic Counts (Lower Thames Screenline) 12-hour Two-Way |
|
| Flows, veh/day |
75 | |
| 5.8 | Traffic Counts (Lower Thames Screenline) 24-hour Two-Way |
|
| Flows, veh/day |
75 | |
| 5.9 | Traffic Counts M25/River Lea Screenline, 12-hour Two-Way |
|
| Flows, veh/day |
76 | |
| 5.10 | Traffic Counts, Western Screenline, Rochester Way Relief Road (A2), |
|
| 18-hour Two-Way Flow, pcu/day |
78 | |
| 5.11 | Traffic Counts, Eastern Screenline, Rochester Way Relief Road (A2), |
|
| 18-hour Two-Way Flow, pcu/day |
78 | |
| 5.12 | Traffic Counts in Roads Crossing the Rochester Way Relief Road (A2), |
|
| 18-hour Two-Way Flow, veh/day |
79 | |
| 5.13 | Traffic Counts on the Leigh Bypass (A579), pcu/day (0730-1800) |
81 |
| 5.14 | Traffic Counts across East-West Screenline, Manchester Outer Ring |
|
| Road (M66), 12-Hour Two-Way Flows, pcu/day |
82 | |
| 5.15 | Traffic Counts on Roads Crossing Manchester Outer Ring Road (M66), |
|
| 12-Hour Two-Way Flows, pcu/day |
82 | |
| 5.16 | Traffic Counts Across the North Sea Canal, Amsterdam, 24-Hour Flows, |
|
| veh/day | 84 | |
| 6.1 | The Current National Forecast Adjustment Factors (NFAFs) |
95 |
| 6.2 | The Proposed Updated National Forecast Adjustment Factors (NFAFs) |
96 |
| 10.1 | of Variation Parameter Delta with Elasticity, Congestion Level |
|
| and Scheme |
139 | |
| 10.2 | of Variation Parameter Delta with Elasticity, Trip Matrix |
|
| and Scheme Type: Variable Elasticity Model (VEM) |
141 | |
| 10.3 | of Variation Parameter Delta with Elasticity, Trip Matrix |
|
| and Scheme Type: Constant Elasticity Model (CEM) |
141 | |
| 10.4 | of Variation Parameter Delta with Locational Substitution |
144 |
| 10.5 | of Variation Delta with Modal Substitution |
145 |
| 10.6 | Effects of Model Components on Trip Matrices |
148 |
| 10.7 | of Effects Model Components on Vehicle Hours |
148 |
| 10.8 | of on Effects Motorway Tolls Total Trips |
154 |
| 10.9 | of Effects Motorway Tolls on Car Traffic, Overall and in |
|
| the Motorway Corridors |
154 | |
| Figures | Page | |
|---|---|---|
| 3.1 3.2 |
of Definitions Existing and Induced Traffic and Trips of Coverage Responses Evaluated by COBA 9 |
21 23 |
| 4.1 | of Road Comparisons Traffic Growth and Increase in Space, Great Britain, 1980-90 |
32 |
| 4.2 | General Relationship between Speed and Traffic Demand |
46 |
| 5.1 | Actual (1992) and Design Year Forecast Traffic Flows on the M25 on Sections Opened Since 1980 |
52 |
| 5.2 | Accuracy of Traffic Forecasts, by Type of Trunk Road Scheme, Without Correction |
61 |
| 5.3 | of of Accuracy Traffic Forecasts, by Type Trunk Road Scheme, NRTF After Correction |
62 |
| 5.4 | Barnstaple Bypass |
68 |
| 5.5 | Road Schemes in London |
71 |
| 5.6 | Traffic Growth in Westway, Finchley Road and Old Brompton |
|
| Road Corridors |
73 | |
| 5.7 | Road Schemes in Greater Manchester |
81 |
| 5.8 | Amsterdam Orbital Motorway |
83 |
| 6.1 | The Department's Traffic Forecasting Process for |
|
| Trunk Road Scheme Appraisal |
97 | |
| 7.1 | The Relationship between Annual Average Daily Traffic Flow in Road the Design Year and the Standard Selected as the |
|
| Starting Point for Assessment |
105 | |
| 8.1 | The Demand for Trip-Making in Relation to its Cost |
113 |
| 8.2 | of The Demand for Trip-Making Assumed Independent its Cost |
115 |
| 8.3 | The Speed/Flow/Cost Relationship |
116 |
| 8.4 | The Effect on User Costs of Road Improvements |
|
| (as assumed in COBA) |
117 | |
| 8.5 | Additional User Benefit due to Induced Trips |
118 |
| 8.6 | of The Erosion User Benefits due to Induced Traffic |
119 |
| 8.7 | The Structure of the Traffic and Economic Appraisal |
120 |
| 9.1 | of of Effect Scheme-Related Growth on the Estimate Benefits |
124 |
| 9.2 | Effect of an Overloaded Do-Minimum on the Estimation of Benefits |
125 |
| 9.3 | of Effect Increasing Supply in a Saturated Network |
126 |
| 9.4 | A Before and After Paradox in Evaluation |
127 |
Contents
| 138 |
|---|
| 140 |
| 142 |
| 147 |
| 149 |
| 150 |
| 153 |
| 155 |
| 158 |
| Relationship between Supply and Demand Road Schemes in Cardiff Road Schemes in Cardiff Road Schemes in Belfast Road Schemes in West London Road Schemes in Norwich Motorways Around Bristol Road Schemes in Dortmund, Leeds and Bilbao The Northern Distributor Route and Development in Norwich |
EXECUTIVE SUMMARY
STANDING ADVISORY COMMITTEE ON TRUNK ROAD ASSESSMENT TRUNK ROADS AND THE GENERATION OF TRAFFIC: EXECUTIVE SUMMARY MAY 1994
- 1 The purpose of this Report is to address the question whether new or improved trunk roads induce extra traffic. Accurate traffic forecasts are central to the proper appraisal of road schemes, whether these are new road construction projects or improvements to existing roads. The evaluation of the economic costs and benefits and the appraisal of the safety and environmental impacts of a scheme is dependent on predictions of the amount and pattern of traffic using the new network compared with that on the existing network. Scheme design is also determined by these forecasts.
- 2 This problem is one of the most complex and difficult which traffic forecasters have to face: does improving the road system introduce extra traffic which, without the improvements, would not otherwise be there? Extra traffic may be caused, for example, by people, in response to improved road conditions, making more or longer trips. We call extra traffic of this kind, whatever its cause, 'induced traffic'.
- 3 At present, the traffic appraisal methods of the Department of Transport seek to represent accurately the pattern of existing traffic on the network to be improved, and to estimate how much of that traffic will divert to the new road. Forecasts of growth of traffic over time are based on the estimated future growth of the economy and changes in fuel prices. The traffic forecasts usually assume that there is no induced traffic. Should they do so?
- 4 The Secretary of State asked SACTRA to consider this question in these terms:
"To advise the Department [of Transport] on the evidence of the circumstances, nature and magnitude of traffic redistribution, mode choice and generation [resulting from new road schemes], especially on inter-urban roads and trunk roads close to conurbations; and to recommend whether and how the Department's methods should be amended, and what if any research or studies could be undertaken."
- 5 In preparing this Report, we have considered a wide range of oral and written evidence from the Department of Transport, other Government departments, local authorities, interested organisations and relevant professionals.
- 6 We identified the following four key questions:
- Does the provision of improved trunk roads and motorways give rise to induced traffic - is it a real phenomenon?
- If so, are the consequences in terms of the planning, design and evaluation of such road schemes significant - does it really matter?
- If so, for which types and categories of major highway improvement is induced traffic likely to be significant - where and when does it matter most?
- How should the current forecasting and appraisal methods be amended to allow for induced traffic - what needs to be done?
Is Induced Traffic a Real Phenomenon?
- 7 The layman's response to this question is that it is obvious that the answer is yes. The M25 has entered folklore as a road which is a victim of its own success, and must have induced significant amounts of new traffic. However, it is remarkably difficult to establish unequivocal quantitative evidence to prove this either way. There are several reasons for this. New roads have ripple effects on traffic over a wide area. Induced traffic may build up over time rather than appear at once, especially if the new traffic is partly associated with land-use development which may have been induced by the road. Evidence from traffic counts and before and after surveys is inherently subject to various sources of error, both in measuring what has happened and in assessing what would otherwise have happened in the absence of the scheme. Therefore, it is necessary to refer to a wide range of direct and indirect evidence before coming to a judgment on the balance.
- 8 We examined the evidence of differential patterns of traffic growth over time, expressions of academic and professional opinion, attitude surveys of drivers, and evidence based on economic argument. All of these tend to support the existence of induced traffic, but the economic argument is particularly strong. It is, in outline, that there is a logical link between two pieces of evidence and a conclusion, as follows. First, it is well established in the literature and in the methods used to produce the National Road Traffic Forecasts that the total amount of travel undertaken by vehicle users is somewhat responsive to the level of petrol prices. Secondly, it is also well established, and indeed is the cornerstone of the Department's road scheme evaluation procedures, that people attach value to savings in time spent travelling, and that these values can be represented in money terms with a reasonable degree of accuracy. It follows from these two propositions that travellers must, as a matter of logic, be assumed to respond to reductions in travel time brought about by road improvements by travelling more or further.
- 9 We also reviewed the direct evidence from before and after studies of a wide range of schemes including the M25, other schemes studied by local authorities, consultants in Britain and the Netherlands, and the Department's own monitoring of forecast and observed traffic on 151 trunk road schemes. We do not feel able to endorse the Department's conclusion that the balance of this evidence is against the existence of induced traffic. In particular, the studies show that increases in traffic counted on improved roads are, in general, not offset by equivalent reductions in traffic counted on the unimproved alternative routes. This is more consistent with the existence of induced traffic than with its absence.
- 10 Considering all these sources of evidence, we conclude that induced traffic can and does occur, probably quite extensively, though its size and significance is likely to vary widely in different circumstances.
Does Induced Traffic Matter?
11 The Department of Transport's appraisal policy has been that, with certain exceptions such as estuary crossings, induced traffic should not be allowed for in road scheme appraisal. The Department suggests that, even if induced traffic is a real phenomenon, it is of such little consequence for scheme design and economics that it can be safely ignored. Indeed, the practical interpretation of the advice in the Department's COBA Manual is that, by considering demand to be fixed and ignoring induced traffic effects, a conservative appraisal will generally result. However, it is recognised that, in cases where a road improvement stimulates additional traffic, and this additional traffic affects the level of congestion experienced on the network, failure to allow for induced traffic may lead to an overestimate of the benefits of schemes. Network conditions are nowadays such that this case is increasingly common.
12 We have reviewed a number of papers which have used theoretical and modelling approaches to address this problem. These studies demonstrate convincingly that the economic value of a scheme can be overestimated by the omission of even a small amount of induced traffic. We consider that this matter is of profound importance to the value for money assessment of the Road Programme.
Where and When Does Induced Traffic Matter Most?
- 13 Induced traffic is of greatest importance in the following circumstances:
- where the network is operating or is expected to operate close to capacity;
- where traveller responsiveness to changes in travel times or costs is high, as may occur where trips are suppressed by congestion and then released when the network is improved;
- where the implementation of a scheme causes large changes in travel costs.
This suggests that the categories of road where appraisal needs to be most careful are improvements to roads in and around urban areas, estuary crossing schemes, and strategic capacity-enhancing interurban schemes, including motorway widening.
14 Our conclusions are consistent with the principles of economic appraisal of roads expressed, for example, in the Department's COBA 9 Manual. The issues at stake here are those of appraisal practice, not of principle. Only in very exceptional cases, such as estuary crossing schemes, has the Department, in recent years, advised that the sensitivity of appraisal results to induced traffic needs to be tested. We do not think this advice meets the tests of caution and robustness in scheme appraisal which the Department has set itself. There is, therefore, a need for a change in appraisal practice.
What Needs To Be Done?
- 15 Road planning is currently undertaken in a hierarchical fashion, at national, strategic and scheme levels. This approach should be retained and developed so as to include all important demand responses to road improvements. The Department is currently reviewing the National Road Traffic Forecasts. We welcome this review and recommend that proper account is taken of the influence of road supply on road traffic demand at the aggregate national level.
16 Area-wide strategic appraisal, whether of a region, corridor or conurbation where improvements are proposed, needs to be greatly strengthened for a number of reasons:
- routes should be assessed in their entirety for environmental reasons decisions on schemes in one part of a corridor should not pre-commit environmentally
sensitive decisions elsewhere in the corridor without a thorough economic and environmental appraisal of the overall strategy;
the consequences of trunk road improvements for the pattern of land-use and development also need to be considered, primarily at regional or corridor level;
the combined effects of a series of improvements on the long-distance routeing of traffic must be studied at area-wide level; and
since traffic is stimulated in part by network quality, induced traffic effects must be considered at the wider network level.
17 We therefore recommend that scheme appraisal must be carried out within the context of economic and environmental appraisals at the strategic area-wide level which take account of induced traffic through variable demand methods. Much more emphasis needs to be placed on the strategic assessment of trunk routes within a corridor or regional or urban context.
18 Upgrading of whole routes ca~1not be implemented as one single scheme for financial and practical reasons. Scheme appraisal remains essential to test the design choices, to check the validity of the strategic-level analyses and to establish the value for money of each individual scheme. In the past, the norm has been to assume within scheme appraisal that the volume of traffic is a fixed quantity whether or not the scheme is in place. Since we have concluded that this is, in general, an unsafe assumption, to which appraisal results can be sensitive, it follows that scheme appraisal practice will need to change.
19 We recommend that variable demand methods should now become the normal basis of trunk road traffic forecasts, and that these forecasts must be carried through into the operational, economic and environmental evaluation of schemes in a systematic way. In particular, where networks are operating close to capacity, suitable procedures must be used to represent the constraint of traffic in the base case and the release of traffic growth in the do-something case as additional capacity is provided.
20 We recommend that the Department enhances its scheme monitoring studies so as to provide more information on induced traffic. We recommend that the Department's currently proposed programme of research, designed to investigate the responses of travellers to road network improvements, is given a high priority. Consideration should be given to expanding the current research effort to include in-depth analysis of a range of schemes and to cover the effects on land-uses resulting from responses by households, businesses and other organisations to road network improvements over a longer period.
21 We recognise that these recommendations will require the most radical changes in the traffic and economic appraisal of trunk roads since the development of COBA in the early 1970s. We have therefore made some interim proposals to assist the Department in making the transition. We have not reached our judgment lightly, nor do we underestimate the magnitude of the changes we are proposing. But we do not think that continuing to appraise solely at the scheme level using the fixed demand approach is, either intellectually, or in practical terms, acceptable. It is this central conclusion which has led us to make the recommendations in this Report.
PART I
INTRODUCTION AND DEFINITION OF THE PROBLEM
Chapters 1, 2 and 3
In this Part, we explain the Terms of Reference which gave rise to this Report, and describe the method of working which we have followed (Chapter 1). In Chapter 2, we discuss, in non-technical language, the problem of 'generated' or, as we prefer to call it, 'induced' traffic, which may result from improving existing roads and building new ones. We also identify some key questions for our inquiry in this chapter. Chapter 3 defines the problem, in more techical terms, and explains how different behavioural responses are capable of being translated into mathematical models for forecasting future traffic.
CHAPTER 1: INTRODUCTION TO THE REPORT
TERMS OF REFERENCE
- 1.01 In September 1989, the Committee (SACTRA) was given revised and expanded Terms of Reference to include the following matters:
- To advise the Department [of Transport] on the evidence of the circumstances, nature and magnitude of traffic redistribution, mode choice and generation [resulting from new road schemes], especially on interurban roads and trunk roads close to conurbations; and to recommend whether and how the Department's methods should be amended, and what if any research or studies could be undertaken.
- To review the Department's methods for assessing environmental costs and benefits, in particular whether a greater degree of valuation is desirable, the appropriate scope and application of valuation, and suitable methods for deriving monetary values.
- To continue to advise on any significant changes proposed in appraisal methods.
- 1.02 The first and second of our Terms of Reference required us to present separate Reports. We were asked to report on the issue of environmental appraisal first. 'Assessing the Environmental Impact of Road Schemes' was presented to the Secretary of State for Transport on 1 November 1991, and published by Her Majesty's Stationery Office with the Government's Response in March 1992.
- 1.03 Since the publication of that Report, Mr H J Wootton has resigned his membership of SACTRA on his appointment as Director of the Transport Research Laboratory; and we have been joined by Dr Denvil Coombe, Mr David Hutchinson, and Mr Michael Taylor. The current membership of SACTRA is set out in Annex I. SACTRA, in its present constitution, has reverted to the first of our specific Terms of Reference. This Report is the product of that work.
METHOD OF WORKING
- 1.04 In order to discharge this part of our Terms of Reference, we wrote during June 1992 to 172 bodies and individuals requesting written evidence. The text of our letter is at Annex II. We asked for evidence to be submitted by 1 September 1992. Evidence continued to be submitted, and we made further specific requests, after that date, and we have carefully considered everything which has been written. We received written evidence from the bodies and individuals who are listed at Annex III. Much of this material consisted of substantial papers and commentaries, some of which had already been published or prepared for other purposes, but many of which were prepared specifically for our benefit.
- 1.05 We held a workshop in London on 26 February 1993, attended by some of our respondents (listed in Annex III) who had presented empirical evidence which was of importance to a particular part of our study. In addition, Mr Peter Bonsall of the Institute for Transport Studies at the University of Leeds, presented a paper to us at
one of our meetings. Sub-groups of the Committee interviewed or consulted with a number of bodies, as listed in Annex III.
1.06 In parallel with these investigations, the Department commissioned work from Consultants on our behalf. In Annex IV, we list the Consultants and the studies which we asked them to carry out. In addition, the Department itself has provided us with a substantial quantity of factual evidence on its forecasting and appraisal methods, its direct experience of traffic generation, and much other background information.
FORM OF THE REPORT
- 1.07 This Report sets out our own conclusions on the considerable range of material which has been put at our disposal from these various sources. Our Report is arranged in the following sequence:
- Part I: Introduction and Definition of the Problem (Chapters 1, 2 and 3) Here, we set out the background to our Report, and define the problem which we were asked to address.
- Part II: The Evidence of Generated Traffic (Chapters 4 and 5) In this part of our Report, we review the evidence submitted to us, including the general arguments and empirical evidence for generated traffic.
- Part III: The Implications of Generated Traffic (Chapters 6, 7, 8, 9 and 10) In Chapters 6, 7 and 8, we give factual statements of the Department's current forecasting and economic evaluation methods, and the uses to which the forecasts are put in designing and appraising trunk road schemes. In Chapters 9 and 10, we explore the implications of generated traffic from economic logic and transportation modelling studies.
- Part IV: Conclusions from the Evidence and the Implications of Generated Traffic (Chapter 11)
- Part V: The Way Forward (Chapters 12, 13 and 14) In these chapters, we establish the need for changes to be made to current procedures, followed by our recommendations for change. We recognise that our recommendations will take some time to implement in full, and we offer, therefore, some suggestions for procedures which could be used in the interim.
- Part VI: Main Conclusions and Summary of Recommendations (Chapter 15)
MISS LEES
1.08 Miss Lees, while not criticising the contents of this Report, believes that the Committee have interpreted its Terms of Reference too narrowly. Her own contribution is contained in her letter to the Secretary of State dated 2nd September 1994 and a Minority Commentary, both of which are reproduced as Annex VI. With that qualification, the VIews expressed In this report are the unanImous VIews of the Committee.
CONVENTIONS
1.09 In Parts II, III and IV, we have highlighted important summaries and conclusions from the evidence and implications by emboldening the normal typeface. In Part V, we have also highlighted our recommendations by emboldening, but, in order to distinguish these from our conclusions from the evidence, our recommendations are given in italics. Direct quotations from the evidence are given in italics without emboldening.
ACKNOWLEDGEMENTS
1.10 We owe a considerable debt of gratitude to those who have provided us with so much helpful evidence and advice. They have furnished us with a library of information which contains, in aggregate, what we believe to be the most useful collection of material currently available on this complex and elusive subject. We would also like to acknowledge separately all those who gave up valuable time to attend our day's workshop and other meetings at our invitation. Senior officials of the Department have generously given us the benefit of their own expertise in this field, and we have had many helpful discussions with them. Finally, we wish to record our thanks to our Technical Secretary, Andy Braithwaite, our Administrative Secretary, Paul Syron, for the able and efficient way in which they have attended to the administration of our inquiry, and for the support we have received from Jenny Keirl and Wendy Simpson.

CHAPTER 2: IDENTIFYING THE NATURE OF THE PROBLEM
INTRODUCTION
- 2.01 The Terms of Reference which give rise to this Report address a question of fundamental importance for the planning and implementation of our national roads policy. Do we really understand the way in which road users respond to new trunk road schemes?
- 2.02 A scheme can consist of the building of a new road, or the improvement of an existing road. Every scheme involves the investment of a large sum of public money, and can also imply large private sector investment. Highway development can have a profound and long-term effect not only on the fabric of the nation, but also upon regional and local land-use patterns, the environment and the way in which people conduct their business and personal lives.
- 2.03 It is important, therefore, that these large investments should achieve their intended purpose. Whether they do so is critically dependent upon the way in which the new or improved roads are actually used, the amount of traffic which actually appears on them, and how that performance in practice measures up to what the policy-makers and roadplanners had in mind. In order to ensure that the public gets value for money, we have to satisfy ourselves that, so far as possible, those who make the plans and forecasts can estimate with reasonable accuracy and confidence the likely outcome of what they propose, bearing in mind that the period over which forecasts are required is often quite extended, frequently over two decades.
- 2.04 In a number of White Papers and other statements (Department of Transport 1987, 1989a, 1990 and 1994), the Government has set out the policy objectives which underlie its national Road Programme. These policy objectives are:
- to assist economic growth, by reducing transport costs;
- to improve the environment, by removing through traffic from unsuitable roads in towns and villages; and
- to enhance road safety.
The 1989 White Paper (Roads for Prosperity), in particular, heralded a significant expansion in the level of public investment in the trunk road system. It now stands at approximately £2000M per year. The Road Programme includes a substantial amount of upgrading of trunk roads and widening of existing motorways, as well as the building of new routes and bypasses. The aim is not just to relieve current congestion, in both urban and interurban areas, but to anticipate the congestion, accident and pollution consequences of the predicted growth in traffic over the next 25 to 30 years. Priorities within the Programme have recently been reviewed (Department of Transport 1994).
2.05 Also recently, the Government has published Planning Policy Guidance Note 13 (Department of the Environment 1994) with the aim of so arranging future land-use development that reliance on the motor car is reduced. This guidance will have a bearing on trunk road appraisal to the extent that longer-distance traffic is affected by such policies. The guidance is intended to help meet the Government's Sustainable Development Strategy.
- 2.06 In order to ensure that the Government's objectives for trunk roads are achieved, all proposed schemes are subjected to a detailed planning process. In SACTRA's 1986 and 1992 Reports, this planning process is described in some detail. For the convenience of readers of this Report, it is set out once again, in summary form, in Annex V. At the heart of the planning process is traffic forecasting - that is, the estimating of future levels of traffic on the relevant part of the highway network. These estimates serve four main and interlocking purposes. They enable the Department to plan the overall Road Programme, in judging which routes should be developed and which parts of the network should be improved ahead of the rest. Secondly, they enable them to decide on the appropriate scale for each new or improved highway - its layout (single or dual carriageways), number of lanes, its construction depth and the elaborateness of its junctions. Thirdly, these design characteristics all influence the extent to which traffic will be attracted to the new facility. This, in turn, provides the essential data on vehicle types, speeds, flow, accident rates, etc, on which the final economic and environmental assessments are based.
- 2.07 Much therefore turns on the forecasts of future traffic. Not only is the planning of a new highway scheme dependent on these, but also is the detailed design, the estimation of benefits in relation to capital and running costs, and the impacts which the scheme is likely to have on the environment.
- 2.08 There are some parts of the traffic forecasting process for which models are used more frequently than others. It is possible to estimate, using roadside interview surveys for example, the pattern of journeys, with their origins, destinations and purposes, which are currently made on the existing network. It is also possible to estimate how drivers' route choices will be affected when the network is improved, so that the new pattern of traffic (or, in technical terms, reassignment) on the network can be predicted. Such assignment calculations are essential to the appraisal of most trunk road improvement schemes. (Although assignment features in the appraisal of almost all trunk road schemes, we acknowledge that the process is not yet perfect and that the Department is currently carrying out further research into the factors which influence route choice.)
- 2.09 It is also possible to forecast the future rate of traffic growth and to apply the forecast growth rates to current patterns of traffic so as to predict traffic patterns at any future year. The role of the National Road Traffic Forecasts (NRTFs, Department of Transport 1989b) is, in essence, to provide official estimates of traffic growth rates, as a function of external factors such as economic growth and changes in petrol prices.
2.10 Rather less well-used are methods for the estimation of what new traffic might arise if the network were improved. There is a widespread belief that new roads 'generate traffic', that is, they encourage extra trips which would not otherwise be made. The resulting extra traffic could, for example, include more trips between the same origin and destination, or a change in the origin or destination (reflecting a decision to travel further to a more attractive place) or a shift from public transport to car. The
proposition is that a poor quality of service on the road network discourages (that is, suppresses) traffic and that, conversely, when a network is improved, extra traffic is generated (induced).
2.11 At present, this second part of the estimating process is not normally carried out by the Department of Transport, on the grounds that any estimates of generated traffic would be very uncertain and (for the most part) would have a very small effect on traffic flows. Critics of the Department, who point to some particular schemes such as the M25, where the traffic flows on all sections greatly exceed the forecasts, suggest that the traffic forecasting procedures, and the economic and environmental assessments and design decisions that depend on them, will always be fatally flawed unless and until this extra traffic is properly taken into account. These issues were analysed by the National Audit Office (NAO) in its 1988 Report on Road Planning. The NAG suggested that the accuracy of the forecasts made for certain schemes, notably the M25, might have been improved if a larger number of factors, including this 'generated' traffic, had been taken into account. The main purpose of our inquiry has been to judge whether the Department's current forecasting procedures are soundly based, and to consider whether there are methods, capable of practical implementation, by which those procedures can be improved.
'GENERATED' AND 'INDUCED' TRAFFIC
- 2.12 In paragraph 2.10, we pointed out that the general proposition that 'roads generate traffic' has been of considerable public concern and is of genuine importance to the Road Programme and indeed to transport policy in general. It is, however, necessary to be particularly careful about this word 'generate', which we shall generally avoid in the remainder of this Report. This is for two reasons.
- We take it as axiomatic that travel is rarely an end in itself. People make journeys to carry out the everyday obligations of personal and social life, and to engage in work and leisure activities that bring them economic or other benefits. Private companies and public institutions engage in the movement of goods and the provision of services that bring them financial gain or enable them to discharge their statutory responsibilities. Very few journeys are made simply for the pleasure of the journey itself. It is conceivable that a new or improved road might stimulate some sightseers to inspect its design or sample the views but, in general, what really generates travel are the patterns and locations of residences, workplaces, sources of materials and supplies, shops, hospitals, leisure facilities and so on. In other words, better access between land-uses permits a greater level of social and individual activity which is travel-dependent. Indeed, better access in itself allows for land-use locations to change, for new land-uses to develop, and for land-use patterns to evolve.
- In the mathematical analysis of travel patterns, a well-established tradition has developed giving the word 'generation' a specific technical meaning, namely the average number of trips that are made, per hour or per day, by a specific category of travellers in a specific geographical area. The same logic applies to the trip generation associated with a particular development, for example a supermarket, for which there are widely-used figures related to floor space,
location and so on. These uses relate essentially to a number of trips, not to a volume of traffic. We shall have more to say on this later.
2.13 To avoid any confusion, therefore, we have adopted the word 'induce' and we rephrase the question: do new or improved roads induce traffic? We shall consider, as far as possible, all of the many different mechanisms by which induced traffic might arise and then go on to assess its significance.
BY WHAT PROCESSES MIGHT ROAD IMPROVEMENTS INDUCE MORE TRAFFIC?
- 2.14 We have pointed out that the demand for travel arises because of the sum total of social and individual activities and the evolving land-use patterns that influence their location. We know that, in order for this to happen, many millions of individual decisions and choices have to be made. Policies and plans are formulated which determine the broad patterns of land-use and of economic development, and define environmental sensitivities. Companies are formed, others go out of business. Public agencies change their workload and priorities. Individuals form and reform into households, obtain and lose employment, develop tastes and preferences. The general state of the economy will determine how much money people have and, therefore, influence the number and size of cars that people buy and the sorts of places they wish to visit. Fuel prices may change as a result of national policy or international developments. Improvements in telecommunications may change the balance of the time spent between in-home and outof-home leisure.
- 2.15 So the question may be redefined. Given that all these choices and decisions are continually being made mainly for other reasons, might not the provision of extra road capacity, to some extent, change the decisions that individuals and agencies make, in such a way that there is an effect on the total volume of traffic? It is helpful to list the main ways in which this could, in principle, occur. These are responses connected with:
- the total volume of activities;
- the location of activities;
- the timing of activities;
- the mode of transport used;
- the co-ordination of activities by different individuals;
- the route chosen; and
- the effects of the other responses.
RESPONSES CONNECTED WITH THE TOTAL VOLUME OF ACTIVITIES
2.16 Let us consider a large road scheme that provides a new ring road around one town and substantially reduces the time it takes to travel to the centre of another, by improving the links with an existing motorway which runs between the two towns. What might happen as a result? It is often hoped that a new road will give a boost to the area it serves, encouraging developments in the local economy, either by the reduced cost of production and distribution for local companies, or by symbolic and psychological factors connected with business confidence in the area. If this confidence results in local employers expanding their operations, and thereby the number ofjobs increases overall, then clearly there would be an increase in the number of work trips, deliveries and so on, and the local economy would benefit.
2.17 The same would occur for those land uses that require a certain minimum catchment population to make them viable, for example, a regional sports centre. Each of the towns on its own might not be able to support such a centre but, with easy access from both, a facility located between them might become possible. If so, then of course people will travel to use it in favour (perhaps) of more local facilities. The traffic travelling to and from new land uses will, of course, be most noticeable in the immediate vicinity of the developments. At a more personal level, it may be that the improved access and reduced travel times makes it possible to fit in some small additional activity that previously was not possible, for example, to go home for lunch and to visit a supermarket on the way.
RESPONSES CONNECTED WITH THE LOCATION OF ACTIVITIES
- 2.18 The same process also influences changes in the closely-related question of the location of activities. Even before the new road is completed, the more alert companies and individuals may realise that there is advantage to be gained from moving to make use of the opportunities offered by better communications. A retail firm could decide to apply for planning permission for a new out-of-town superstore, close to a new intersection, instead of a town-centre location which they had been considering. A health authority may decide to replace some small local hospitals by a new regional hospital with good road access. Individuals may calculate that a journey to work which was previously impractical would soon be rather convenient using the new road, and buy property or apply for jobs that they previously ruled out, even though the move may require the household to have two cars instead of one.
- 2.19 In this case, many of the decisions taken before the road opens would have ramifications afterwards. Thus, out-of-town shopping centres tend to rely on a higher level of car use by the customers and different patterns of lorry deliveries by the suppliers, than town centre shops. This could increase suburban traffic levels and, at the same time, reduce town centre traffic. In our first town, the ring road may encourage work journeys from one suburb to another to be made by car. In our second town, improved road access to the town centre may tempt more drivers to do their shopping there, although this would be subject to the availability of parking space.
- 2.20 The responses will not be purely economic in character but also political. For example, the town centre in the bypassed town could start to lose trade and the shops might become less attractive. The immediate response could be either to increase shoppers' parking space (and/or to reduce its price) or to encourage park-and-ride. Alternatively, the centre could try to compete by making a merit of their lower traffic levels, engaging in large-scale pedestrianisation and urban improvement, hoping to win shoppers back
on an improved public transport network. In due course, the traffic levels in the centre of the second town may become excessive and there may be political responses there, too, of traffic restraint, parking control, and so on.
- 2.21 All these decisions are rather far-reaching and, although some responses might occur rapidly, it is unrealistic to assume that everything would settle down quickly. Other companies and individuals will take much longer to perceive the new opportunities (and may even be too late to make use of them). New residents moving into the towns for other reasons will build up their patterns of working and living which take on board the access offered by the new road. The consequent effects on patterns of land-use and the local economy will evolve over many years.
- 2.22 So, given that the pattern of land-use and activities is the major determinant of traffic, we would want to take account of any alteration in these patterns which is stimulated by the changes in ease of movement that a new road will afford.
RESPONSES CONNECTED WITH THE TIMING OF ACTIVITIES
- 2.23 A new road is, of course, available on a 24-hour basis, but people always tend to use it more at some times of the day than others. Because of the way that human beings arrange their lives, people generally prefer to carry out many of their out-of-home activities by leaving home at a comfortable time in the morning and getting back in the early evening. Before the road was improved, traffic congestion might have been so bad that those people who had a choice decided instead to leave home at a second-best time - earlier or later than they would have preferred. With the improved road, they can revert to a more convenient time.
- 2.24 More indirectly, there is an evident pattern (not necessarily to do with transport) for large out-of-town shops and garden centres, for example, to adopt different conventions on opening hours and days of the week than has been traditional. If the developments referred to above actually occur, there could be some shift in the daily or weekly balance of peak period and off-peak traffic, as shopping and recreational patterns change.
RESPONSES CONNECTED WITH THE MODE OF TRANSPORT USED
2.25 Quite apart from the structural changes discussed above, people will continue to make some - perhaps many - trips from the same origin to the same destination for the same purpose at the same time of day as before. However, it may be that the improved road now makes it practical for some people to travel by car or even coach, instead of the train they used previously. Alternatively, if measures such as bus priorities and parkand-ride facilities are implemented along with the new road, it may be that a new balance of advantage could lie with buses, where previously they had been made unreliable by congestion. In that case, there might be some people who would find it better to make some journeys by bus instead of car or train.
RESPONSES CONNECTED WITH THE CO-ORDINATION OF ACTIVITIES BY DIFFERENT INDIVIDUALS
2.26 There are a number of types of journey where the needs of more than one individual have to be taken into account, for example complex round-trips to take the children to school and then call in at the shops on the way to work, or arrangements to share car use among employees at the same workplace. In these cases - which are often quite tricky to organise - new road facilities might just tip the balance between what is practical and what is not. This could result in an increase in the number of people sharing cars (resulting in less traffic) or the possibility of fitting in more journeys using the same car (resulting in more traffic).
RESPONSES CONNECTED WITH THE ROUTE CHOSEN
2.27 Often several different routes can be chosen for a given journey, and it will nearly always be the case that an improved road changes the balance of advantage of one route over another, so more people will find it convenient to use the improved route. The effect of this in terms of traffic could be in either direction: if the improved route is no faster but more direct, then the mileage travelled by vehicles using it will go down. On the other hand, it may be that speeds on the improved road are so fast that drivers find it worthwhile going some distance out of their way to use it. In this case, the journey time will go down, but the total miles travelled will go up and there could be an increase in traffic on other roads leading to the new route.
RESPONSES CONNECTED WITH THE EFFECTS OF THE OTHER RESPONSES
2.28 Everyday experience of modern life suggests that, in general, where an increase in the amount of traffic occurs, it tends, after a certain point, to go slower. This means that, if any or all of the above responses become important, they start to influence the conditions on the improved (and other) roads and, therefore, change the context within which travel decisions are being made. If many people desert an alternative, unimproved route, it may (in due course) become more attractive to other people who find its accessibility enough to open new opportunities for them. If too many new activities are encouraged by the improved road, then travel on it will be impaired by congestion and, after a while, some of them may be put off again. There is a continual process of feedback and it may be many years before all these interacting decisions settle down or, indeed, this may never happen as patterns of activity and accessibility continually interact.
CONCLUSION
2.29 Consideration, in broad terms, of the decision-processes known to be part of modern living establishes that it is possible for extra traffic to be induced by provision of extra road capacity. However, if this occurs, it is likely to be marked by quite complex processes, with some responses which will start immediately, or even before, the improvement is completed but others which will take quite a long time to occur.
FOUR KEY QUESTIONS
- 2.30 The task of untangling these causes and effects, in terms of the future traffic predicted for any given road scheme, is the one we confront in the remaining chapters of this Report. The task will require answers to four main questions on the basis of the best evidence available. These are:
- Does the provision of improved trunk roads and motorways give rise to induced traffic - is it a real phenomenon?
- If so, are the consequences in terms of the planning, design and evaluation of such road schemes significant - does it really matter?
- If so, for which types and categories of major highway improvement is induced traffic likely to be significant - where and when does it matter most?
- How should the current forecasting and appraisal methods be amended to allow for induced traffic - what needs to be done?
THE BURDEN OF PROOF
2.31 In pursuing our task, we have not assumed at the outset that any particular approach to these questions is more likely to be correct than any other. We have not made the assumption that current Departmental practice must be correct or even the best available. We took the view also that it does not rest solely with critics of current procedures to satisfy some -burden of proof or argument that new procedures should be put in place. We have attempted to look at the whole of the evidence and to weigh all the arguments as impartially as we can, in order to see whether, in aggregate, they tend to support one approach rather than another.
THE STRUCTURE OF THE REST OF OUR REPORT
2.32 Our Report is structured around the four questions in paragraph 2.30. In Chapter 3, we define induced traffic more precisely; this completes Part I. In Part II (Chapters 4 and 5), we consider the evidence from all sources, for and against the induced traffic phenomenon. In Part III (Chapters 6, 7 and 8), the Department's traffic forecasting and appraisal procedures are described. Then, in the rest of Part III (Chapters 9 and 10), we consider the implications from economic logic and transportation modelling work as to whether, and in what context, induced traffic is likely to be of consequence for trunk road appraisal. Part IV (Chapter 11) draws together our conclusions from the evidence. In Part V, we address the need for change (in Chapter 12), and what needs to be done, both in the longer term (in Chapter 13) and immediately (in Chapter 14). Finally, in Part VI (Chapter 15), we bring together our main findings and all our recommendations.
REFERENCES
Department of the Environment, Department of Transport (1994). Planning Policy Guidance: Transport. PPG13 (March 1994). HMSO.
Department of Transport (1987). Policy for Roads in England: 1987. HMSO: Cm 125-1, volume 1, paragraph 2.4.
Department of Transport (1989a). Roads for Prosperity. HMSO: Cm 693, paragraph 26.
Department of Transport (1989b). National Road Traffic Forecasts (Great Britain) 1989. HMSO.
Department of Transport (1990). Trunk Roads, England: Into the 1990s. HMSO, paragraph 1.2.
Department of Transport (1994). Trunk Roads in England 1994 Review. HMSO.
National Audit Office (1988). Department of Transport, Scottish Development Department and Welsh Office: Road Planning. HMSO. Cm 688.
SACTRA (1986). Urban Road Appraisal. HMSO.
SACTRA (1992). Assessing the Environmental Impact of Road Schemes. HMSO.
Sustainable Development: the UK Strategy. HMSO. Cm 2426.
CHAPTER 3: DEFINING THE PROBLEM IN MORE TECHNICAL TERMS
INTRODUCTION
- 3.01 In the last chapter, we endeavoured to identify the nature of the problem set by our Terms of Reference. In this chapter, we go on to define the problem in more technical terms.
- 3.02 Although traffic assignment is a key part of the overall assessment procedure, which any proposal for a road scheme must undergo, it deals with only one potential response by trip-makers (that is, their choice of route) to the improved accessibility afforded by a new road. There are many others, which we describe in what follows. Some, or (arguably) all, of these other responses can lead to additional journeys by vehicle which would not otherwise occur if a particular road was not improved. This is the basis of our definitions of induced traffic and (where appropriate) of induced trips. Finally, we identify in broad terms how these various responses are likely to come about over the useful economic life of a new road, as a result of (a) a fall in the generalised cost of travel, (b) a rise in the real income of those travelling, and (c) a change in the pattern or intensity of land-use activities.
THE IMPORTANCE OF BEHAVIOURAL RESPONSES
- 3.03 Crucial to our Report, therefore, is a clear understanding of the behavioural responses of vehicle users to the sudden and substantial improvements in travel conditions that can occur when a new scheme opens, and to the gradual and cumulative deterioration in conditions thereafter as traffic levels and congestion rise. Some of these responses will be immediate, influenced by conditions which drivers actually experience in the course of their journeys, but many will be fashioned over a longer period from many such journeys and information gleaned from others. Certainly, the picture of where and when congestion is likely to occur is built up in most people's minds through the accumulation of (usually bad) experiences.
- 3.04 The important point here is that travel demands on any particular route or network are not pre-ordained. They arise out of tens of thousands of individual choices being made every day, with each person in the population deciding where, when and how they wish to travel. Quite reasonably, they make these decisions in their own interest, rather than that of the community as a whole, and on the basis of the best information available at the time, which is often rather poor. The purpose of building a mathematical model of the travel demand that results from all these choices is to be able to predict how that demand might change, as the circumstances determining those choices change.
3.05 For anyone contemplating a journey, for any given purpose, there is a set of decisions that inescapably have to be made. The main ones are listed below, together with the terms (in parentheses) which describe the mathematical procedure that each represents within transportation models. The decisions are:
- whether or not to travel at all? (trip generation)
- which destination is best for the purpose? (trip distribution)
when is the best time to set out on the journey? (trip scheduling)
which is the best mode of transport to use? (modal choice)
what is the best route to take? (traffic assignment)
whether to travel alone or with others? (vehicle occupancy)
how often to repeat the journey within a given period? (trip frequency).
3.06 In real life, of course, journey decisions are often more complex than this simple recursive list of choices implies. The separate choices can interact, such that a decision on the best mode of transport to use (say) may well depend upon the choice of destination and whether or not one wishes to travel with others. Moreover, not all travel demand consists of single trips each for a single purpose. Several destinations could be included on one round trip, for example, to satisfy different journey purposes of the various occupants of just one vehicle. This kind of complexity makes it difficult to develop reliable and accurate models of travel demand that adequately reflect its behavioural basis.
GENERALISED COST AND THE ELASTICITY OF DEMAND
- 3.07 Nevertheless, it is widely recognised that the main determinant of travel choice is the value that an individual places on undertaking any particular journey over and above the perceived cost to that individual of doing so. Indeed, this 'consumer's surplus' value is the measure used currently by the Department in the economic evaluation of trunk road schemes. The cost is not reckoned as just the out-of-pocket expenditure or the amount of time spent on the journey (both of which are clearly important) but in terms of 'generalised' cost of travel. In theory, this generalised cost will include not only the distance-related and time-related costs of a journey but other components of the overall perceived disutility of travel, such as inconvenience, discomfort and the risk of accident.
- 3.08 In this way, both in modelling the future traffic likely to use a new road scheme and in evaluating whether investment in the scheme would be worthwhile, this notion of the perceived generalised cost of trip-making is central. It is the logical and consistent basis for explaining the outcome of decisions made by individuals when confronted by travel choices. It also leads directly to the concept of elasticity of demand for travel, that is, where a given (proportionate) change in the generalised cost of travel will cause a corresponding (proportionate) change in trip-making. Demand is said to be elastic if a relatively small fall in generalised cost per trip results in many extra trips being made. By contrast, demand is inelastic if a relatively large fall in generalised cost per trip results in few (if any) extra trips being made.
FORMAL DEFINITION OF THESE PROCESSES IN TRANSPORT MODELS
3.09 A wide range of reasonably well-established procedures exist, which are aimed at replicating the effects mathematically of many of the hypothetical behavioural responses discussed above. All involve necessary simplification, especially in failing to consider the sequence of responses over time but, with this caveat, many of them provide formal methods of estimating the effects of new road capacity on the amount or location of traffic. The Department's appraisal of trunk road schemes does not normally use these,
or other, procedures to make such estimates, except in relation to drivers' selection of route, which is considered to be the only important difference between the situation with and without an improvement.
- 3.10 For road appraisal, there has been a long tradition of developing mathematical representations of some but not all of the processes described above, in the form of models which both simplify and define precisely the complexities of human behaviour. Using traffic surveys and other statistical data, these models attempt to capture some of the main possibilities for use in a forecast of the actual size of the responses modelled.
- 3.11 Ideally, we should describe a usable mathematical model for each of the relationships outlined above. Unfortunately, this is not the case, for three reasons.
- All the responses described are in terms of processes of change which take place over time, at a faster or slower pace. The majority of models in transportation planning use data collected at a single point in time (which obviously cannot measure the pace or sequence of change) and represent an equilibrium end-point, that is, the pattern after all the responses and their feedback effects have occurred.
- While some models are behavioural in their representation of individuals making choices, most of them bypass the consideration of individuals and measure the aggregate effects of a larger population.
- Only some of the behavioural responses mentioned have so far been the subject of research which has led to models used in practical applications.
- 3.12 With these caveats in mind, it is useful to describe the tools which have been developed, either in the course of research on traveller behaviour and choices, or as part of the standard toolbox of transportation planning consultants in the UK. Some of these models are discussed in more technical detail in later chapters but, at this stage, we are concerned with the general principles and scope.
MODELLING LAND-USE CHANGES
- 3.13 In modelling changes in land use, it is important to understand the interplay between the planning of roads and the statutory land-use planning system. The forward prescription of land-use for a given geographical area covered by a local government authority (County or District) is undertaken in the form of a Development Plan. The policies in such plans relate to national policies and also cover the local authority's intentions and aspirations for such matters as future economic development, land-use distribution and intensity, and environmental protection. These plans will usually include the future improvement in transportation, including the building of new roads or improving the capacity of existing ones. Plans, however, cannot provide insights into future behavioural changes or future land-uses in cases where increased road capacity occurs which was not taken account of in the plan, or where land-use change is permitted on appeal, against the stipulations of the plan.
- 3.14 A family of computer models exists which seeks to reproduce the effects of these changes. They encompass some of the important responses about the overall level and location of activity. They are being used in an experimental way in the early stages of
the appraisal of some of the Department's trunk road proposals, such as the M25 widening and the Lower Thames Crossing.
TRIP GENERATION
3.15 Procedures are widely used that calculate the total number of trips likely to be generated in an area, with a given pattern of land-use activity. Usually, statistical relationships are found in a cross-section survey between the number of trips (usually excluding walking) on the one hand and a list of factors like income, employment status and household size, on the other. Car ownership usually represents the bridge between income and the number of trips. It is most commonly assumed that the cost or speed of travel does not influence the number of trips generated. These are used in the Department's appraisals, but not in a way that allows the number to vary as between the situation without and with a new or improved road. (The numbers of trips starting or terminating in an area are usually referred to as 'trip ends'.)
TRIP DISTRIBUTION
- 3.16 A study area can be divided into a convenient number of zones and an orlglndestination matrix constructed, that is, a table which shows how many trips leave each zone and go to each other zone. These numbers are partly taken from surveys and partly estimated from mathematical relationships based on the idea that, other things being equal, the number of trips between pairs of zones will depend on the relative generalised costs. These models do not attempt to emulate individual decision processes, but the overall pattern is intended to reflect the different land-uses of the zones and the generalised cost of travel between them. If, as a result of a road improvement, there is a change in the proportion of trips going to one destination rather than another, that is called 'redistributed traffic'.
- 3.17 Such a model could allow the distribution ofjourneys (but not usually the total number) in an area to adjust to changes in the road network, by changing the generalised costs of travel. When this facility is not used, the result is termed a 'fixed trip matrix', that is, the total number of trips between every origin and every destination is unaffected by the cost or convenience of travel. (As is explained in Chapter 6, the appraisal of the Department's schemes is currently based on the assumption that the trip matrix remains fixed.)
MODE CHOICE
3.18 The choice of mode of transport (for example, car or train, car or bus) is commonly modelled by some attempt to replicate individual behaviour, based on the argument that, for a given journey, people will choose the mode which minimises their generalised cost. Such models make an estimate of the effect of changes in the network on the mode chosen, mainly via the change in relative speed. They are very rarely used in trunk road appraisal.
JOURNEY SCHEDULING
3.19 Recent work has produced approaches in which the decision about what time of day to travel is represented, broadly comparable with the way in which choice of mode is handled. These could incorporate the effects of network changes on traffic flows at particular times of day, being able to calculate, for example, whether a peak period was likely to become more spread out or more compressed. These sophisticated methods are not used in trunk road appraisal. However, some simplified methods have been used in recent years to estimate the extent to which the peaks will spread in response to rising congestion.
ASSIGNMENT OF TRAFFIC
3.20 The term 'assignment' is used for models which allocate vehicle trips to routes through a network, in a way which is intended to represent drivers choosing between the routes available to them. A variety of models exist: the most advanced make estimates of the effects of speed changes on the proportion of drivers choosing one road or another. Such models also incorporate a facility to calculate the effects of extra traffic on travel times, and make a series of iterative estimates, taking these feedback effects into account, until the outcome relative speeds match the proportions of trips choosing each route. These models are, as a matter of course, used for trunk road appraisal.
ACTIVITY MODELS
3.21 Cutting across the structure of models described above, a number of approaches are founded on the description of a profile of the activities carried out by an individual or household during a day. The trip patterns that result are subject to the constraints in space and time imposed by the available pattern of destinations and travel opportunities. These models tend to focus on an ordered schedule of round trips carried out during a day and can handle some of the more complex interactions among individuals discussed above. They are not used in formal road appraisal (though their underlying logic has influenced scheduling models) but have been applied as research tools in a number of other transport policy applications.
ECONOMIC MODELS OF DEMAND ELASTICITY
3.22 A long and well-established body of empirical and theoretical analysis exists, which aims at detecting statistical relationships among quantities like traffic levels, fuel consumption or numbers ofjourneys, and measures of the generalised cost of travel. These frequently use quite long time-series of aggregate data. They are not used directly in road scheme appraisal (although they may quite often be used for the appraisal of public transport projects) but are the source of important components in the National Road Traffic Forecasts (Department of Transport 1989). Their results are sometimes used as constraints or plausibility checks on the outputs of other models.
COMBINATIONS AND HIERARCHIES OF MODELLED EFFECTS
- 3.23 Using various combinations of these models, it is possible to make predictions of most but not all of the responses outlined earlier in this chapter. The actual processes would be weak, there would be some problems of consistency (for example, travel costs are assumed to be important in some of these models and not in others) and consideration of timescale would be absent.
3.24 In practice, there are three different sorts of combination which have been much more important than others. These are as follows:
There is a conventionally established package, often called the 'four-stage model', comprising models for trip generation, trip distribution, mode choice and assignment, arranged in an interacting sequence thought to have an analogy in individual choice processes (shall I travel? where shall I go? what mode shall I use? which route shall I take?). For many years this was the dominant established tool in urban applications.
More recently, models often referred to as 'strategic transportation models' have been developed. These models contain two other responses in addition to the four included in the four-stage models, namely, choice of trip frequency and time of travel. The travelling public is disaggregated into many more segments than in four-stage models, with the demand responses of each segment being treated individually. This greater detail in the demand modelling is usually at the expense of a much simplified treatment of the supply side (the transport networks). Some of these models enable the hierarchy of travellers' choices to differ according to the purpose for which journeys are made.
There is a different form of hierarchy on which the Department's trunk road appraisal procedures are based which, although it has few elements of behavioural response, is very elaborate in its treatment of the relationship between national, regional, local and scheme-specific estimates of traffic. This is described in more detail in Chapter 6.
OUR DEFINITION OF INDUCED TRAFFIC
- 3.25 Turning specifically to the phenomenon of induced traffic and to the precise definitions required for the purposes of this Report, we need to look in more detail at the various types of behavioural response which can occur immediately a new road is opened to traffic and in the short-run, medium-run and long-run thereafter. This is done in Figure 3.1.
- 3.26 Starting in the top left-hand corner of Figure 3.1, we have the truly fixed orlglndestination matrix, with everything given. This initial matrix is taken for the purpose of our definitions to be of person-trips per day. If it was of vehicle-trips per day, instead, some of the areas defined in the table would be different. One of the obvious differences would be those trips that switched from other modes. These are existing trips in a person-trip matrix but would be induced trips in a vehicle-trip matrix. Thus, in defining the terms we need for this Report, great care must be taken in defining the context within which each is set.
- 3.27 With a fixed matrix of person-trips per day, several behavioural responses to the opening of a new road can occur, without any new trips being induced. These could be:
- some drivers choosing to divert from old roads in the network to the new (change in route);
- more people choosing to travel in the peak period (change in timing);
- some people choosing to go by car rather than by bus or train (switch from other modes); and
~r.J1 0..0 g S (t) (t) so= () (J'Q 0 VJ Er (t) ~. ~~ = -< .. ...... r.J1 0 ..... (t) r.J1 C'" ...... ;- 0 p-'(t) = ~. 53 r.Il £'(Jq SO (t) (t) 0 0 r.J1 () 0 () 0.. .. (t) ...... () r.Il ...... = S.· =- (JQ '-<(Jq () r;o= = !. = r.J1 00 =- (t) = p-' =- (t) ~.0 =S= () c-= r.J1 Qi ...... p-' f......... 0 '-< ~. VJ
0..
(JQ= ..... c-=
r.Il
......
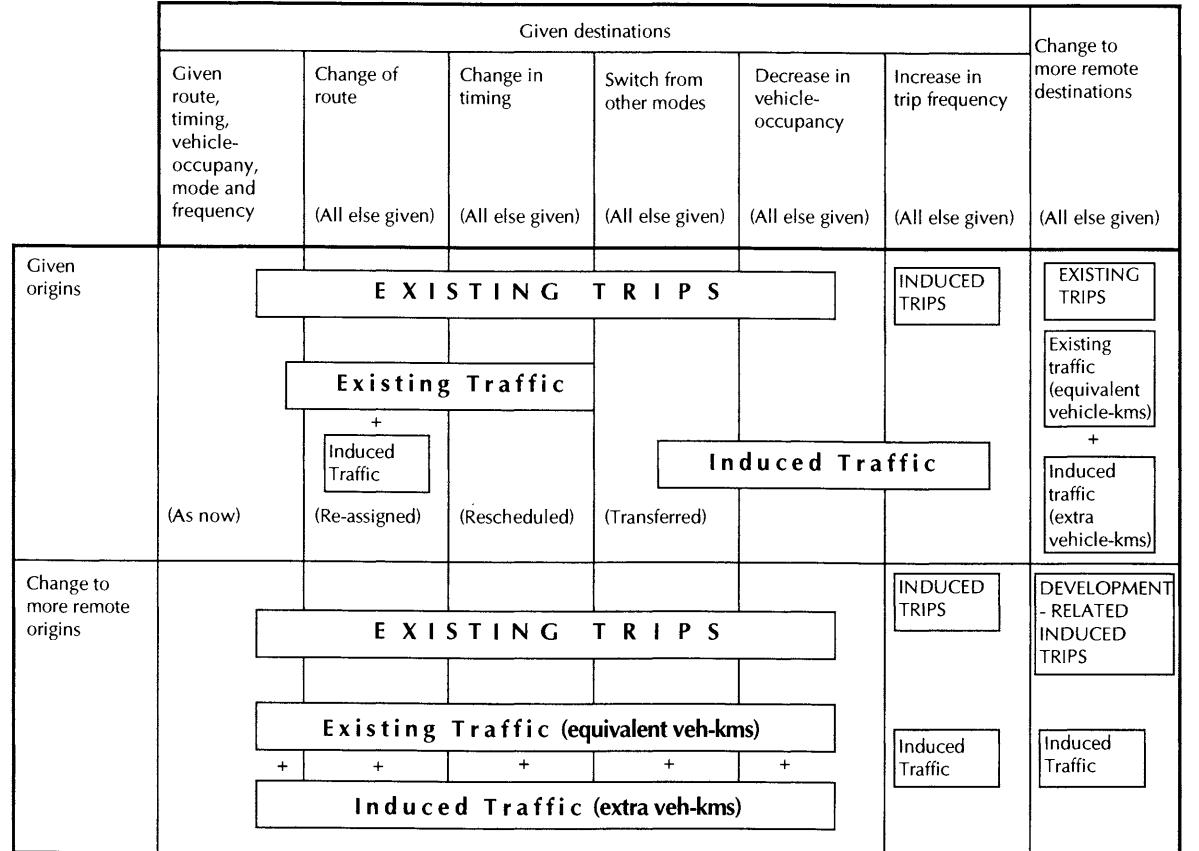
- 3.28 These responses are all described in terms of personal choices because that is how overall travel demand is generated. They are all changes within the framework of a fixed trip matrix because they are choices made by people already committed to undertaking those (given) trips. The odd one out is the 'increase in trip frequency' response (Figure 3.2). This is because, if more trips were made between any origin and destination as a result of a new or improved road, the extra trips would be over and above those in the existing matrix. Choosing to go home for lunch instead of eating at the workplace is a classic example of this change. It adds two more work trips per day for each commuter who decides to do so.
- 3.29 Of course, the opening of a new road could also have the effect of decreasing the frequency of some trips, for example, for convenience foods shopping. Instead of more frequent trips to a local shop (whether by car or on foot), these may be replaced by less frequent trips to a large supermarket (typically by car). To the extent that fewer trips are made for this purpose, there is a trip suppression. However, to the extent that the supermarket is further away than the local shops, extra distance is incurred on each trip. Overall, for the same quantity of groceries purchased, there could be an increase in the car-kms of traffic run. This is the seemingly perverse case of induced traffic arising as a consequence of suppressed trips. As a phenomenon, this 'fewer trips but further' is usually associated with increasing concentrations of land-use activity (for example, retail superstores, regional hospitals and leisure complexes). We discuss these developmentrelated issues further in Chapter 4.
INDUCED TRAFFIC IN THE CONTEXT OF A FIXED TRIP PATTERN
- 3.30 Remaining for the moment to the existing land-use pattern and fixed trip matrix, all four responses listed above in paragraph 3.27 involve existing trips. Nevertheless, some of the changes, due to an improvement in the network, could result in induced traffic. This is obvious in the case of a switch (of trips) from other modes. Journeys previously made by train, for example, to a given destination for a given purpose, when made by car instead, add traffic to the road network. The same is true when people choose to use their own car instead of travelling by bus or in someone else's car as a passenger. In all these cases, there are no induced trips (as the trips were being made anyway) but there is induced traffic and all of it in the context of a fixed matrix of person-trips per day - see Figure 3.2.
- 3.31 Clearly, the behavioural responses described here are all plausible. Some might say they are also commonplace and observable. It must be admitted, however, that conventional economic evaluation procedures do not take much account of them, as can be seen from Figure 3.2. Indeed, the only response estimated in most scheme appraisals is that of route choice. This is traffic assignment which, as we said earlier, is the key to the economic and environmental assessment of schemes. Compared to route choice, these other responses have hitherto been regarded as second order. This view may need to be revised.
\0
- 3.32 Interestingly, within the strict definitional terms we are setting for ourselves in this Report, a component of induced traffic can even result from the traffic assignment process applied to a fixed trip matrix. This arises from the extra distance that many drivers are prepared to travel, so as to make use of a new road, to reach a given destination. Because they can travel at higher speed on the new road, they are prepared to incur extra travel distance for a saving in overall travel time - entirely consistent with their objective of minimising the generalised cost to them of the journey. Of course, some journeys by the new road will be shorter and quicker but, for most trips, a tradeoff between distance and time will be needed. Moreover, the extent of this trade-off will be influenced by such factors as the value of the trip being made and the income of the trip-maker. In future, if real incomes continue to rise, more people could be willing to pay for time savings, even at the expense of higher vehicle operating costs. Furthermore, people's perceptions are especially relevant to this trade-off. The cost of delays in travel time are perceived by most people much more keenly than the cost of running their car (especially when calculated at the margin). This means, in future, people will be even more likely to trade extra trip distance for the chance of travel time savings.
- 3.33 Overall, the induced traffic due to the extra kilometres run by vehicles diverting to new roads may not be significant in the case of bypasses of small towns or the widening or upgrading of existing trunk roads, but could well be significant where entirely new routes are concerned. The special case of this is a new orbital route around a large conurbation. Here, the temptation to undertake cross-town suburban trips by going 'out, round and back in' could add considerable extra traffic to the network, for the same number of trips being satisfied. Yet more traffic can be attracted to an orbital road by longer-distance rural trips choosing to come 'in, round, and back out again'. Both of these examples suggest that some elasticity effects may occur for traffic, even within the framework of a fixed trip matrix. At this stage, we make no comment about the amount or value of this induced traffic, but merely establish that it is a real consequence of almost any change that is made to an existing highway network.
INDUCED TRAFFIC IN THE CONTEXT OF VARIABLE TRIP PATTERNS
- 3.34 Consider now the semi-variable trip matrix situations, where either new destinations are chosen for given trips (top right of Figure 3.1) or, through people moving to new houses, the same trips are made but from new origins (bottom left of Figure 3.1). Here, the trips are all existing ones, but there is almost bound to be some induced traffic as the highway network improves. By the same token, if the network was not improved and congestion spread, one would expect some suppression of traffic. There need not necessarily be any suppression of trips, but destinations would tend to be closer, with more use of public transport and/or more car sharing, as the perceived generalised cost of the trips increased. Beyond that, as congestion worsened, actual suppression of trips could occur as some people opted out and chose not to travel at all.
- 3.35 In the long run, with less constraint on origins and destinations, the truly variable trip matrix prevails (bottom right of Figure 3.1). In this situation, the definitions of induced trips and induced traffic are more complex, not least because, with both origins and destinations having changed, the meaning of existing trips (and hence existing traffic) is less clear. The best way to approach this is to distinguish, for the purposes of our definition, the traffic that is related to existing development (that is, that which pre-dates
the completion of the new road scheme) from that related to new development (which has come about after the road scheme). In principle, the first of these is no different from the semi-variable trip matrix case, where only the destination or the origin has changed as a result of the improvement in accessibility. When both have changed, of course, it is harder in practice to identify what were the original trips; but the induced traffic would still only be the extra vehicle-kms arising from the greater trip distances. Although difficult to predict, this can be estimated by monitoring the changes in trip distances over time for different journey purposes. Alternatively, a more general elasticity measure could be applied, where values of elasticity would tend to increase over time, as constraints on choices of origin and destination lessened.
3.36 The second case, that of new development occurring after the road scheme, requires a distinction to be made between that development which had been induced to locate there as a consequence of the road scheme and that which would have occurred anyway, regardless of the change in accessibility. Again, in practice, this is very difficult to determine. In principle and for the purposes of our definitions, it is clear. If the development has indeed been induced by the road scheme, then the traffic generated by that development will be induced traffic. To the extent that this development has transferred in whole or in part from somewhere else, then a corresponding reduction of traffic will have occurred in those other places. Arguably, if this transfer of land-use has taken place within the same locality or jurisdiction, then some allowance should be made for the offsetting reduction of existing traffic in the previous location. The induced traffic is, once again, that arising from the extra trip distances (and other changes) associated with the new location. On the other hand, if the development subsequent to the opening of the new road has located there for reasons other than the improved accessibility, then it should be viewed as part of the general context of economic growth. Accordingly, the traffic associated with that development can be regarded as exogenous to the road scheme and accounted for satisfactorily within national or regional growth factors. We discuss the difficulties of achieving reliable land-use projections in Chapter 12.
REFERENCES
Department of Transport. COBA 9 Manual. Revisions up to 15 November 1993. Highways Economics and Traffic Appraisal Division.
Department of Transport (1989). National Road Traffic Forecasts (Great Britain) 1989. HMSO.
PART II
THE EVIDENCE OF INDUCED TRAFFIC
Chapters 4 and 5
In this P.art~ we look at the evidence for induced traffic which is relevant to our inquiry. In Chapter 4, from general observations of traffic going back to the 1930s, expressions of academic and professional opinion, attitude surveys of drivers, and the economic evidence and theory inherent in road scheme appraisal, we conclude that induced traffic exists as a real phenomenon. This conclusi'on is reinforced in Chapter 5 by our interpretation of a large number of 'before' and 'after' studies of particular road schemes.
CHAPTER 4: GENERAL EVIDENCE ON WHETHER ROAD CAPACITY INFLUENCES THE AMOUNT OF TRAFFIC
INTRODUCTION: LIMITS TO THE POSSIBILITY OF PROOF
- 4.01 At an early stage of our discussions, it became clear that the Committee was confronted by a difference in the arguments advanced by the Department of Transport and by a number of those submitting evidence on the first question we have posed: is induced traffic a real phenomenon?
- 4.02 The Department's view was that little or no convincing evidence had been provided on the mechanisms by which 'roads generate traffic' (or, more strictly, that additional road capacity can induce extra traffic) and that, until such evidence was available, it would be better to continue with the current practice of treating economic growth as the primary source of any additional traffic. A number of other witnesses (including several whose work had been commissioned by the Department itself) took the view that the current practices were less and less in line with professional opinion or consistent with such evidence as was available from traffic counts and models.
- 4.03 Before assessing the quality of the evidence itself, we must accept at the outset that firm, definite proof that would be acceptable to everybody may not ever be possible. Mr P Bonsall provided evidence, based on work carried out for the Department of Transport by the Institute for Transport Studies at the University of Leeds, on the sort of research that would be necessary to establish the nature and size of responses to changes in capacity. Five research difficulties were identified:
- the detection of a statistically significant change due to one specific factor against a background in which there can be substantial (but unknown) day-today variations in traffic levels and significant measurement errors;
- the attribution of cause and effect, given that transport infrastructure improvements often are associated with other measures at the same time and that infrastructure changes may provide a necessary, but insufficient, condition for causing traveller responses;
- the different timescales of different responses (for example, route changes may happen swiftly but changes to the pattern of origins and destinations are likely to take longer to come into effect), coupled with the problem that other extraneous changes may intervene before the adaptations are complete;
- the definition of suitable control sites which are independent and representative; and
- the very large sample sizes and expense that would be necessary to obtain conventional levels of statistical significance in distinguishing between changes in trip frequency and changes in origins and/or destinations.
- 4.04 In assessing road schemes, the central idea is to compare the traffic flows and speeds that would obtain without the scheme and with it. This is done by application of some form of model which, keeping all other assumptions constant, looks at the difference
between flows on the two different networks. "'ie are forced to accept that 'keeping all the other assumptions constant' is unreal and is never going to be possible in the real world. The closest we can observe is to compare 'before-without' and 'after-with' (but something else will always have changed), or to compare traffic growth over time in two different places (which will inevitably have some other non-comparable features).
4.05 An additional complication is that we cannot necessarily assume that evidence drawn from different sources is capable of giving the same results. This is shown clearly in a review carried out by Halcrow Fox and Associates, together with Accent Marketing Research and the University of Leeds (1993) for the Department of Transport. The report is a review of reviews into the effect of prices on car traffic, thereby directly or indirectly covering over 150 pieces of research. One particularly important conclusion related to evidence drawn from the published literature of empirical work, compared with evidence drawn from three transport models, on the sensitivity of traffic to price:
"In general, literature values are 50% to 200% higher than the model elasticities. ".
4.06 The authors of this report suggest the following reasons for this observation:
"Model elasticities are likely to be lower than observed values because the models themselves do not allow for all the many causes of variation that exist in reality. They are generally obtained from varying particular independent variables (fuel price, tolls, fares) and seldom take account of the full range ofinteractions over time in a complex transportation system. These additional interactions are likely to include the time of travel, car ownership levels, driving behaviour, trip rates (for example, increase in multiple trip making) and locational effects.
Hence, values derived from models most likely do not reflect the full chain of cause and effect responses to a change in the cost of travel. Values obtained by empirical observation are more likely to reflect those broad system effects, within a specified timescale. Therefore a case exists, on the basis of the work reviewed, for treating the model elasticities as minimum values. ".
- 4.07 This conclusion, that the model forecasts did not seem to reflect the full range of behavioural response and, therefore, underestimated the extent to which changes in travel conditions might influence the volume of traffic, is directly comparable to our own consideration of trunk road effects. The conclusion is especially apposite to our Report because the models under consideration by the Halcrow Fox team had been developed to apply to London and, therefore (by comparison with the Department's interurban models), already covered some wider behavioural reactions, including mode and destination choice.
- 4.08 For these reasons, the Committee is confirmed in its view that to require unchallengeable proof of both the existence and size of induced traffic before modifying existing procedures is not in the best interests of unbiased appraisal. Therefore, whether or not to allow for induced traffic has to be determined on the basis of the balance of
evidence for and against, rather than on the principle that the current procedures should stay until there is conclusive proof of both the existence and the size of the phenomenon. It follows that we want to look at the broadest range of evidence that might be made available.
4.09 We conclude that, for both statistical and conceptual reasons, it is inherently difficult to prove definitively that the phenomena of induced and suppressed traffic exist and certainly not simply by analysing traffic counts and surveys. Therefore, it is necessary to refer to a wide range of direct and indirect evidence and come to a view about the balance of likelihood of the existence and scale of the phenomena.
THE COMMON SENSE ARGUMENT AND OBSERVATIONS OF TRAFFIC GROWTH
- 4.10 Prior to the development of COBA, there had been a long tradition, based on rather informal argument, that the provision of road capacity had an effect on traffic levels. Evidence submitted to us by the Council for the Protection of Rural England drew attention to a statement by Leslie Burgin, Minister of Transport in 1938, in which he said that:
- the experience of my Department is that the construction of a new road tends to result in a great increase in traffic, not only on the new road but also on the old one which it was built to supersede. ".
- 4.11 This observation was based on a number of empirical studies, of which an influential example was that given by Sir Charles Bressey CB and Sir Edwin Lutyens KCIE RA (1938):
HAs a typical instance may be quoted the Great West Road which parallels and relieves the old Brentford High Street route. According to the Ministry's traffic census, extracts from which are given below, the new route, as soon as it opened, carried 4~ times more vehicles than the old route was carrying; no diminution, however, occurred in the flow of traffic on the old route, and from that day to this, the number of vehicles on both routes has steadily increased:-
| | Number of
a day of
Vehicles for
16
hours | | |
|------|------------------------------------------------------|---------------------|--|
| Year | Old Route | New Great West Road | |
| 1922 | 1,404 | Not
open | |
| 1925 | 1,435 | 6,440 | |
| 1928 | 1,887 | 9,404 | |
| 1931 | 2,238 | 12,610 | |
| 1935 | 3,826 | 16,903 | |
These figures serve to exemplify the remarkable manner in which new roads create new traffic. ".
- 4.12 Methodologically, this study is interesting in that it is based on counts on both the new and relieved roads, a question to which we return in Chapter 5.
- 4.13 This issue arose again in the post-war years and important work was done in the 1950s by the then Road Research Laboratory. The most influential study was reported in 1958 by two senior scientists, Glanville and Smeed. Their work depended on a comparison of the slower rates of traffic growth on roads that were already congested, compared with the faster rates on roads which were less congested. They concluded:
"the absence of adequate roads is likely to affect to some extent the amount of traffic. ".
4.14 A number of other submissions to the Committee made similar or related points. Figure 4.1 is based on information submitted to us by the Institution of Highways and Transportation, showing that the classes of roads with the greatest traffic growth are closely associated with those that have experienced the greatest increase in capacity.
Figure 4.1: Comparisons of Traffic Growth and Increase in Road Space, Great Britain, 1980-90
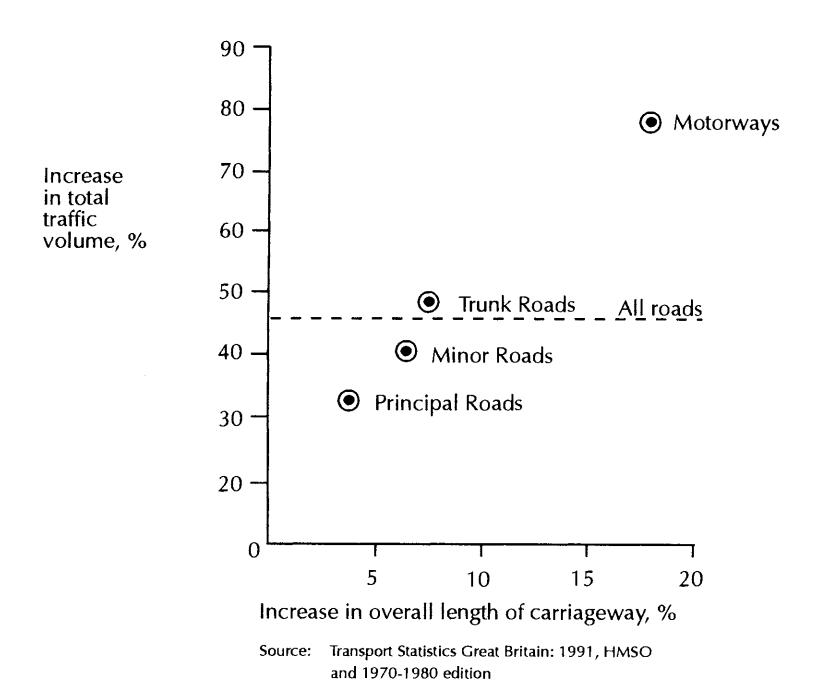
- 4.15 The growth of traffic on motorways is consistent with what one would expect if part of the traffic were induced, either by the production of additional trips, or (as we discuss below) by a reinvestment of travel time savings in longer trip distances. A complementary explanation could be that the generally poor conditions of the road before improvement suppressed a certain proportion of traffic, which was subsequently released.
- 4.16 Similarly, Dr M Mogridge provided us with data for London, suggesting that the phenomenon noted by Glanville and Smeed in 1958 continues to apply. Growth in traffic at the Outer London boundary cordon still approximately keeps pace with the average increase in car ownership, at 2.3% per year. However, on his reported figures, the growth rate at the Inner London cordon was 0.8% a year and in Central London was 0.4% a year. He attributes these differences, at least in part, to the traffic suppression effects of congestion in Inner London.
- 4.17 This differential occurs not only in space but also in time. Thus, the Greater Manchester Transportation Unit reports that off-peak traffic has grown faster than peak traffic, in a systematic way consistent with the proposition that:
"peak spreading ... is caused by increasing levels of congestion which persuade road users to attempt to reduce their journey time by altering the start time of the trip. ".
- 4.18 Of itself, observation that traffic has grown more where there is spare capacity for it to do so does not prove that the provision of capacity per se has caused the growth. It can always be argued that the differential growth is due to other social factors which governments, in their wisdom, have accurately foreseen, enabling them to provide extra capacity in just the right places at just the right time. To some extent, this argument must be valid.
- 4.19 However, the common sense point remains. From the late 1950s to 1990, the amount of traffic on trunk roads increased overall by a factor of eight. During this period, about 3,000 km of motorways were constructed. It is manifest that current trunk road traffic flows could not have been fitted onto the 1950 road network. If we had not built those roads it would simply beggar belief to argue that we would have the same amount of freight and passenger traffic between London, Bristol, Swansea, Dover, Manchester, Liverpool, Newcastle and Glasgow as we do now.
- 4.20 We can say with complete confidence that something else would have happened -but we do not know what. We can speculate on a number of alternatives. There might have been economic stagnation, even ruination; or different patterns of production, depot, shop, home and job locations; or a comprehensively different role for rail; or different sized vehicles; or radically different patterns of journey time choice; or various combinations of some or indeed all of these. All we know for certain is that the same trips, with the same origin-destination pattern, at the same times, would not have happened.
- 4.21 A number of witnesses pointed out the logical flaws of assuming otherwise. Mr D Starkie of Putnam, Hayes and Bartlett pointed out that if no allowance is made for the
suppression of traffic by congestion, application of ordinary forecast growth rates in some circumstances leads to predictions of absurdly long queues which everybody knows do not happen. In these circumstances, it is normal to assume that some degree of suppression will occur. If, then, an increase in capacity is provided, it is equally logical to assume that the previously suppressed traffic will appear - which, according to the definitions we have proposed, is equivalent to induced traffic. The Institution of Highways and Transportation took the point to its logical extreme by suggesting that "if there were no road space, then there will be no road users". Marcial Echenique and Partners used the equally extreme logical example that "it is hard to believe that there could be any opponents to . .. the proposition that the construction of a 5-second link to Melbourne would result in an increase in the amount of traffic to Australia" (though it would be intriguing to speculate about the price at which this service would be offered).
4.22 We conclude that the idea that the provision of road capacity influences the amount of traffic is not new. On occasion in the past it has been the view of the Department of Transport and its advisors. A recurrent form of evidence cited has been that, over a long period, traffic growth rates have been slowest where congestion is worst. The fastest growth rates have been where existing capacity is still spare, or new capacity is provided: from 1980 to 1990 measured traffic on major roads in built-up areas grew by 20%, on major roads in non-built-up areas by 58%, and on motorways by 73%. Similarly, in the congested areas, there is faster growth on the shoulders of the peak and off-peak than in the peak period. This differential growth is consistent with, but does not prove, the proposition that additional capacity on specific roads influences traffic growth. However, when considering the network as a whole, it is difficult to come to any other view: the 1950 road network simply would not have supported current traffic levels.
EVIDENCE ON PROFESSIONAL CONFIDENCE IN THE CURRENT ASSUMPTIONS
- 4.23 From the flavour of the evidence submitted to us, it is clear that a large body of transport professionals feel uncomfortable with the assumptions underlying the current methods of the Department of Transport. Apart from the balance of the submissions themselves, we note in particular comments we received from six senior Inspectors, based on their experience of road inquiries. The following quotations reflect some of their own judgments on the acceptability of current procedures:
- ". .. in my experience public opinion has little faith in such forecasts. "
[types of schemes most affected by induced traffic] " ... new trunk roads and motorways. Bypasses to larger towns. "
- ". .. to attempt to quantify at a public inquiry any of these effects could only lead to inconclusive argument which could lower confidence in the main traffic forecasts. "
". .. a bypass of a large town in the region of 5 to 8 miles will almost certainly induce traffic redistribution and probably generation as well. "
a new scheme undoubtedly induces traffic redistribution. I believe that the assumption that it does not is invalid. "
". .. the fixed matrix assumption is not valid but it is generally accepted while it remains impossible to forecast induced effects. ".
4.24 The Institute for Transport Studies at the University of Leeds carried out, in 1989, a survey of various professionals involved in transport studies and road appraisals, concerning what they thought the balance of evidence on these matters was. The results were a "wide measure of agreement" that:
- large changes in accessibility will influence land-use and development;
- effects will be scheme-specific;
- impacts will be greatest where there has previously been trip suppression;
- particularly in urban areas, the impact of a capacity increase may only be apparent, at the aggregate scale, at some considerable distance from the scheme;
- reassignment is likely to be the largest single response on new-build schemes and to a lesser extent on improvement schemes, but other responses could add up to an appreciable proportion of the total effect;
- effects other than reassignment and exogenous growth are likely to produce an especially significant proportion of the traffic on urban schemes; and
- change in time of travel is likely to be a very important response in previously congested areas.
4.25 We conclude that the assumption, that demand responses other than changes of choice of route are negligible, does not command a strong professional consensus at present. Rightly or wrongly, there is a substantial body of professional opinion believing that induced traffic can be an important consequence of certain types of highway improvement.
ATTITUDE SURVEYS OF DRIVERS
4.26 We now turn to what vehicle users themselves report about their responses. A recent review by the University of Oxford, the University of Leeds and John Bates Services (Goodwin et al 1992) for the Department of Transport, of evidence from in-depth interviews with small samples of drivers and national or local opinion polls of larger numbers, indicated that drivers themselves report a wide range of different responses to increasing levels of congestion. These included:
- altering the number of discretionary trips;
- mode shifts (walk, and public transport);
- change of route (especially including rat-running);
change of driving style (aggression, speed, etc);
change of location of home, workplace, shopping etc;
adoption of different psychological attitudes (conscious relaxation etc);
altering the choice of parking location; and
alteration of activity sequences.
4.27 Table 4.1 shows reasonably typical results from larger scale surveys of drivers asking what they would do in response to changes in the amount of congestion. This one was carried out by Lex Motoring Services in 1992. It is of interest to compare the range of responses with that found by the Transport and Road Research Laboratory in a literature review of the effects of changing levels of congestion (Hawthorne and Paulley 1991). Reference was found to choice of route, departure time including flexitime, mode shifts including ridesharing and public transport, trip frequency, complex intrahousehold adjustments in travel and activity patterns, and changes in the willingness to own cars.
Table 4.1: Driver Responses to Changes in Congestion
| A: "If
there
was
a
lot
more
congestion
in
the
area
where
you
live,
which,
if
any,
of
these
do
you
think
you
would
do?" | | | |
|---------------------------------------------------------------------------------------------------------------------------------------------------------------------------------------------|-------|--|--|
| of
Change
times
journeys | 41 % | | |
| Drive
less | 190/0 | | |
| Use
public
transport
more | 140/0 | | |
| Use
car
less
for
leisure/visiting
friends | 80/0 | | |
| Use
car
less
going
to/from
work | 7% | | |
| Move
home | 4% | | |
| Use
car
less
in
connection
with
work | 20/0 | | |
| Increase
number
of
cars
in
household | 0% | | |
| No
response/no
opinion | 250/0 | | |
| "If B: there was no congestion in the area where you live, which, you would do?" |
if any, of these do you think |
|---|---|
| of Change times journeys |
60/0 |
| Drive more |
210/0 |
| Use public transport less |
20/0 |
| Use car more for leisure/visiting friends |
150/0 |
| Use car more going to/from work |
5% |
| Move home |
0% |
| Use car more in connection with work |
2% |
| of Reduce number cars in household |
0% |
| No response/no opinion |
57% |
4.28 In summary, when drivers are asked to speculate on how they might adapt 10 changing levels of congestion, they mention a wide range of responses including changes in the amount of travel. From this, we conclude that traffic suppression and trip suppression may both be consequences of increased congestion on the road network, and that induced or released traffic may result from road improvements that reduce congestion.
EVIDENCE ON OTHER INFLUENCES ON THE AMOUNT OF TRAFFIC
4.29 There is a substantial body of research on other factors affecting traffic levels, on which we have found it helpful to draw. Although this research does not deal directly with the effects of road capacity on traffic demand, nevertheless, the research is logically connected to those results and therefore enables either indirect estimates of induced traffic to be derived or other results to be checked for consistency. For example, if there is an effect of the money costs of travel on the volume of traffic, then there are wellestablished procedures for converting these money costs into the amounts of time which would have the same effect on behaviour. Similarly, if changes in public transport travelling conditions influence the balance of travel between public transport and private transport, then this indicates that the relative attractiveness of the two modes is important, and that there is a link with similar relative changes that would be brought about by changes in travel time. In this section, we first consider such evidence separately, and we proceed then to put the results together to make a direct estimate, logically implied by the other results, of the effects on traffic levels of changes in travel time.
Effects of Fuel Price on Traffic Levels
4.30 It is well established that out-of-pocket money costs of travel have some effect on the amount of traffic. A recent literature review by Goodwin (1992) cited 13 studies in which the effect of fuel price on fuel consumption had been calculated (with a shortterm elasticity of around - 0.25 to - 0.3 and a long-term elasticity of - 0.7 to - 0.8); 11 studies in which the effect of fuel price on traffic-levels had been calculated (with results of - 0.16 for a short-term effect and about - 0.3 for a long-term effect, and other studies not specifying the time period showing results of about - 0.5). Qum et al (1992) report seven studies of automobile usage with respect to fuel price, giving elasticities in the range - 0.09 to - 0.52. Goodwin and Dargay (1993) report elasticities of traffic levels with respect to total running costs, in the short run, of - 0.5, which includes an effect on car ownership, and much larger long-run elasticities whose validity the authors doubt. Halcrow Fox et al (1993) assess a short-term price elasticity for car use in the London region of - 0.16 and a long-term value of - 0.31 as 'likely values' from a literature review. They also found a range of values for different journey purposes of - 0.05 to - 0.87 from a stated preference experiment.
- 4.31 In the 1989 National Road Traffic Forecasts, the Department of Transport judged that the evidence available to that date was consistent with a national elasticity of - 0.15, and this was used to assess the effects of assumed fuel price scenarios on national traffic levels. More recent work by the Department of Transport (Virley 1993) gives a shortrun effect of fuel prices on fuel consumption of - 0.09, and a long-run effect of - 0.46.
- 4.32 Taking these results as a whole, we can say with some confidence that, at the aggregate level, there is some effect of the money costs of car travel on the volume of traffic, with an elasticity somewhere in the range - 0.1 to - 0.5.
- 4.33 Other studies referred to in the same reviews indicate that the effects of fuel price on fuel consumption is greater than the effects on traffic levels. The usual explanation offered for this is that people have a range of behavioural responses to price increases which enable them (to some extent) to preserve mobility while conserving fuel. These responses include variations in driving style, alterations in the size and power of vehicles and changes in the amounts of travel carried out in more and less fuel-intensive conditions.
Effects of Public Transport Service Levels on Car Ownership and Use
- 4.34 Jones and Tanner (1979) reviewed 11 studies which enabled the impacts of public transport service levels to be identified. From these studies, they deduced that an increase of 1 bus kilometre run per person per year was associated with an average reduction of 0.0021 cars owned per person, and that an increase of 10 public transport trips per person per year was associated with a decrease of 0.0077 cars per person. After taking into account effects of other factors such as household income and population density, it was suggested that "extreme levels of public transport provision" appear to cause car ownership to vary over a range of about 0.05 cars per person, which was about one third of the observed range of variation in car ownership of 0.16 cars per person.
- 4.35 From this, Jones and Tanner concluded:
"It is quite clear that when car ownership is high for external reasons such as a high level of income, public transport use is low ... Similarly there can be no doubt that when public transport provision is good for external reasons, then car ownership, particularly second car ownership, tends to be 10)1). ".
4.36 This view was not out of line with those of other researchers who had studied the same problem. Earlier, Fairhurst (1975) had found that a measure of public transport access gave (with income, household size and residential density) statistically satisfactory explanations of variations in car ownership among districts in London. Bates and Roberts (1979, 1981), in particular, found that the probability of households owning cars was nearly 50% higher in areas with very poor bus services than in areas with very good bus services. Of course, not all this could be attributed to the buses, but there was a range of about 5 percentage points in car ownership connected with the difference between medium and good urban bus services. They suggested an elasticity of about - 0.1 of car ownership with respect to bus services (that is, a 100/0 increase in bus services would lead to a 1% fall in car ownership). From this, they concluded:
"there is compelling evidence that both density and bus frequency influence car ownership" (1979), and
"there can now be no doubt that the level of car ownership is linked to the supply ofpublic transport services. " (1981).
4.37 Some measure of this is provided by Goodwin (1993) from a review of 13 studies:
"The elasticity of car ownership with respect to public transport generalised costs is not likely to be less than +0.1, or more than about +0.3. ".
4.38 The same study indicated that both car ownership and car use in South Yorkshire appeared to have been influenced by substantial changes in public transport policy in the period 1974-1991. While the general trend of growth in car ownership, due mainly to increasing incomes, continued throughout, the rate of growth (especially for second cars) was markedly different during periods of more and less attractive bus provision.
Growth in Motorway Traffic
4.39 Evidence was submitted to us of a study commissioned by the Department of Transport and carried out by Williams and Lawlor (1992) of Marcial Echenique and Partners. This used statistical procedures to analyse the relative strength of different factors behind the growth in motorway traffic over the period 1978-1988. After trying various different models, the favoured results suggested that six important factors were at work, namely national gross domestic product (GDP), regional GDP, petrol prices, weather conditions, a general average annual growth and - most interestingly for our purposes - the length of motorway network provided. This factor was statistically significant for cars and light goods vehicles. Taking all motor vehicles together, a 10% increase in motorway length would lead to about a 1% increase in motorway traffic. The study did not apply similar methods to the effects on non-motorway traffic, though it did find that in those roads petrol prices were a significant influence on traffic levels.
.Travel Time Budgets
4.40 There has been a long tradition of empirical studies of the amount of time people spend travelling. When all travel by all modes is added together, many researchers have found that the resulting 'travel time budget' is on average rather similar for people living in different countries, or in areas of very different characteristics and travel opportunities. Gunn (1981) noted that:
"Early work on travel budgets established interesting similarities in the average travel budgets of residents in different locations: the three most important results were probably (a) Tanner's demonstration of stable generalised expenditure as between urban and rural dwellers, (b) Zahavi's evidence for 'stable' average travel times (by motorised modes) for different cities at different times, and (c) Goodwin's analysis ofNTS data, which showed that average total travel times were not affected by residential density. ".
- 4.41 Less well quantified work has suggested that the average amount of time spent on journeys to work has remained rather stable for some six centuries. As faster methods of transport have been used, catchment areas have widened and trip distances have increased.
- 4.42 Research was carried out on this topic at TRRL in the late 1970s and early 1980s. One study, by Downes and Emmerson (1983) carried out cross-section analyses of surveys from 12 English towns and a five-year longitudinal study of one of those towns, Reading. The authors concluded that:
"Taken together, the study results suggest that faster travel speeds generally encourage more travel to be made but the effect on daily travel time appears to be different according to whether internal travel time or total travel time (ie including travel to external locations) is considered. Internal travellers spend only part of the potential time saving on extra travel (and save the rest) ... when external travel is included in their daily travel time travellers spend all of the potential time saving from higher travel speeds (and more, for most ofthe towns examined) on further travel to reach the wider range of opportunities offered by nearby towns which, with the increase in speed, become sufficiently attractive to warrant extra travel. ".
4.43 Examination of the conclusions of 13 authors in the field in a special issue of the journal Transportation Research, January 1981, does not show strong support for the idea that travel time budgets are absolutely stable (which would imply that all travel time savings were ploughed back into more travel). But all the evidence was consistent with the weaker proposition that some of the time saved would be re-used in this way. This extra travel should certainly be treated as induced traffic, which might be manifest as either longer distances or extra trips but only a proportion of it would appear on or close to the improved road itself. The idea of a travel time budget also provides that savings in time for one journey then become available for other travel entirely.
Value of Travel Time Savings
4.44 The Department of Transport has sponsored many research projects in this area over the years. The current procedures are based on a study carried out by The MVA Consultancy together with the transport groups at the Universities of Leeds and Oxford (1987). This study found values of in-vehicle time (at mid-1985 prices) of 3.5 to 5.0 pence per minute for an average car user. At 1993 prices, this is equivalent to a representative value of time for car users will be about 6 pence per minute. (It is conventional to treat these values as being per person, although the research itself found some difficulties of interpreting the difference between per-person and per-car estimates.)
Evidence on Freight Operations
- 4.45 The Committee received some submissions specifically related to freight operations, notably from the Freight Transport Association (FTA) and also reports of research studies carried out by the University of Westminster.
- 4.46 Much of the evidence from the FTA related to the economic importance of providing adequate road conditions for lorry operations, especially in a period where it seemed as though traffic demand was certain to increase more than road capacity. The Committee took this point, though it was not strictly within our terms of reference. However, we were particularly struck by two suggestions in their evidence. First, they reported that aFTA rejects the argument that building new roads simply generates more traffic" and supported this conclusion by reference especially to research carried out on the effects of the Rochester Way Relief Road. (This proved to be an important study for the Committee, and we examine it in more detail in Chapter 5.) Secondly, they provided a number of very instructive examples of the way in which industry is able to make use of the benefits of improved road conditions: these included changes in the location of factories and warehouses so as to take advantage of improved travel times, introduction of new services - for example, next-day parcel services using new motorways - and expansion of intercity bus services due to the reduction in motorway journey times.
- 4.47 Some similar results appeared in the results of a survey of UK hauliers carried out by the University of Westminster. Although the sample size was rather small (a 130/0 response out of 1500 surveyed), nearly 40% of the respondents reported that the M25 allowed them to make longer trips than they had done previously. There were also indications of the start of longer-term processes of relocation, with 5% of respondents reporting that the M25 had influenced site location.
Other Evidence on the Interactions Between Transport and Land Use
4.48 Some of the strands of evidence discussed above have already referred to land-use effects but, in addition, we received a number of submissions directly concerned with the question of development. Those presenting evidence were asked to consider such matters as:
- do new roads stimulate development?
- what kind of development is stimulated?
- can such stimulation of development be evidenced in planning applications?
- do new roads stimulate change in the use or management of land?
are there examples worthy of further study?
4.49 While there was a significant body of opinion which suggested that the scope for reducing trip generation through appropriate land-use planning was rather limited, others thought that it could have a much greater role in reducing traffic levels. We note that, with the recent publication of Planning Policy Guidance Note 13, the Departments of the Environment and Transport now seem inclined to take the latter view.
4.50 Transportation models take land-use as a fixed input. Whilst this is unrealistic, to change matters would involve great complexity. We found it of interest that few of those presenting evidence to us appeared to be concerned with the need to identify what was implied by the term 'land-use' and to make a distinction between that term and responses of a more behavioural character.
4.51 In summary, the principal thrusts of the evidence on these matters presented to us was as follows. Land-use change, it was suggested, does occur in relation to new road provision. The interactive relationship between the two factors is, however, poorly understood and few helpful data are available in this regard. Especially on greenfield sites, new road provision confers enhanced land value (especially at junctions) and incites development interest. Density is significant - lower densities lead to a higher car usage and militate against the efficiency and thus the provision of public transport systems. There is a strong case for the closer integration of land-use and transport planning at policy level and at operational level. In this context, it was suggested that development control often focuses upon the short-term, local traffic effects of a development proposal and not upon the longer term or upon the wider network. The alleged effects of new roads upon land-use are not confined to land adjacent to the new road but can be quite widespread.
4.52 A study by Headicar and Bixby (1992) of Oxford Polytechnic, focused on land-use changes connected with new motorways in open countryside, with the M40 as a case study. The work looked at two phases of construction, namely South Buckinghamshire (built 20 years ago) with special reference to changes around Cressex, near High Wycombe, and also the more recently opened North Oxfordshire section.
4.53 The suggestion is that there was very substantial traffic generated by the development of new stores, entertainment, residential and hotel development, located for convenience to the motorway and with extensive car parking facilities. The County Engineer reported in 1986: "Traffic flows through the junction have increased disproportionately on account of the M25 and the effects of major shopping, residential and hotel development at Cressex. ".
4.54 Of particular importance were the following conclusions:
- development took place on land not previously developed, and outside the provisions of the then approved development plan;
- the nature and intensity of development were radically different from previous development in the vicinity; and
traffic generated by the developments caused added problems of congestion on neighbouring roads, and prompted suggestions for further road improvements in the area.
4.55 However, these effects were not uniform. The authors noted that, at intersections where there were other constraints (for example, Designated Area status, Green Belt or Area of Outstanding Natural Beauty), then development pressures were resisted, although with consequently greater pressure on sites without these constraints.
4.56 The line of the northern section of the M40 was known some 15 years in advance, and there were Structure and Local Plans which took account of the future presence of the Motorway. The authors suggest that the presence of Birmingham at the northern end will have an increasing impact on development proposals. We are not aware of any challenge to the interpretation of this study. It seems to be generally agreed (and, indeed, now part of Government policy) both that roads can have important development effects and that land-use policy and patterns can have a significant role in influencing the total amount of traffic and hence pollution.
Development Effects
- 4.57 Supporting evidence on the effect of new roads on economic development was submitted by a number of other agencies. One of the stated intentions of infrastructure improvement is to stimulate economic efficiency and hence growth. If it is successful in doing so, then there may be further effects of extra traffic, associated with that growth, which are therefore attributable in part to the infrastructure. The London Boroughs Association submitted a review of the evidence on this by Hurdle, making use of previous reviews by Parkinson, Grieco, Cervero and others. The result of such studies quoted most frequently is to support Parkinson's contention that transport costs are only about 50/0 to 100/0 of total production costs, so a marginal change to this small proportion is not likely to have much effect. Surveys of firms are quoted suggesting that transport costs are usually cited as being fairly low in any scale of important factors, behind relocation.
- 4.58 The mood of researchers in this field is to suggest that transport investment has little detectable effect on the overall level of economic activity; if this is the case, then there would also be little contribution to induced traffic overall from that particular effect.
- 4.59 However, there is wider agreement that transport investment could effect the location (as distinct from the overall volume) of economic activity, and this can have an effect on both the location and the overall volume of traffic. A number of consultants submitted evidence to the Committee on this point. Mr W Wiley, of Kennedy Henderson, submitted evidence related to the growth of traffic in Bristol. It was suggested that, over a ten-year period, some 300/0 of traffic growth could have been due to increased average trip length, rather than increased numbers of trips. The patterns found were consistent with land-use changes in household location, increased retail and other activity at the edge of town, and redistribution of business activities. Mr C Wood, of TEST, submitted evidence suggesting that differing land-use policies in Britain and Germany were associated with a greater spread of traffic and out-of-town shopping centres in Britain. Ecotec reported work for the Departments of Environment and
Transport which led them to conclude: "The evidence from major development corridors such as the M4 is that development interest often spreads out from major centres, particularly London, along major radial routes as both firms and people move outwards...the development of the motorway system has provided a powerful stimulus to the observed decentralisation of population to Counties outside the inner South East." .
- 4.60 The Department of the Environment submitted a study undertaken on its behalf which, it considered, was a basis to suggest that road and, in some cases, commuter rail schemes, can significantly influence the effect of development pressures in one of two circumstances:
- first and most importantly, where they remove barriers for movement between an area where land prices are relatively high and the market is buoyant (but development is constrained) and another where land prices are lower and more development opportunities exist;
- secondly, where they significantly change the relative accessibility of different parts of an urban area.
- 4.61 The Scottish Office Industry Department approach the matter of induced traffic from a rather different basis than is the case in England - one of the explicit objectives of the Secretary of State for Scotland is to promote economic development. This feeds through into the way schemes are assessed and the way in which land-use developments are forecast in relation to trip forecasts. There is, therefore, concern to obtain the widest possible economic benefits from any scheme and not simply to regard the COBAINESA focus on time savings as the indicator of such benefit. There are also some doubts and concerns about such current methods in this context - some such were indicated to us which had been highlighted in work undertaken by the Scottish Office's consultants and included the value of small time savings (and whether these can be used productively or not) and doubt surrounding the treatment of vehicle operating cost calculations. Specifically, the latter issue is with respect to the accurate measurement of the benefits of reduced freight journey times which are not covered by personal time savings. Current methods ignore the value of the load, implying that the benefits of the reduced freight journey time of a full, high-value load is equal to those for an empty vehicle.
- 4.62 In the wider relationship between transport and economic development in Scotland, the incidence of induced traffic can be a signal of the efficiency of economic development policies and be regarded favourably. This is in contrast to the way in which it might be regarded in the conurbations of central and southern England. (In scheme preparation in Scotland, relevant local authority objectives are incorporated into the scheme objectives.) The Scottish Office is currently examining this wider relationship more closely on the grounds that a study undertaken by British and American consultants for them has indicated there are substantial economic benefits associated with transport infrastructure which are not currently being captured in the traditional cost/benefit analysis being used (Oscar Faber TPA and Cambridge Systematics 1993).
- 4.63 Thus, the submissions by academics and industry lend support to the idea that businesses are able to make use of journey time improvements, and that these can
influence depot location, length of haul and commercial success. Each of these factors tends to imply that there would be some effect of new capacity on the volume of freight traffic.
Conclusion
4.64 We conclude that the preceding results of published research demonstrate the following irpportant findings, to a reasonable level of confidence: (a) there is an effect of fuel prices on traffic levels, and a larger effect on fuel consumption; (b) the quality and/or price of public transport can have a small effect on car ownership or use, or perhaps both; (c) the length of the motorway network is one of the influences on the amount of traffic using it; (d) some but not all of the time saved on travel when journey speed increases is likely to be used for additional travel; (e) car users do in fact trade-off time and money to an extent, and a measure of this trade-off is given by the empirical estimation of the value of time savings; (0 journey times can have an influence on depot location and length of haul of freight operations; (g) the land-use changes consequent on improved access are likely, in turn, to lea'd to changes in the patterns of travel, car dependence, and the volume of traffic.
IMPLICATIONS OF THE RESEARCH FINDINGS
- 4.65 There is a logical connection among the above results, which has a direct bearing on the question of induced traffic. The Department's National Road Traffic Forecasts accept that the total quantity of traffic is influenced to some extent by the general level of fuel price and the principles underlying COBA propose that vehicle users treat the money cost and the time cost of travel as being substitutable (at a rate called the 'value of time').
- 4.66 S~nce there is a substantial body of research, both on the size of the influence of fuel prices and on the value of time, it is possible to put these two sets of results together, using the following argument.
- 4.67 If we know what effect increases in fuel price would have on traffic levels and, if we know the equivalent values to vehicle users of changes in fuel price and changes in travel time, then we can calculate what effect travel time changes would have on traffic levels. An example of this is shown in Figure 4.2, which is based on those values for the effect of fuel price on traffic levels and the money value of travel time which have been accepted by the Department of Transport in recent years.
Figure 4.2: General Relationship between Speed and Traffic Demand
- 4.68 In the example, a speed change saving 100/0 of journey time would cause a 4.50/0 increase in traffic volume. The values that have been used in this example are broadly representative of those in the published literature, summarised in this chapter. It is reasonable, therefore, to treat the result as relating broadly to average conditions. In practice, we would expect the numbers to vary by journey purpose, area, mode, speed of travel, type of person and many other factors. Thus, there is no universally correct answer. It is important not to exaggerate the degree of precision involved in the calculations, since all the assumptions will be context-dependent and all will be associated with some range of statistical uncertainty.
- 4.69 A particular aspect of importance in considering how sensItIve the result is to the assumptions made is that the - 0.15 fuel cost elasticity is usually treated as a short-term effect (that is, within the first year). There is substantial evidence, cited in paragraph 4.30, that the longer-term effect is significantly greater than this. If we take the estimated longer-term elasticity to be of the order of - 0.3, for example, the implied journey time elasticity for the case in Figure 4.2 would be nearly - 1.0. A 100/0 change in speed would then lead to a longer-term change in traffic volume of nearly 100/0. Similar arguments apply to other assumptions. For example, in congested conditions, where time is a large proportion of the generalised cost of journeys, the implied travel time elasticity will be greater, and in uncongested conditions, smaller.
- 4.70 Thus, in round terms, as an overall average, the approach might suggest a short-term travel time elasticity of about - 0.5, and a longer-term elasticity of the order of - 1.0. These figures can be compared for consistency with other research results. The
interpretation of the results for the short term suggests that about half of the time saved by speed increases would be spent on additional travel. This is consistent with the results of some of the time budget studies referred to above. The interpretation of the results for the longer term suggest that most or all of the time saved would be spent on additional travel. This is equivalent to the hypothesis of a constant time outlay on travel, and is close to the results of the TRRL research cited in paragraph 4.42. Interestingly, these values are also within the range of elasticity values which have been used for sensitivity testing purposes in some of the modelling studies reviewed in Chapter 10.
- 4.71 Thus, we have three strands of evidence which tell similar stories. Two independent quantitative approaches have suggested that a similar, substantial volume of traffic could be induced by speed increases. These are: (a) a simplified calculation of the logical implications of values of elasticity and values of time, based on empirical evidence and as currently accepted by the Department of Transport; and (b) studies of travel time budgets. Both results are consistent qualitatively with other research concerning the effects of improving public transport, development effects, and opinion surveys. Taken together, we consider that the balance of this evidence favours the existence of induced traffic. The scale of this effect is probably such that between half and all the time saved by road improvements might be utilised for further travel. The evidence also supports the common sense expectation that the demand responses to changes in journey speed will evolve over time.
- 4.72 In summary, the observation that fuel prices influence the amount of traffic, together with the established methodology that values of time can be used to convert time savings into a money equivalent, logically requires that travel speed must affect the amount of traffic. Using values accepted by the Department, a simplified calculation suggests that about half the time saved through speed increases might be used for additional travel. We interpret this as a short-term effect. The longer-term effect is likely to be greater, with a higher proportion (perhaps all) of the time saved being used for further travel.
CONCLUSION
4.73 We have considered a wide range of different sources of available evidence intended to illuminate the problem of induced traffic. None of it directly establishes unassailable proof but the balance of evidence is fairly clear. The pattern of research results available is more consistent with the idea that travel conditions do indeed influence the total amount of traffic, than with the idea that traffic levels are unaffected by such changes. This is especially so when considering the strong intuitive and logical arguments drawn from consideration of what could have happened to traffic growth if there had been no substantial road improvements in the last 40 years and from connections between accepted price effects and accepted values of time. We note that some of these arguments imply that any induced traffic that exists may be spread over other roads, not only the improved road itself.
REFERENCES
Bates J J and Roberts M (1979). The Interrelationship of Car Ownership and Public Transport. Proceedings of PTRC Summer Annual Meeting.
CHAPTER 5: EVIDENCE FROM TRAFFIC COUNTS ON IMPROVED ROADS
INTRODUCTION
5.01 Some approaches, such as the time-budget work discussed in Chapter 4, imply that induced traffic may be spread widely over the network as a whole. Subject to this caveat, the most obvious and important evidence on induced traffic is to be sought in studies which have looked at traffic levels on specific parts of the network before and after the provision of increased road capacity. This chapter looks at evidence made available to us from a range of sources. These include the Department of Transport's 1988 review of traffic growth on the M25; the Department's routine monitoring of traffic flows on recently-opened road schemes, and specific studies carried out in different regions of the country. In most cases, these have been submitted to us by those who carried out the work, but also included are two literature reviews, by Dr SPells (1989) of the Institute for Transport Studies, University of Leeds, and by Howard Humphreys and Partners (1993).
REVIEW OF TRAFFIC GROWTH ON THE M25
- 5.02 Construction of the M25 has played a particularly important role in generating renewed public interest in the question of induced traffic, because it rapidly became clear that the amount of traffic using the road on almost every section was much greater than had been predicted. Public comment on this was typified by the Sunday Times (28.8.1988) which, perhaps unfairly, described the M25 as a "Transport Fiasco ", "Obsolete before it opened", and quoted Paul Channon, Secretary of State for Transport, as saying that "motorways have been victims of their own success - precisely because they are so fast and convenient, drivers use them more". There is a strong public perception that the M25 has attracted a great deal of extra traffic, beyond that which could be accounted for merely by changes of routes. The National Audit Office paid attention to this question in 1988, and Figure 5.1 (overleaf) is an updated version of a figure in their report.
- 5.03 The Department of Transport commissioned Consultants to review this experience and has provided us with the results of its own assessment of the Consultants' study. This is based on a detailed examination of·the growth in traffic flows on each section of the M25, which is not reproduced here. The general conclusions, however, are summarised (following closely the language of the Department's report):
- Traffic that uses a new road may be described as falling within the following categories: reassigned, redistributed, modal transfer, development traffic, generated traffic, change in time of travel. (These categories correspond roughly to some but not all of the responses we identified in Chapter 3.) The relative importance of each of these categories on the M25 is unknown.
a
n
lIo1 :!l
=
I
I
I
- The majority of reassignment effects of a new road are typically assumed to occur within the first three to six months following its completion. The M25 was completed by November 1986 and the majority of reassignment effects are therefore assumed to have occurred by early 1987. Traffic speeds in Outer London are continuing to fall. It is possible, therefore, that general increases in traffic levels are disproportionately being attracted to the M25 even after the original reassignment. Where the M25 exhibits peak hour congestion, then at these times and locations traffic may be routeing back to routes originally relieved by the M25.
- The absolute volume of redistributed traffic is unknown and, in general, is a matter of judgment. In the context of the M25, it is noted that the population of London and the South East contains a large number of people who are relatively mobile in where they live and work, massive increases in house prices (this was written in 1988) resulted in a large number of individuals living in outlying towns, the motorway network in the South East exhibits strong peak and tidal traffic flows commonly associated with urban commuter flow patterns, and there is evidence that redistribution can happen very quickly, or even anticipate the opening of a new facility. For these reasons "it may be assumed that redistributed traffic has been an important element in recent trends in traffic growth on the M25".
- The mode transfer of individuals from public transport to road would not obviously appear to be a major feature of the traffic characteristics of the M25 in its function as an interurban route and bypass to London. However, it also has another function, catering for movements between outlying areas of London and the region. Given the radial nature of the rail network, certain of these trips would have been via central London. On completion of the M25, such trips may now be accomplished more easily by car. It follows that it is likely that the M25 has promoted some transfer from rail to road.
- The M25 has promoted significant pressure to develop land within its vicinity, but the majority of such developments has yet to come to fruition. Traffic to and from developments is likely to be of limited importance in explaining recent traffic but, if they come to fruition, development traffic is likely to be an important feature of future trends. (This was written in 1988. We note that the Director of TRL has recently suggested that up to 250/0 of traffic now using the M25 may be associated with development consequent on the road opening to traffic.)
- Some other examples are given of schemes which seem to have generated new leisure trips: for example, outings from Greater Manchester to Blackpool on completion of the M6/M54, or from Avon to Dartmoor on completion of the southern section of the M5. No information or argument is given on the possible importance of this for the M25.
On certain sections of the M25 where congestion is present in the peak hours, there has been some spreading of the peak. Of major importance is that, if peak spreading has occurred, then the reverse may also occur following improvements in capacity.
Traffic growth on major radial routes outside the M25 has often been greater than growth on the same radial routes inside the M25, suggesting that much of the traffic on the M25 is made up of the reassignment of existing, particularly radial, movements. (This point may be evidence of the 'in, round, and back out again' phenomenon we identified in Chapter 3.)
5.04 In conclusion, we note that, in the period from 1980 to 1987, it was apparent that traffic flows on the M25 were much greater than had been forecast. The Department commissioned Consultants to review the reasons for this. Analysis carried out in 1988 (before the full behavioural responses could have been revealed) suggested reasons for thinking that reassignment, redistribution, mode shift and peak spreading had already been important, and that induced development traffic might become so in the future. Nothing was known about generated or suppressed trips. It was apparently not possible to quantify the relative importance of these effects. No attempt was made to argue that the M25 traffic could be entirely made up of reassigned existing traffic, even in the early period after its opening. We conclude that the M25 experience most probably does, as is popularly thought, serve as an example of a case where 'roads generate traffic', though the size of this effect has not been properly established.
LITERATURE REVIEWS
- 5.05 The Department of Transport commissioned two literature reVIews. Their general overall conclusions were as follows.
- 5.06 Pells (1989) cited 78 published and unpublished studies, theoretical discussions, modelling exercises and traffic counts. Pells reported a wide range of results, with induced traffic (defined very broadly, that is, all extra traffic other than reassignment) ranging from 00/0 to 760/0 of observed increases in traffic flows. There was evidence that trip retiming could be important, and weak evidence on the relative importance of redistribution, modal change, and generated trips (each of which could represent 2% to 10% of traffic) and land-use effects.
- 5.07 Howard Humphreys and Partners (1993) cited 12 studies. The report suggested that there were two categories of effects: (a) those changes which Hare generally acknowledged as potentially taking place", namely wide-area reassignment, redistribution and modal split, and (b) Hmore controversial items whose existence as a result of new road schemes is in doubt", namely trip retiming, development location, suppressed demand, new trips, and trips made more frequently. The overall conclusion of the authors was:
- HNone of the studies has provided evidence that road improvements cause any of the effects listed in the second group to occur. The majority of the results obtained can be explained by effects in the first group, ofwhich wide area reassignment is the most likely contributor. There is also no evidence that redistribution or modal split occurs to any material extent. ".
- 5.08 The more important studies common to both literature reviews were the subject of evidence submitted to us directly and we consider these in more detail below, together with the Department of Transport's comments on them, which broadly follow the Howard Humphreys' rather than Pells' assessment. However, it is helpful also to add three others included in the Pells review, which is done in paragraph 5.27 et seq.
DEPARTMENT OF TRANSPORT MONITORING OF FORECASTS AND OBSERVED TRAFFIC
- 5.09 The Department operates a monitoring system to compare observed traffic flows on recently-opened schemes with the forecasts which had been made at Order publication stage. The system was first set up in 1981, and we have been provided with the results of the analysis carried out since then. The first report in this series to be published was the sixth, entitled 'Comparison of Forecast and Observed Traffic on Trunk Road Schemes' (Department of Transport 1993). It analysed the new schemes which had become available during the year, together with the accumulated results of the schemes which had been monitored since the start of the work.
- 5.10 The Department of Transport's view is that, if induced traffic was important but had been wrongly ignored at the time of making the forecasts, there would be a general tendency for observed traffic to be higher than the forecasts, that is, the forecasts would be underestimates. The Department's general conclusion in the sixth report (as in previous ones) was that:
"There is no evidence ofsuch an effect. ".
- 5.11 This monitoring work seems to have been an influential piece of evidence in persuading the Department that induced traffic as a result of trunk road schemes is not of general significance. Reports by the Department of its latest published analysis (Harris 1993) continue to make the same general argument, which may be summarised as follows:
- the mean result for all schemes studied is that flows were underestimated by 12%;
- forecasts for all the schemes were made using the 1980 or 1984 National Road Traffic Forecasts as part of their basic input data;
- the 1980 and 1984 NRTFs failed to anticipate the high economic growth rates of the mid-1980s and, therefore, underestimated the growth in national traffic levels, by an average factor of 16%; and, therefore
- the discrepancies between forecasts and observed traffic for specific schemes have to be corrected for the error in the national forecasts before any inference about induced traffic may be drawn and, once this is done, there is no systematic evidence of the existence of induced traffic.
5.12 We discussed this methodology and inference with the Department of Transport in some detail and, because of the importance that the analyses have had in the past, we report these below. However, it is fair to point out that during the course of these discussions the Department of Transport made a very important caveat, as follows:
- "... it should be noted that the Scheme Forecast Monitoring System was established in 1981 to provide information on the accuracy or otherwise of the Department's traffic modelling and forecasts for individual trunk road
schemes. It was not specifically designed to examine the issue of induced traffic, and this limits the scope of the analyses which can be applied. ".
5.13 The Committee fully endorses this caveat. It is most uncertain that either the existence or non-existence of induced traffic can legitimately be inferred from the results of this monitoring programme, and it is likely that the Department's conclusions referred to in paragraph 5.10 may therefore have been given more weight than they deserved. The reasons for this are discussed below.
5.14 Nevertheless, we found it of considerable interest to examine the data used and the analysis carried out, and the Department provided us with details of the schemes studied. Table 5.1 contains, for each of the 151 schemes for which data are now available, the forecast flow, the comparable observed flow, and the ratio of the forecast to observed flows. The last column contains a second ratio of the forecast to observed flows, after correction for the errors in the National Road Traffic Forecasts.
Table 5.1: Comparison of Forecast and Observed Traffic Flows on Trunk Road Schemes
| Forecast Traffic flow, veh/day |
Observed Traffic flow, veh/day |
Forecast Observed |
Forecast Observed after NRTF correction |
|---|---|---|---|
| 27,713 | 58,900 | 0.471 | 0.531 |
| 12,800 | 15,900 | 0.805 | 0.866 |
| 24,520 | 27,200 | 0.901 | 0.901 |
| 31,320 | 29,870 | 1.049 | 1.027 |
| 25,650 | 23,700 | 1.082 | 1.082 |
| 36,500 | 34,500 | 1.058 | 1.104 |
| 20,700 | 18,450 | 1.122 | 1.283 |
32,200 27,400 1.175 1.408 33,200 22,600 1.469 1.541
Urban Schemes
Rural Schemes
| Forecast Traffic flow, veh/day |
Observed Traffic flow, veh/day |
Forecast Observed |
Forecast Observed after NRTF correction |
|---|---|---|---|
| 24,005 | 47,718 | 0.503 | 0.555 |
| 6,150 | 10,090 | 0.610 | 0.610 |
| 23,915 | 42,292 | 0.565 | 0.624 |
| 8,110 | 12,692 | 0.639 | 0.705 |
| 4,710 | 7,445 | 0.633 | 0.727 |
| 5,900 | 8,675 | 0.680 | 0.747 |
| 24950 | 36690 | 0.680 | 0.750 |
Table 5.1 continued Rural Schemes continued
| Forecast | Observed | Forecast | Forecast |
|---|---|---|---|
| Traffic flow, | Traffic flow, | Observed | Observed |
| veh/day | veh/day | after NRTF | |
| correction | |||
| 9,630 | 14,000 | 0.688 | 0.786 |
| 7,611 | 10,712 | 0.711 | 0.812 |
| 7,300 | 9,775 | 0.747 | 0.820 |
| 9,100 | 12,900 | 0.705 | 0.821 |
| 7,220 | 9,595 | 0.752 | 0.841 |
| 6,500 | 8,800 | 0.739 | 0.897 |
| 7,265 | 9,440 | 0.770 | 0.901 |
| 16,155 | 20,710 | 0.780 | 0.911 |
| 7,590 | 9,510 | 0.798 | 0.912 |
| 9,205 | 10,350 | 0.889 | 0.922 |
| 5,400 | 6,500 | 0.831 | 0.946 |
| 18,840 | 21,850 | 0.862 | 0.952 |
| 6,400 | 7,050 | 0.908 | 0.953 |
| 9,160 | 10,945 | 0.837 | 0.958 |
| 9,450 | 11,265 | 0.839 | 0.964 |
| 11,500 | 13,800 | 0.833 | 0.970 |
| 7,700 | 9,200 | 0.837 | 0.996 |
| 6,725 | 7,565 | 0.889 | 1.000 |
| 13,737 | 15,148 | 0.907 | 1.000 |
| 7,005 | 7,165 | 0.978 | 1.014 |
| 17,800 | 19,250 | 0.925 | 1.015 |
| 8,651 | 9,100 | 0.951 | 1.026 |
| 13,350 | 13,000 | 1.027 | 1.027 |
| 5,850 | 6,205 | 0.943 | 1.035 |
| 11,400 | 12,775 | 0.892 | 1.039 |
| 4,900 | 5,700 | 0.860 | 1.044 |
| 13,290 | 12,645 | 1.051 | 1.051 |
| 23,050 | 24,686 | 0.934 | 1.052 |
| 16,900 | 18,500 | 0.914 | 1.057 |
| 13,300 | 14,200 | 0.937 | 1.067 |
| 9,100 | 9,600 | 0.948 | 1.070 |
| 6,600 | 7,600 | 0.868 | 1.073 |
| 16,550 | 15,900 | 1.041 | 1.079 |
| 22,100 | 23,400 | 0.944 | 1.082 |
| 26,900 | 27,155 | 0.991 | 1.094 |
| 9,650 | 9,750 | 0.990 | 1.117 |
| 19,813 | 19,509 | 1.016 | 1.120 |
| 12,700 | 12,800 | 0.992 | 1.140 |
Table 5.1 continued
Rural Schemes continued
| Forecast Traffic flow, veh/day |
Observed Traffic flow, veh/day |
Forecast Observed |
|
|---|---|---|---|
| 12,565 | 12,830 | 0.979 | 1.140 |
| 5,200 | 4,750 | 1.095 | 1.142 |
| 13,965 | 13,875 | 1.006 | 1.152 |
| 3,250 | 2,715 | 1.197 | 1.219 |
| 10,450 | 10,300 | 1.015 | 1.233 |
| 6,800 | 5,685 | 1.196 | 1.248 |
| 18,720 | 16,730 | 1.119 | 1.268 |
| 6,600 | 5,200 | 1.269 | 1.284 |
| 12,033 | 10,562 | 1.139 | 1.301 |
| 6,670 | 5,300 | 1.258 | 1.325 |
| 7,925 | 5,900 | 1.343 | 1.343 |
| 15,000 | 12,100 | 1.240 | 1.353 |
| 7,500 | 5,750 | 1.304 | 1.370 |
| 27,500 | 23,400 | 1.175 | 1.419 |
| 15,900 | 12,300 | 1.293 | 1.564 |
| 11,000 | 8,100 | 1.358 | 1.640 |
On-line Improvements
| Forecast Traffic flow, veh/day |
Observed Traffic flow, veh/day |
Forecast Observed |
Forecast Observed after NRTF correction |
|---|---|---|---|
| 18,555 | 26,530 | 0.699 | 0.800 |
| 51,000 | 69,000 | 0.739 | 0.875 |
| 58,005 | 77,305 | 0.750 | 0.941 |
| 64,990 | 74,000 | 0.878 | 0.956 |
| 133,700 | 156,900 | 0.852 | 0.961 |
| 35,700 | 42,200 | 0.846 | 0.991 |
| 15,500 | 18,200 | 0.852 | 0.992 |
| 6,015 | 6,845 | 0.879 | 0.992 |
| 8,650 | 9,670 | 0.895 | 1.023 |
| 18,315 | 20,681 | 0.886 | 1.035 |
Table 5.1 continued
Motorway Schemes
| Forecast Traffic flow, veh/day |
Observed Traffic flow, veh/day |
Forecast Observed |
Forecast Observed after NRTF correction |
|---|---|---|---|
| 53,300 | 98,000 | 0.544 | 0.616 |
| 20,500 | 30,350 | 0.675 | 0.675 |
| 9,710 | 16,600 | 0.585 | 0.688 |
| 53,272 | 73,763 | 0.722 | 0.779 |
| 20,950 | 27,590 | 0.759 | 0.923 |
| 46,660 | 44,470 | 1.049 | 1.198 |
| 28,980 | 21,677 | 1.337 | 1.443 |
| 25,600 | 18,750 | 1.365 | 1.581 |
| 23,350 | 13,700 | 1.704 | 1.959 |
| 31,100 | 15,000 | 2.073 | 2.085 |
| 42,800 | 20,150 | 2.124 | 2.286 |
Junction Improvements
| Forecast Traffic flow, veh/day |
Observed Traffic flow, veh/day |
Forecast Observed |
|
|---|---|---|---|
| 6,960 | 11,635 | 0.598 | 0.687 |
| 15,320 | 21,080 | 0.727 | 0.758 |
| 2,250 | 2,800 | 0.804 | 0.835 |
| 16,300 | 19,900 | 0.819 | 0.851 |
| 21,820 | 28,732 | 0.759 | 0.858 |
| 35,410 | 46,250 | 0.766 | 0.875 |
| 24,000 | 30,600 | 0.784 | 0.893 |
| 19,755 | 24,855 | 0.795 | 0.897 |
| 6,765 | 8,395 | 0.806 | 0.957 |
| 11,640 | 13,750 | 0.847 | 0.969 |
| 2,895 | 3,000 | 0.965 | 1.039 |
| 54,300 | 60,800 | 0.893 | 1.066 |
| 3,800 | 3,670 | 1.035 | 1.184 |
| 65,800 | 62,500 | 1.053 | 1.188 |
| 6,075 | 4,918 | 1.235 | 1.235 |
| 2,000 | 1,500 | 1.333 | 1.357 |
| 25,600 | 19,250 | 1.330 | 1.382 |
Table 5.1 continued
Bypasses
| Forecast Traffic flow, vehlday |
Observed Traffic flow, veh/day |
Forecast Observed |
Forecast Observed after NRTF correction |
|---|---|---|---|
| 5,370 | 9,734 | 0.552 | 0.646 |
| 4,323 | 6,907 | 0.626 | 0.690 |
| 28,775 | 42,640 | 0.675 | 0.736 |
| 12,006 | 17,629 | 0.681 | 0.751 |
| 4,183 | 5,965 | 0.701 | 0.757 |
| 4,000 | 6,300 | 0.635 | 0.771 |
| 3,400 | 4,740 | 0.717 | 0.783 |
| 31,190 | 43,695 | 0.714 | 0.787 |
| 8,500 | 10,850 | 0.783 | 0.812 |
| 7,670 | 10,614 | 0.723 | 0.830 |
| 5,100 | 6,350 | 0.803 | 0.910 |
| 7,300 | 9,000 | 0.811 | 0.915 |
| 18,675 | 24,700 | 0.756 | 0.919 |
| 9,200 | 10,650 | 0.864 | 0.943 |
| 7,170 | 9,175 | 0.781 | 0.949 |
| 27,330 | 28,100 | 0.973 | 0.953 |
| 4,610 | 5,000 | 0.922 | 0.968 |
| 10,375 | 11,800 | 0.879 | 0.970 |
| 31,180 | 31,300 | 0.996 | 0.976 |
| 18,300 | 19,350 | 0.946 | 0.980 |
| 16,400 | 18,000 | 0.911 | 0.996 |
| 7,955 | 8,261 | 0.963 | 1.026 |
| 10,770 | 10,475 | 1.028 | 1.028 |
| 7,125 | 7,000 | 1.018 | 1.030 |
| 16,070 | 15,250 | 1.054 | 1.054 |
| 40,380 | 42,750 | 0.945 | 1.125 |
| 15,600 | 15,660 | 0.996 | 1.145 |
| 8,930 | 8,810 | 1.014 | 1.177 |
| 14,665 | 14,280 | 1.027 | 1.200 |
| 8,000 | 7,600 | 1.053 | 1.210 |
| 5,333 | 4,605 | 1.158 | 1.250 |
| 15,000 | 13,000 | 1.154 | 1.267 |
| 10,000 | 8,150 | 1.227 | 1.280 |
| 12,000 | 9,200 | 1.304 | 1.427 |
| 26,700 | 22,500 | 1.187 | 1.449 |
| 5,500 | 4,600 | 1.196 | 1.453 |
| 6,100 | 3,905 | 1.562 | 1.620 |
| 16,100 | 10,260 | 1.569 | 1.792 |
| 25,200 | 15,124 | 1.666 | 1.798 |
Table 5.1 continued
Bypasses continued
| Forecast Traffic flow, veh/day |
Observed Traffic flow, veh/day |
Forecast Observed |
Forecast Observed after NRTF correction |
|---|---|---|---|
| 13,510 | 8,500 | 1.589 | 1.827 |
| 17,850 | 10,900 | 1.638 | 1.872 |
| 25,595 | 13,300 | 1.924 | 1.924 |
| 13,470 | 6,610 | 2.038 | 2.038 |
5.15 Figure 5.2 shows the pattern of errors before making the NRTF correction. On the face of it, these results seem to indicate a tendency to underpredict traffic, which the Department had hypothesised would occur if induced traffic was significant. This is different for the different types of scheme, as might be expected. The Department drew attention to the fact that the forecasts were worst for new motof\Vay links ("a huge spread ofresults'') and those for bypass schemes were "relatively poor". Traffic forecasts for junction improvements were predicted more accurately than for most other types ("with all the errors falling within ±40%''), and the forecasts for on-line improvements were the best. The results for all 151 schemes, after correcting for the NRTF errors, are shown in Figure 5.3. It will be seen that the spread of overestimates and underestimates is now reduced.
Figure 5.2: Accuracy of Traffic Forecasts, by Type of Trunk Road Scheme, Without Correction
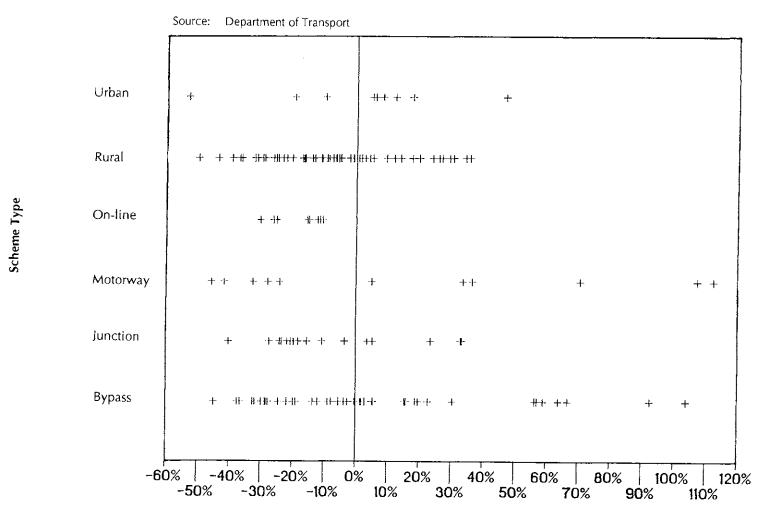
Accuracy (forecast/observed - 1) x 100%
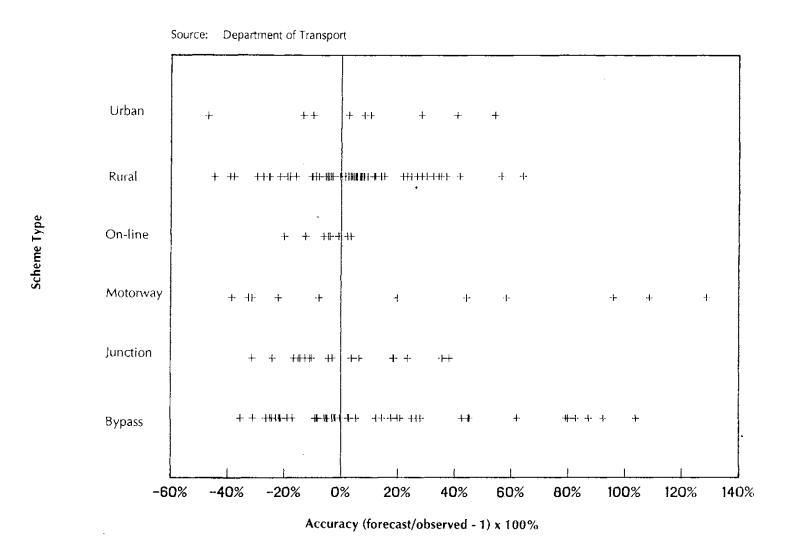
Figure 5.3: Accuracy of Traffic Forecasts, by Type of Trunk Road Scheme, After NRTF Correction
5.16 The National Audit Office, in its 1988 Report, addressed this question of the accuracy of the Department's forecasts. It concluded that:
"... wide variations of this kind must raise questions about the economy, efficiency and effectiveness with which resources were used in the construction of the schemes concerned. ".
5.17 In evidence to the Committee, the Department concluded:
"It is clear that the Department's traffic forecasts have underpredicted the amount of traffic using the majority of these schemes. This underprediction comes directly from the inaccuracy of the 1980 and 1984 NRTFs, and once this is allowed for, the remainder of the traffic forecasting procedure is seen to introduce no further significant bias. ".
- 5.18 The Committee was not convinced by this argument and suggested four key reasons for rejecting it, namely:
- There is a circularity in the reasoning. The legitimacy of subtracting the NRTF errors from the scheme errors depends wholly on the assumption that all the NRTF errors are due to higher than expected economic growth. In turn, this depends on the legitimacy of the NRTF assumption that there is no induced traffic caused at the national level by the Road Programme as a whole. Therefore, the correction is tantamount to concluding that there was no induced
traffic for individual schemes after one has assumed that there is no induced traffic for all the schemes taken together. By the same argument, even if the forecasts, based on NRTF, had been accurate, then this still would not have disproved the existence of induced traffic, for it could be that the NRTF figures had themselves incorporated about the right quantity of induced traffic at the national level, as part of the exogenous growth. In the past, some traffic growth due to the induced effects of capacity improvements may have been attributed instead to economic growth.
- The basis of measurement is far too limited. The main focus of the Department's counts is the traffic flows on the improved road itself. As we have discussed above, if traffic is induced, it is likely to appear not only on the improved road, but also on the relieved roads and possibly quite far afield. Therefore, such calculations could only disprove the existence of induced traffic if they included the other roads on which such traffic might appear.
- The comparison is made too soon. The counts are taken about one year after opening, which would not be long enough to observe anything like full effects on home and job relocation, mode switching, and changes in travel and development patterns generally.
- The models used for forecasting, in common with all models, contain errors of quite different kinds. Where these errors are random, it is likely that they will be evenly spread as either overestimates or underestimates. However, this does not imply that an even spread proves that the errors are random. When considering specific schemes, it is likely that the reasons why one scheme is underestimated will be different from the reasons why another scheme is overestimated. In this case, it would not be valid (in fact it would be quite misleading) to discount the importance of one by the existence of the other. Moreover, even after the adjustments to the figures, over half of the forecasts are still in error by more than 200/0.
- 5.19 In supplementary evidence submitted to the Committee, after discussion of the implications of these results, the Department of Transport offered the following argument:
- "] The approach adopted in the Scheme Forecast Monitoring analysis assumes that, for any given scheme, none of the error in the NRTF is attributable to that particular scheme. The reasons why this is valid, or very nearly so, are discussed below.
- 2 National traffic growth is dependent upon a number offactors. There is reason to believe that the main contributors are growth in the economy and changes in fuel prices. Examination ofpast trends suggests that errors in predicting national traffic growth are closely linked to errors in predicting these variables. The contribution of these factors to errors in the NRTF is, clearly, not attributable to any single scheme.
- 3 Investment in the road network as a whole may also be a contributor to gro}vth in national traffic. Ifschemes result in induced traffic, that additional traffic
will form part of the observed national growth in traffic. It has been suggested that induced traffic e.ffects may continue for a number of years after the scheme has opened. If that is so, the contribution of induced traffic to national growth in traffic in any given year would be the combined effect ofall schemes opened over a number of earlier years. However, the contribution of anyone scheme will be very small, especially during the scheme's opening year.
- 4 The NRTF does not explicitly consider the contribution to national traffic growth of investment in the road network, nor that of declining level of service. However, since the NRTF is based on extensive study of past trends, the combined effects ofimprovements and deterioration can be considered to be implicit in the forecasts. If that approach is inadequate, it could be a source of error in the forecasts. Any such errors would represent the combined effects of all schemes opened over a period of years. Thus, the impact of a single scheme on errors in the NRTF will be very small.
- 5 In the Scheme Forecast Monitoring analysis, the adjustment made to the forecast for each scheme relates to the period between the year on which the forecast is based (usually shortly before 0 PR stage) and the year in which the outturn traffic counts are taken (usually about a year after opening). This period varies from five to thirteen years. Since most of the period precedes scheme opening, the contribution of the scheme to national growth in that period will be very small. Thus the assumption that the scheme contributes nothing to any error in the NRTF during that period is considered to be reasonable.
- 6 As the above discussion suggests, making this adjustment does not imply that induced traffic is assumed not to contribute to NRTF, nor does it imply that errors in the NRTF cannot be due to inadequate treatment of induced traffic at the national level. Making this adjustment enables the analysis to reveal more clearly any deficiencies in the scheme-related aspects of the appraisal of the scheme.
- 7 In particular, this analysis should reveal any deficiencies arising as a result of inadequate handling of induced traffic, provided they are concentrated on the links monitored (although more diffuse effects would not be detected). However, it would not reveal induced traffic as a result of a scheme if it was evenly spread over the whole national network. Since the latter event is very unlikely, it is reasonable to argue in principle that the adjustment will not eliminate the very factor it is trying to identify.
- 8 The Scheme Forecast Monitoring analysis does not directly consider whether investment in the road network as a whole results in induced traffic. If the analysis of individual schemes revealed that all were biassed as a result of induced traffic, that would enable an estimate of the overall impact of investment. But that is not the case. At best, the results for a minority ofschemes may be biassed as a result ofinduced traffic (see below), but that does not enable judgments to be made about the effects of the road programme as a whole. In addition, the analysis is limited in its scope, and may overlook any more diffuse effects that may occur. There may also be network effects which the scheme by scheme analysis would not reveal. The limited amount of information in the system means that more detailed analyses to address these issues is unlikely to be feasible.
Timing of outturn tramc counts
- 9 The Committee have also observed that the Department's practice of collecting outturn data about a year after the scheme has opened means that longer term induced traffic effects will not have been observed.
- 10 The Department accepts this, and is planning to carry out further counts on schemes which have been open for a number of years. While the Department appreciates the importance of these longer term effects, it has been unable before now to investigate them through the Scheme Forecast Monitoring system because few of the schemes in the system have been open for a sufficiently long time. A reasonable number of schemes is required to ensure that the variability in scheme forecasting performance does not unduly affect any conclusions that may be drawn from the analysis.
- 11 However, it is sensible to be cautious about the value to be gained from this planned extension of the work. Comparing forecasts with outturn becomes increasingly difficult as the time between making the forecasts and carrying out the counts increases. This is because other extraneous changes may occur, affecting the outturn. Current analyses are based on forecasts covering periods ranging from five to thirteen years (average eight) - already a substantial time interval.
Location of outturn tramc counts
- 12 The Committee notes that the Department's studies are confined to the new road and its immediate competitor. This means that any 'ripple' effects or other impacts beyond these roads will not be detected.
- 13 Again, the Department accepts this deficiency. The Committee has noted the budgetary reasons for this.
- 14 Nevertheless, in selecting these roads, most of the journeys which will have experienced greatest improvements in generalised costs will have been intercepted. Those movements will be most likely to exhibit induced traffic effects. Thus, these are the locations where induced traffic is most likely to be detected.
The importance ofsome outliers
- 15 Finally, the Committee has observed that the results of the Scheme Forecast Monitoring analysis include a number of schemes which are either overpredictions or underpredictions. It suggests that reasons for underprediction may be different from reasons for overprediction.
16 This is true. Although random errors make a significant contribution, there also other reasons for errors which, where they apply, have a systematic effect. The Department has explored the reasons for the more extreme errors, and has identified a variety of causes of systematic error. Some of these lead to overprediction, some to underprediction. Clearly, failure to take account of induced traffic could explain some of the underpredictions.
17 Taking account of the likelihood of other reasons for errors, and making an allowance for the random errors in both the models (used to produce the forecast) and the outturn counts, the number of schemes where underpredictions could be due to induced traffic is likely to be quite small. Estimating the numbers involved requires the identification ofthose schemes affected. This would be difficult to do.
18 Examining the outliers one by one would be an essential first step, but would need to be supported by an examination of more extensive data than is available in the Scheme Forecast Monitoring database. Given the difficulties involved in identifying induced traffic (Mr P Bonsall of ITS, Leeds has provided evidence to SA CTRA on this issue), data collection would need to be carefully designed to specifically resolve this issue.
Conclusions
- 19 The limitations of the Scheme Forecast Monitoring system restrict its ability to detect induced traffic effects. Within those limitations, the results produced have been examined for evidence of induced traffic-effects due to individual schemes. For most schemes, there is no clear evidence of such an effect at the scheme level. However, it may have been a factor resulting in underprediction for a limited number ofschemes. ".
- 5.20 The Committee is in agreement that the. short timespan and narrow geographical coverage limit the relevance of the results for the issue of induced traffic. That being so, it becomes less necessary to come to a firm short-term conclusion on the remaining disputed issue, that is, whether the NRTF correction is indeed legitimate for the assessment of induced traffic at the scheme level, since the counts would not be used for this purpose anyway. It seems difficult to take this further until two conditions are fulfilled: (a) that the NRTFs themselves include explicitly the effects of congestion, travel times and road capacity on overall traffic levels, with suitable allowance for the collinearity of income growth, traffic growth, and road capacity growth; and (b) that monitoring results cover changes in traffic levels on both the improved roads and alternative routes, modes, and destinations over a wide area and longer timescale, with behavioural, as well as traffic count, information. Both of these are planned in the Department's research programme.
- 5.21 In conclusion, we note that systematic traffic counts for 151 schemes carried out as part of the Department of Transport's monitoring programme show a very wide range of forecasting errors, with an average tendency to underestimate traffic, especially on new motorway links and bypass schemes. The Department had proposed that, if induced traffic exists, then evidence for it would be seen in a tendency for the forecasts to underestimate traffic flows after the scheme is opened. Such a tendency does exist, but the Department suggested that it is not due to induced traffic, but rather to separate errors in the National Road Traffic Forecasts. The Committee is not convinced that the Department's test is logically valid, but if it is a valid test at scheme level, this still leaves open the possibility that there is a significant element of induced traffic at the network-wide level. Either way, it does not seem tenable to treat the results of the monitoring programme as demonstrating that induced traffic is negligible. In a revised analysis of the results of the scheme monitoring, the Department has suggested that there are, in any case, serious limits to the
extent to which the before-and-after monitoring results, as originally designed, are suitable for testing the existence, size or characteristics of induced traffic. This is because the roads covered are too narrowly-defined and the time period too short. The Committee concurs.
DETAILED ANALYSES OF TRAFFIC FLOWS ON SPECIFIC SCHEMES
- 5.22 The following sections describe the results of before and after studies which were submitted as evidence to the Committee, together with some others drawn from literature reviews. Not all the data were in comparable form, but, wherever possible, we present the results in a standard format similar to that quoted in Chapter 4, as published by the Ministry of Transport in 1938, so that traffic counts are shown both on the improved sections and on the relieved roads as well.
- 5.23 In interpreting these figures, we note two important points. First of all, in the simplest case where there is only a short period between before and after counts, if there were no induced traffic, we would expect to see increases in flow on the improved sections matched by equivalent reductions in flow on the relieved roads. Secondly, where longer periods of time have elapsed between the before and after counts, some degree of traffic growth may be expected for other reasons. We have not tried formally to adjust for this, since an explicit judgment about how much traffic growth would have been expected for other reasons is tantamount to prejudging how much can be attributed to induced traffic. However, we note that taking the road system as a whole, average traffic growth lies in the range of 20/0 to 50/0 per year.
Barnstaple Bypass
5.24 The A39 Barnstaple Bypass opened in July 1989 (Figure 5.4). Devon County Council provided traffic counts on the river screenline at Barnstaple, which is at the northern end of the North Devon Link Road. Table 5.2 shows the results.
Table 5.2: Barnstaple Bypass A39, Two-Way Average Annual Daily Traffic Flows, pcu/day
| 1986 | 1988 | 1991 | 1992 | Predicted Growth to 1998 (Low - High) |
|
|---|---|---|---|---|---|
| Road A361 Braunton |
13,700 | 15,200 | 16,200 | 16,100 | - |
| Old A39 |
26,100 | 28,200 | 31,000 | 30,000 | (27,000 - 30,000) |
| New Bypass |
- | - | 10,600 | 10,900 | (3,700 - 9,900) |
| A39 plus Bypass |
26,100 | 28,200 | 41,600 | 40,900 | (30,700 - 39,900) |
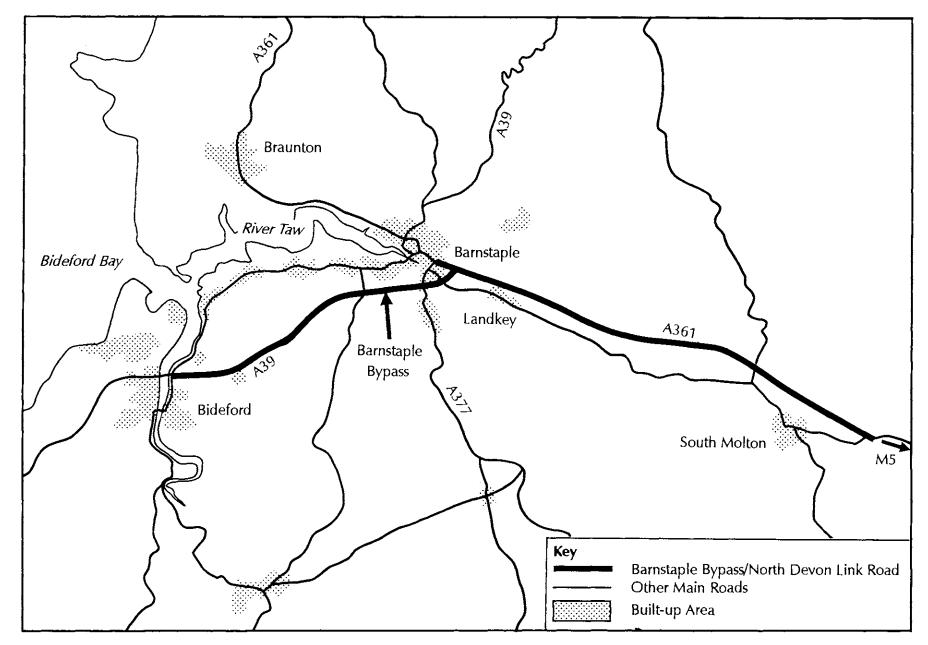
Figure 5.4: Barnstaple Bypass
- 5.25 In this case, the flows soon after opening were already greater than the flows predicted for 1998, which included general traffic growth. It is not apparent that the traffic on the Bypass was matched by a corresponding reduction in traffic on the A39, which has held rather steady. There was some local feeling, based on experience and anecdotal evidence, that new trips are being made on the road and that this is already starting to influence land-use patterns in and around the area.
- 5.26 The Department of Transport provided additional, more detailed analyses, in which the figures were adjusted to take some account of general growth which would have happened with or without the scheme and to apply the NRTF correction as discussed above. Taking these adjustments at face value, their effect is to reduce, but not eliminate, the underprediction. On five screenlines, the one with the lowest observed flows was overpredicted (Bideford Bridge, +150/0) and the other four had an underprediction even after making the adjustments (West of Barnstaple -160/0; River Taw -80/0; East of Barnstaple -280/0; North Devon Link Road -21 0/0). The Department of Transport concluded:
"On the basis of the information available, we cannot say whether this underprediction represents re-assignment from further afield, local economic effects, or induced traffic. However, a residual under-prediction of this magnitude is not exceptional when compared with the degree of variation in the forecasting results for other schemes. ".
PELLS' LITERATURE REVIEW: RESULTS FOR M62, YORK NORTHERN BYPASS, AND SEVERN BRIDGE
M62
- 5.27 Pells quotes results of a study by Judge (1983) in which the generated (including redistributed) traffic on the M62 is calculated by comparing the actual flows with what might have happened, based on the Department of Transport's traffic index for rural roads. This showed a rather slow build-up of estimated generated traffic to a maximum five years after opening, by which it was estimated to account for 18.80/0 of the flow on the M62. These results were controversial at the time, and the Committee cannot be sure that the definition of 'generated' traffic is fully in accord with induced traffic as defined here.
- 5.28 The Department of Transport has suggested to us that the additional traffic is believed to be due to a small amount of redistribution, plus reassignment over a wider area, though in this case the screenline was some 40 miles long. If this is the case, then clearly monitoring studies will have to be designed to cover a very large area indeed.
York Northern Bypass
5.29 This study was carried out in 1988, using roadside interviews. On average, drivers were found to be making eight more trips per three-month period after the Bypass opened than they did before. Table 5.3 shows the estimated breakdown into different classes of response. It is notable that there was a large proportion of retimed trips.
Table 5.3: Results of Roadside Interviews of Drivers Using York Northern Bypass (1988)
| of Classification trips |
Number of responses |
Per cent of trips surveyed* |
|---|---|---|
| Reassigned | 348 | 89.9 |
| Redistributed | 22 | 5.7 |
| Modal diversion |
10 | 2.6 |
| Re-timed (all) |
115 | 29.7 |
| (of which) retimed earlier |
104 | 26.9 |
| (of which) retimed later |
11 | 2.8 |
| Generated (that is, new trips) |
46 | 11.9 |
| Total roadside interviews |
387 | 100.0 |
* The percentage figures in this column add to more than 100.00/0 as more than one response is feasible.
5.30 The Department of Transport argues that the number of extra trips reported should be treated with caution, as drivers making trips more frequently for other reasons would be surveyed and those who have stopped making trips would not. This is undoubtedly true. In any case, the study was a small pilot exercise, of interest mainly because of the attempt (very rare in the other studies reported) to distinguish the various sources of change. The importance of reassignment and trip retiming is evident.
Severn Bridge
- 5.31 Pells reports a survey by Cleary and Thomas (1973), undertaken a year after the opening of the original Bridge. It was estimated that 560/0 of the traffic using the Bridge had been reassigned and 44% had been generated, which again may not have been defined in the same way as our induced traffic. Nevertheless, the result is striking, and it suggests that a similar (or more detailed) study of the behavioural responses to the opening of the Second Severn Bridge - currently under construction - would be most instructive. Such a study would also enable the net effect of tolls on induced traffic to be investigated.
- 5.32 The Department has commented to us
"It has been widely accepted that estuarial crossings encourage trip redistribution. Department practice is to require such effects to be taken into account in these cases. ".
LONDON TRUNK ROAD SCHEMES
Greater London Council Studies of Six Schemes in London
- 5.33 A substantial alnount of research on the existence or otherwise of induced traffic was undertaken, initially by the Greater London Council, and subsequently (after abolition) taken forward by the same authors in various other capacities. Work submitted to us was carried out by Purnell (1985), by Beardwood and Elliott (1986), and others. Six schemes were reported; namely Westway, the MIl, the M3/A316, the North Circular Road, the Blackwall Tunnels and their approaches, and a section of the M25. Their locations are shown on Figure 5.5.
- 5.34 The main method used in these analyses was to carry out screenline counts of traffic using, as far as possible, the entire corridor of the improved road, both before and after the improvement and during the following several years. The proposition was that, if all the observed traffic using the improved road were due to changes in the route chosen by a fixed volume of traffic, then the increased traffic flow on the improved link should be matched by equivalent reductions in traffic flows on alternative routes in the same corridor. A summary of five of the studies follows, with the Committee's own comments at the end.
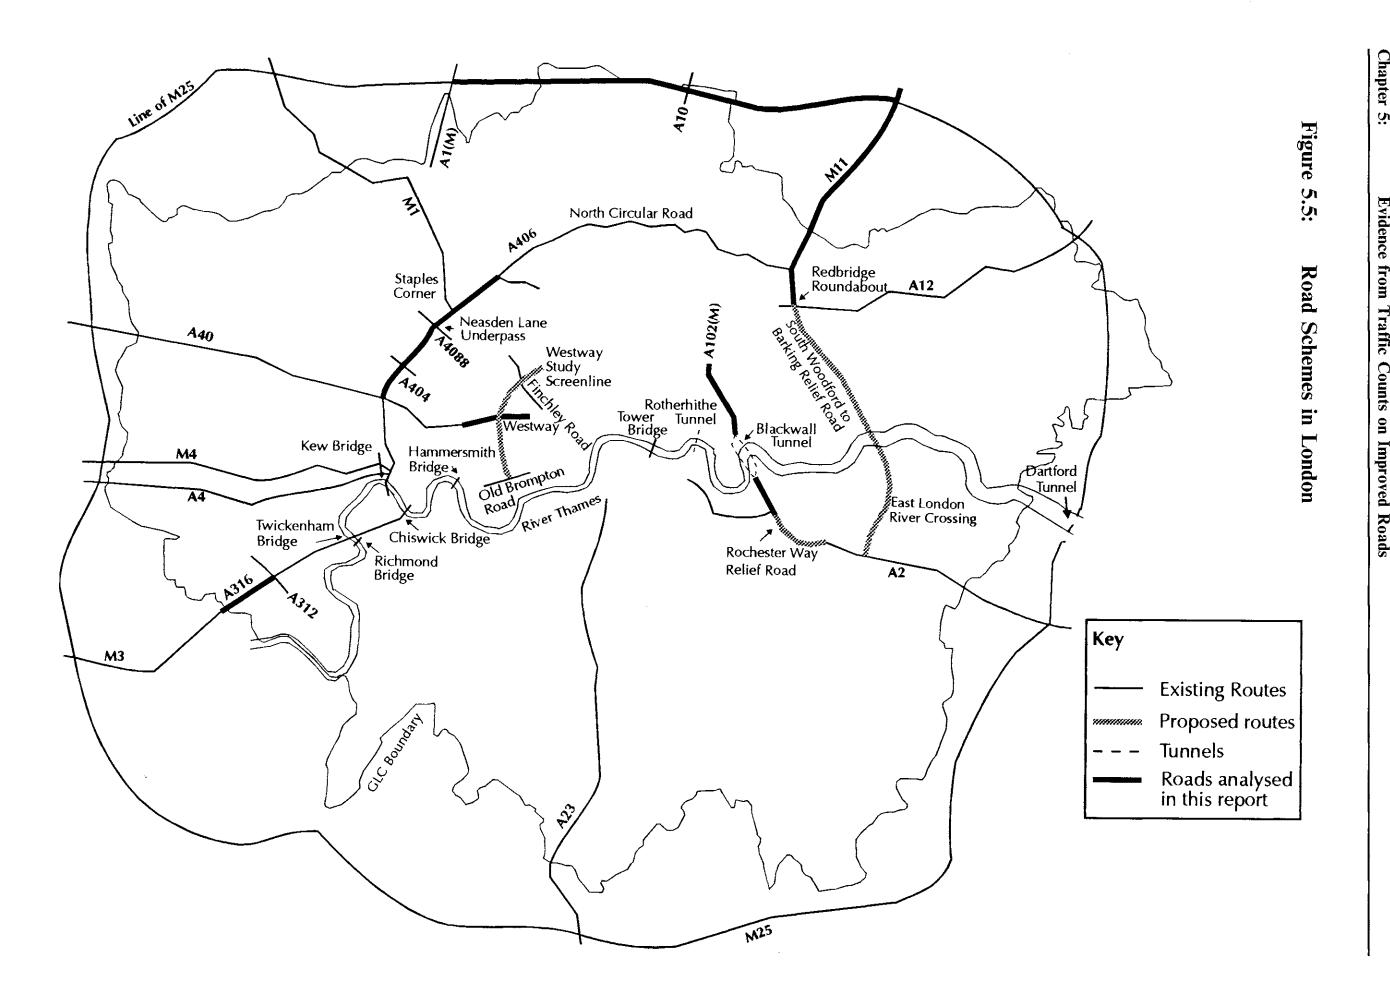
Westway (M40)
5.35 Table 5.4 shows the 1970 24-hour counted flows on Westway, compared with the Finchley Road corridor chosen as a control.
Table 5.4: Westway (M40) Traffic Flows, 1970, veh/day
| Before (May) |
After (Sept) |
Change | |
|---|---|---|---|
| Westway | - | 46,900 | +46,900 |
| Other roads* |
123,500 | 94,100 | -29,400 |
| Total Westway corridor |
123,500 | 141,000 | +17,500 |
| Road Total Finchley corridor |
127,200 | 129,200 | +2,000 |
* Notting Hill Gate, Moscow Road, Dawson Place, Westbourne Grove, Talbot Road, St Stephens Gardens, Harrow Road
- 5.36 The authors point out that the total traffic on Westway was greater than the reductions in traffic on all the alternative roads, and that in five months, traffic in the Westway corridor as a whole increased by 140/0, whereas in the Finchley Road corridor traffic only increased by 20/0. They suggest that it is probable that a significant proportion of the additional 17,500 vehicles per day should be counted as generated (in our terminology, 'induced'). It is noted that the screenline may not be perfect, and that there may be some more distantly reassigned trips from north of Harrow Road. However, it is notable that there were only small changes on the Harrow Road itself during the whole period of the analysis, so the authors did not expect any significant extra reassignment.
- 5.37 Using the same form of analysis, they note that the discrepancy between increases in traffic on the new road compared with smaller reductions in traffic on the alternative roads is greater for inbound peak period trips, amounting to 47.50/0 of the Westway flow.
- 5.38 Figure 5.6 shows the results of a similar exercise continued over the subsequent 14 years, compared with both the Finchley Road corridor and the Old Brompton Road corridor.
- 5.39 It may be seen that traffic growth on the Westway corridor continued steeply for some five years after opening, by comparison with the much more stable traffic levels on the other corridors. In a subsequent submission, Elliott has suggested that (on admittedly somewhat arbitrary assumptions about the level of 'natural' growth) nearly two-thirds of the traffic on Westway might be counted as induced.
- 5.40 The Department of Transport commissioned a separate assessment of these figures from consultants Howard Humphreys and Partners, as part of preparation for evidence at a 1993 Public Inquiry on the A406 North Circular Road - Popes Lane to Western Avenue Improvement scheme. The Consultants took note of the underestimate a11d suggested that the additional traffic induced by Westway could be due to wider-area reassignment, modal transfer and possibly trip redistribution, though the effect was obscured by the length of the screenline and construction work which affected the before counts.
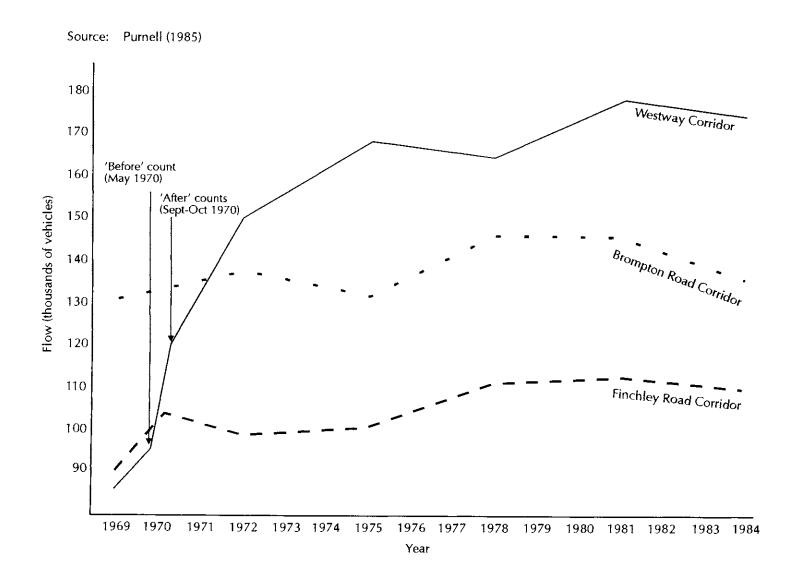
Figure 5.6: Traffic Growth in the Westway, Finchley Road and Old Brompton Road Corridors
MIl near Epping
5.41 Counts were carried out at three year intervals at the GLC boundary, of traffic using the MIl corridor between London and, on completion, Cambridge. Table 5.5 summarises the results.
| 1974 | 1977 | 1980 | 1983 | Change 1974 to 1983 |
|
|---|---|---|---|---|---|
| MIl | 0 | 22,987 | 34,682 | 53,104 | +53,104 |
| roads* Other |
100,556 | 83,327 | 93,288 | 85,253 | -15,303 |
| Total corridor |
100,556 | 106,314 | 127,970 | 138,357 | +37,801 |
Table 5.5: Traffic Counts (MIl Corridor) 24-hour Two-Way Flow, veh/day
- * A104, A121, Loughton Way, Al13, Lambourne Road, All12
- 5.42 Here, the authors suggest that, over the nine-year period, 290/0 of the observed MIl flows could be accounted for by reassignment (that is, 15,303 out of 53,104), though the remainder consists of both induced traffic and general traffic growth. Their chosen control, the A23 London-Brighton corridor, showed traffic growth of 29% in the same period as the MIl corridor showed 38%. For peak period inbound flows only, the MIl
corridor showed increases of 56%, whilst the A23 corridor showed 33%. The MIl itself showed a growth of 130% in the period of approximately six years after opening. The authors contend that a significant proportion of this extra traffic is induced. Some additional evidence on rail travel in the corridor was also provided, and it was suggested that this indicated a possible increase in road traffic at the expense of rail.
5.43 The Department of Transport suggested, based on the assessment by Howard Humphreys and Partners, that:
"The reported growth on the M 11 itself is regarded as more indicative of wide area reassignment and modal transfer than generated trips. ".
A316 near Sunbury
5.44 The A316 was not a completely new road, but a conversion from dual two-lane to dual three-lane shortly after the M3 was opened from Camberley to Sunbury in 1975-6. Counts were taken at the GLC boundary. Table 5.6 summarises the results. Traffic flow in the corridor as a whole increased by 840/0, while in their chosen control corridor (M4/A4) traffic increased over the same period by 660/0. For peak inbound flows only, traffic on the A316 corridor increased by 107%, but by 41% on the control M4 corridor. The A316 itself showed a growth of 160% from before the M3 was opened (1974) until 1983.
Table 5.6: Traffic Counts (A316 corridor) 24-hour Two-Way Flows, veh/day
| 1971 | 1974 | 1977 | 1980 | 1983 | Change 1971 to 1983 |
|
|---|---|---|---|---|---|---|
| A316 | 17,384 | 21,312 | 44,005 | 52,394 | 55,229 | +37,845 |
| Other roads* |
35,472 | 38,743 | 42,780 | 41,923 | 42,184 | +6,712 |
| Total corridor |
52,856 | 60,055 | 86,785 | 94,317 | 97,413 | +44,557 |
* Staines Road East, Vicarage Road, Chertsey Road
Blackwall Tunnels and Approaches
5.45 This study concerned the duplication of the Blackwall Tunnels in 1968/1969, and improvement of the approach routes either side of the Thames, using Thames screenline counts, cordon counts and roadside interviews. Table 5.7 shows the short-term changes from 1968 to 1969 and Table 5.8 shows the longer term changes in the period 1962- 1982.
| Before (1968) |
After (1969) |
Change 1968 to 1969 |
|
|---|---|---|---|
| Blackwall Tunnels |
22,741 | 32,194 | +9,453 |
| Other bridges/tunnels* |
50,422 | 51,751 | +1,329 |
| Total screen-line |
73,163 | 83,945 | +10,782 |
Table 5.7: Traffic Counts (Lower Thames Screenline) 12-hour Two-Way Flows, veh/day
Table 5.8: Traffic Counts (Lower Thames Screenline) 24-hour Two-Way Flows, veh/day
| 1962 | 1972 | 1982 | Change 1962 to 1982 |
|
|---|---|---|---|---|
| Blackwall Tunnels |
21,000 | 51,000 | 72,000 | +51,000 |
| Other bridges/tunnels* |
45,000 | 82,000 | 95,000 | +50,000 |
| Total screen-line |
66,000 | 133,000 | 167,000 | +101,000 |
* Tower Bridge, Rotherhithe Tunnel, Dartford Tunnel (+41,000 out of the +50,000)
- 5.46 From 1962 to 1982, there was a 1530/0 overall growth in traffic across the screenline, or 91 % if the Dartford Tunnel is excluded - it is included only from 1972. A control screenline consisting of the five bridges from Richmond to Hammersmith showed a growth of 64% in the same period. The morning peak flows (two-way) showed a growth of 1060/0 and 500/0 with and without (respectively) the Dartford tunnel included in the original screenline, and an 8% growth in the Richmond-Hammersmith screenline.
- 5.47 The Department of Transport suggested to us that the screenline used was very limited and excluded London, Southwark, Blackfriars and Waterloo Bridges, all of which serve the A2 corridor. This point would be very relevant if those other bridges showed traffic reductions during the period. The Department commented:
"The reported growth could possibly show trip redistribution and retiming of trips which would be consistent with Departmental advice for estuarial crossings. ".
M25 (River Lea Screenline)
5.48 Table 5.9 shows data collected by the GLC and Hertfordshire County Council on roads north and south of the M25 at the River Lea screenline.
* Tower Bridge, Rotherhithe Tunnel, Dartford Tunnel
| Before (Nov 83) |
After (Feb-Mar 84) |
Change 1983 to 1984 |
|
|---|---|---|---|
| M25 (AlO-A12l) |
40,487 | +40,487 | |
| Other roads* |
199,576 | 176,476 | -23,100 |
| Total screenline |
199,576 | 216,963 | +17,387 |
Table 5.9: Traffic Counts M25/River Lea Screenline, 12-Hour Two-Way Flows, veh/day
- * A4l4, B18l, Essex Road, B194, A12l, AllO, A406, A503, Al02
- 5.49 Over the very short period concerned, the authors suggest that the reductions in traffic on alternative routes was equivalent to 570/0 of the observed flows on the M25. If this percentage is assumed to be reassigned traffic, the remainder could be treated as induced.
- 5.50 The Department of Transport suggested to us:
"This section of the M25 created a continuous length ofmotorway from the Al(M) to the Dartford Tunnel giving a major opportunity for wide area reassignment, as acknowledged by Pells. It would provide a similar opportunity for trip redistribution. ".
5.51 This comment raises an important issue of principle about scheme versus strategic assessment and monitoring. The suggestion is that, in this case (because other schemes had already been completed), it was this one scheme which unlocked the accumulated potential of the other, previous schemes. It would seem wrong to attribute all the effects on the scheme which happened to be last in line, and this underpins the central importance the Committee attaches to strategic assessment of whole corridors or regions - we shall return to this later in our report.
Discussion
- 5.52 In examination of these results and their interpretation as evidence of induced traffic, five different sorts of criticisms were discussed by the Committee.
- 5.53 First, it is extremely difficult to be sure that any cordon or screenline observations are absolutely complete (because of rat-runs) and that a sufficiently large area is covered. This is because there is no limit, in principle, though there is in practice, to the distance that a small proportion of traffic may reassign. Therefore, there is always some probability that a proportion of the traffic has escaped the net. We have not been able to make retrospective assessments of the extent of this potential source of error. There may well have been other roads, not included in the traffic surveys, which did indeed experience a reduction in their traffic levels.
- 5.54 Secondly, we have to consider the role of control corridors and screenlines. In principle, these should be very similar to the improved road in every respect, except that no improvement is made. In practice, this is almost impossible to achieve. In these studies, for example, the control M4/A4 corridor is very close to the A3l6 and the river
crossings in the Upper and Lower parts of the Thames are influenced by very different road conditions and geographical circumstances.
- 5.55 Thirdly, as mentioned above, there is a cleft stick concerning the time period of study. Over a very short period, we can discount the problem of general traffic growth, but a full range of behavioural response could not yet have been completed. With a longer time period, we would expect to have seen a fuller response, but many other things will also have changed in the meantime, and it will not be possible, with certainty, to distinguish 'growth due to inducement' from 'growth due to other factors'.
- 5.56 Fourthly, at best, these analyses indicate that induced traffic may exist. They are not able to give a deeper understanding of the relative importance of different components discussed in Chapters 2 and 3, such as the balance between trip rate changes, redistribution, mode shift, retiming and reassignment. Also, like the Department of Transport counts discussed above, they are not able to distinguish induced traffic from long-distance reassigned traffic.
- 5.57 Fifthly, urban areas in general (and London In particular) may not be relevant to interurban schemes.
- 5.58 Nevertheless, there do seem to be three recurrent elements in the studies, which we are disposed to take seriously as evidence of induced traffic. There is considerable unexplained growth in almost all cases, traffic growth is greater than average in the improved corridors, and there is greater peak period growth on the improved roads. These are discussed below.
- Unexplained Growth. Increases in traffic on the improved roads are consistently greater than reductions (if any) in traffic on alternative routes. Taking the three studies where there was only a short time interval between the before and after counts (Westway, Blackwall Tunnels, M25 (A10-A121)), the net measured increase in traffic in the corridor as a whole ranged from 90/0 to 14% of the total before flow in the corridor, and from 33% to 37% of the measured after flow on the new section. This cannot be explained by general traffic growth, and there has been no suggestion that counting or screenline errors would be of this order of magnitude.
- Greater Overall Growth. Increases in traffic in the corridors as a whole have been greater than both traffic growth generally, and growth in the corridors selected as controls. Taking three sets of results for which longer periods of counts were given, the growth after the immediate increase on opening the improved section amounted to 93% in 14 years for Westway, 131% in six years for the MIl, and 178% in nine years on the A316. This sort of growth is not easy to explain by general income related trends, and reinforces the general discussion of differential growth in Chapter 4.
- Greater Peak Period Growth. Peak period growth rates in the improved sections have been notably high, which is not characteristic of traffic growth generally. This suggests that, when extra capacity is provided, there is a reversal of peakspreading, consistent with both a suppression effect due to congestion and an induced traffic consequence when that is released.
Rochester Way Relief Road
5.59 A study of the Rochester Way Relief Road (RWRR - also shown on Figure 5.5) was carried out by Younes and Crow of Imperial College London, supported by the British Road Federation and the Rees Jeffreys Road Fund. The report of this study was submitted to us by several different agencies, drawing special attention to the conclusions of the authors that:
"there is no evidence at all to show that the road has induced or generated a great deal more traffic within the corridor . .. the increase in traffic has been no more than might have been expected had the road not been built (about two per cent per annum) ".
5.60 Tables 5.10, 5.11 and 5.12 show traffic counts on three screenlines, representing the western and eastern boundaries of the Rochester Way Relief Road corridor, and transverse (that is, north-south) movements across the corridor, respectively.
Table 5.10: Traffic Counts, Western Screenline, Rochester Way Relief Road (A2), 18- Hour Two-Way Flow, pcu/day
| 1978 | 1990 | Change (1978 to 1990) | |
|---|---|---|---|
| RWRR (West) |
- | 68,400 | +68,400 |
| Other roads* |
87,200 | 41,739 | -45,461 |
| Total | 87,200 | 110,139 | +22,939 |
* Shooters Hill Road, Corelli Road, Woolacombe Road, Rochester Way, Dover Patrol Slip Road, Kidbrooke Park Road
Source: Younes (1990), table 3.1.
Table 5.11: Traffic Counts, Eastern Screenline, Rochester Way Relief Road (A2) 18- Hour Two-Way Flow, pcu/day
| 1978 | 1990 | Change | |
|---|---|---|---|
| RWRR (East) |
- | 60,400 | +60,400 |
| Other roads* |
144,300 | 118,000 | -26,300 |
| Total | 144,300 | 178,400 | +34,100 |
* Shooters Hill Road, Rochester Way, Bexley Road, Footscray Road, Sidcup Road
Source: Younes (1990), table 3.2.
5.61 In both the above tables, it is clear that there has been a significant reduction in the traffic on other roads covered by the screenlines, amounting to about half the measured increase on the Relief Road itself. (This is similar to the results of Purnell, Beardwood and Elliott referred to above, although the authors do not draw the same conclusions.) The third table (5.12) records the north-south traffic crossing the Relief Road. The increase of 30% of movements is substantial.
Table 5.12: Traffic Counts in Roads Crossing the Rochester Way Relief Road (A2), 18- Hour Two-Way Flow, veh/day
| 1978 | 1990 | Change | |
|---|---|---|---|
| Transverse roads* |
77,700 | 100,700 | +23,000 |
* Kidbrooke Park Road, Westhorne Avenue, Well Hall Road, Westmount Road, Glenesk Road (the only one to show a reduction), Reifield Road
Source: Younes (1990), table 3.3.
Discussion
5.62 The basic methodology of this study was similar to that of the GLC studies discussed above, and the same caveats and cautions apply. However, discussion of this report also revealed an additional important influence on interpretation, namely the policy context in which the scheme was conceived and built. The authors themselves make a very important caveat, namely that:
"The forces suppressing growth in radial movements, such as inner London congestion and parking controls, have remained unchanged and unaffected by the new road. ".
- 5.63 The specific circumstances of this road scheme were that new radial capacity was produced which could not be used for much increased traffic, due to downstream constraints. As a matter of local policy, grade-separation and the retiming of traffic signals therefore allocated additional effective capacity to transverse movements. When investigating whether there has been induced traffic, therefore, it is necessary to look at both the radial and the transverse movements. The evidence seemed to be that there was indeed an increase in transverse movements, over and above that accounted for by reassignment.
- 5.64 The implication of this seems to be that, if other factors, whether policy or physical constraints, are preventing the growth of traffic, then there may be little induced traffic and intended speed increases can be achieved, in the improved section if not elsewhere. This is an important point, not only for forecasting but also for the policy assumptions on which the forecasting is based. If induced traffic is foreseen, but is prevented by deliberate policy measures or capacity restraint elsewhere in the network, then clearly the geographical area over which the forecast must be made has to be considerably wider than the scheme itself. As one of the authors also comments, current plans for a further upgrading of the Blackwall crossing (one of the capacity constraints) "could well release an element ofsuppressed traffic" which had not previously been apparent.
5.65 Overall, the pattern of changes shown in this study is similar to those shown in the GLC studies. We had expected this study to be one of the more persuasive pieces of evidence
against the existence of important induced traffic effects, since this is how it is often quoted. Tables 5.10 to 5.12 above do not seem to support this interpretation.
5.66 Following discussion of these results, the Committee commissioned one of the authors of the study, Mr Geoffrey Crow, to update the work. Of particular relevance are his conclusions that:
"This review of the changes in traffic flows following the opening of the Rochester Way Relief Road, which has included new data for the period since 1990, has shown that there may possibly be some evidence of an element of induced traffic after all ...
What is clear from the figures is that there has been no substantial increase in the traffic flows within the corridor as a result of the construction of the R WRR. This applies particularly to the traffic flows during the peak periods, but then this is hardly surprising, as the Relief Road was deliberately planned to have limited capacity. This was to be sufficient for all the traffic which would be diverted onto it from other routes at the time of opening, but gave no allolvance for any future growth. As a result of this, the majority of growth during the peak hours has occurred on other roads within the corridor (to the detriment of the local environments). Had the local authority been able to take more effective measures to limit growth on these other roads, then doubtless the overall growth would have been even smaller ...
A significant growth in traffic resulting from generated or induced effect might thus have been expected outside the peak. That this has not occurred is most probably due to other capacity constraints on the onwards routes at the western end of the corridor. ".
5.67 We have considered analyses of traffic counts carried out by the Greater London Council on five road schemes in London, and by Imperial College London with support from the British Road Federation on an additional scheme. They show certain features in common, especially that traffic increases on the sections with extra effective capacity have been greater than the reductions (if any) on other roads for which relief was expected. Although it is not possible to quantify with confidence the relative contributions of different behavioural responses, the analyses did not identify reductions in traffic using other roads amounting to more than about half of the observed increase in traffic using the improved road. Furthermore, there was strong evidence of a shift towards the peak period. We consider that the results are consistent with the expectation that in urban areas where there are many alternative destinations, modes and activities, induced traffic may be an appreciable consequence of major road building schemes. Its extent, however, will be influenced by the availability of capacity on surrounding and downstream roads, and by the effectiveness of any prevailing policies of traffic restraint.
SCHEMES IN THE GREATER MANCHESTER AREA
5.68 The Greater Manchester Transportation Unit reported a number of experiences drawn from their monitoring programme. Two in particular are discussed here, the Leigh Bypass (A579) and the M66 (Figure 5.7).
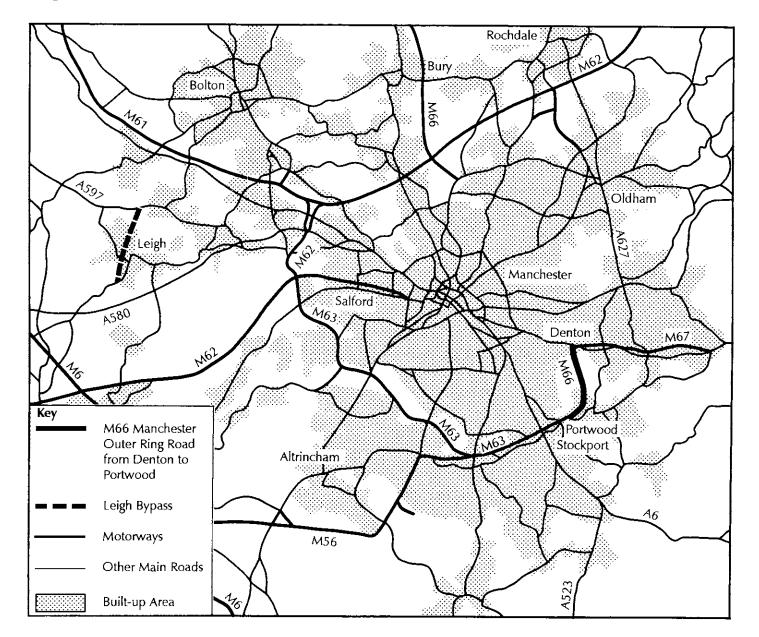
Figure 5.7: Road Schemes in Greater Manchester
Leigh Bypass (A579)
5.69 Table 5.13 shows the results of traffic counts carried out before and after the opening of the Leigh Bypass (Atherleigh Way). In this case, the reduction in traffic on the bypassed road through Leigh town centre was less than the traffic on the scheme (that is, the overall amount of traffic on a screenline increased with the scheme). Traffic using the section of the old road up to the start of the Bypass increased by 37%.
Table 5.13: Traffic Counts on the Leigh Bypass (A579), pcu/day (0730-1800)
| Before (Nov 1985) |
After (Nov 1986) |
Change 1985 Afterto 1986 |
|
|---|---|---|---|
| Bypass* Leigh |
4,320 | +4,320 | |
| road* of Bypassed sections |
8,465 | 5,880 | -2,585 |
| Total screenline |
8,465 | 10,200 | +1,735 |
* Mean of two sections, St Helens Road/Atherleigh Way to Kirkhall Lane, and from there to Lovers Lane, by the old and new routes
Source: Castle and Lawrence (1987), table 2.
5.70 The Department of Transport commented that data were not provided from parallel routes A578 and A573 (5 km and 1 km to the West), and suggested:
"Our examination of the data has identified that the major post opening increases in traffic occurred within the first 6 months, which would be more consistent with reassignment than other forms of induced traffic. ".
5.71 This suggestion (though based on an assumption about the timescales of effects for which no evidence is provided) is, nevertheless, important, as it implies that counts carried out shortly after a scheme opens are less likely to find induced traffic even if it is important.
Manchester Outer Ring Road (M66)
5.72 Traffic counts were carried out, separately for east-west and north-south movements, before and after the opening of the Manchester Outer Ring Road (M66) linking the M63 at Portwood to the M67 at Denton. Tables 5.14 and 5.15 show the results.
Table 5.14: Traffic Counts across East-West Screenline, Manchester Outer Ring Road (M66), 12-Hour Two-Way Flows, pcu/day
| Before (1988) |
After (1989) |
Change 1988 to 1989 |
|
|---|---|---|---|
| M66 | 30,750 | +30,750 | |
| Other roads* |
64,426 | 48,671 | -15,755 |
| Total screenline |
64,426 | 79,421 | +14,995 |
* B6167, Windmill Lane, A6017, A560, Werneth Low Road
Source: Pizzigallo and Mayoh (1989), table 2.
Table 5.15: Traffic Counts on Roads Crossing Manchester Outer Ring Road (M66), 12- Hour Two-Way Flows, pcu/day
| Before (1988) |
After (1989) |
Change 1988 to 1989 |
|
|---|---|---|---|
| M66 (slips) |
15,661 | +15,661 | |
| Other roads* |
134,767 | 139,001 | +4,234 |
| Total | 134,767 | 154,662 | +19,895 |
* A635, B6390, M67, A57, Windmill Lane, Lingard Lane, A560, A626
Source: Pizzigallo and Mayoh (1989), table 1.
5.73 These tables show an increase in total traffic flows in the corridor of the improvement of about 23%, with reductions on alternative routes totalling about half the flow on the new section, and an increase in transverse movements. This shows a remarkable similarity to the case of the Rochester Way Relief Road in London. The Committee noted that, in both cases, the pattern of extra traffic could be consistent either with induced traffic or with reassigned traffic but over a very wide area. It is not easy to
- distinguish these effects without survey data over a sufficient area and of appropriate detail.
- 5.74 The Department of Transport commented that the screenlines excluded the A6 and A34 north-south routes, on which there was a significant reduction in peak hour traffic flows, and suggested that, if these were included, nearly all the traffic on the M66 would seem to be reassigned.
- 5.75 Consideration of a radial relief road and an outer orbital route in the Manchester area showed broadly the same pattern as the London studies, namely that: reductions in flows on the roads relieved were less than the increases in flow on the improved roads; additional traffic may be seen in transverse movements, over and above those on the improved corridor itself; and there is a marked effect on the time of day at which journeys were made.
AMSTERDAM ORBITAL MOTORWAY
5.76 In September 1990, the Zeeburger Tunnel, being the final part of the Amsterdam Orbital Motorway, was opened (Figure 5.8). Hague Consulting Group participated in a study for the Netherlands Ministry of Roads, based on traffic counts and telephone surveys five months before and two months after the opening, and provided the Committee with the results of the surveys. Table 5.16 shows the results of the traffic counts.
New Section of Amsterdam Orbital Motorway Motorways Other Main Roads h:::::::::::::::::::) Built-up Area Weesp
Figure 5.8: Amsterdam Orbital Motorway
Source: Hague Consulting Croup (1992)
| Before (April 1990) |
After (November 1990) |
Change (April to November) |
|
|---|---|---|---|
| Zeeburger Tunnel |
- | 57,700 | +57,700 |
| Other routes |
294,200 | 259,600 | -34,600 |
| Total crossing |
294,200 | 317,300 | +23,100 |
Table 5.16: Traffic Counts Across the North Sea Canal, Amsterdam, 24-Hour Flows, veh/day
- 5.77 The authors adjust the results to allow for seasonal effects and for an 'autonomous' growth in traffic averaging 3.5% over the period, which reduces the overall increase in traffic attributed to the Tunnel from 80/0 to 4.50/0, when expressed as a percentage of total flows, or from 400/0 to 22.7%, when expressed as a percentage of the flows using the Tunnel itself. This seems to suggest that there has been a reduction in traffic of about 45000 vehicles on the other routes to compare with the increase of 57,700 using the Tunnel. Without this growth assumption, a reduction of only 34,600 vehicles on the other routes has actually been observed.
- 5.78 The above figures relate to 24-hour measured traffic flows. The study included also a telephone survey of drivers carried out five months before and two months after the opening. The main findings were that:
- 30% of drivers reported that they had changed their departure times significantly, giving a 16% increase in trips timed in the morning peak;
- 25% of drivers changed their route;
- only 1% to 30/0 of drivers changed their mode of travel, accounted for mainly by a small reduction in the number of car-pools; and
- the increase in traffic across the waterway was only slightly higher than that in the country as a whole, and it was concluded that the survey gave no evidence of significant induced growth on a 24-hour basis.
- 5.79 Given that the after survey was only two months after opening, it is clear that more substantial changes in behaviour, if any, would not be apparent by then. On this, the author comments: "Other effects are expected in the longer run, and monitoring continues.". The Committee did, however, find important the fact that there had been such a large shift in the time of day at which journeys were made, so soon after opening. Indeed, this seems to have been a more important consequence of the Tunnel than the change of route.
- 5.80 This study in Amsterdam has indicated, like the British ones, that an appreciable proportion of traffic flow on the improved link is not matched by an equivalent reduction on other routes. A very short-term survey suggested that the most important behavioural response after reassignment was a shift in the times at which journeys are made.
RESEARCH IN PROGRESS
5.81 As expected, none of the detailed studies involving simple traffic counts before and after a road improvement has successfully identified the relative importance of the different components of induced traffic. The Department of Transport has initiated a number of research projects intended to strengthen the quality of research evidence on these issues. In particular, we note a new series of before-and-after studies designed specifically to improve understanding of traffic responses to highway improvements. Six road schemes, opening over the period 1991 to 1995, have been selected, with after surveys up to two years after the opening. In other work, stated preference methods are being used to identify a range of demand elasticities with respect to various components of the time and money costs of travel. We look forward to seeing results from these studies, which should certainly strengthen evidence on shorter-term effects of schemes, and commend an expansion of the research programme to address those behavioural responses which are likely to take longer to be completed.
GENERAL CONCLUSION ON EVIDENCE FROM TRAFFIC COUNTS
- 5.82 The notable feature of detailed studies of traffic counts before and after a road improvement is that increases in traffic counted on improved roads have, in general, not been offset by equivalent reductions in traffic counted on the unimproved alternative routes. The simplest interpretation of this finding is that the total volume of traffic has increased (though not necessarily all on the improved road itself). This is more consistent with the existence of induced traffic than its absence. This interpretation is reinforced by its consistency with the results of research reviewed in Chapter 4.
- 5.83 These studies are not suitable for judging the relative importance of the different potential components of induced traffic. This leaves open alternative interpretations of the source of the extra traffic, including the possibility (suggested by the Department of Transport) that road improvements may cause rerouteing of trips, over quite wide areas, in which case some or all of the observed extra traffic on the improved road could be drawn from other routes so far away that reductions in their traffic level have not been detected in the counts. While no evidence has been submitted in support of this suggestion, we cannot dismiss the possibility. Indeed, in accordance with the approach outlined in Chapter 3, we would define the extra vehicle-kilometres resulting from re-routeing as a potential element of induced traffic.
REFERENCES
Beardwood J and Elliott J (1986). Roads Generate Traffic. Proceedings of PTRC Summer Annual Meeting.
Castle A and Lawrence J (1987). Leigh Bypass: Before and After Studies. Greater Manchester Transportation Unit.
Cleary E J and Thomas R E (1973). The Economic Consequences of the Severn Bridge and its Associated Motorways. Bath University Press.
Department of Transport (1989). National Road Traffic Forecasts (Great Britain) 1989. HMSO.
Department of Transport (1993). Comparison ofForecast and Observed Traffic on Trunk Road Schemes. Highways Economics and Traffic Appraisal Division.
Harris R C E (1993). Monitoring Department of Transport Traffic Forecasts. Proceedings of PTRC Summer Annual Meeting.
Howard Humphreys & Partners (1993). A Publication Review of Traffic Generation Studies. Evidence for Inquiry on A406 North Circular Road Popes Lane to Western Avenue Improvement.
Judge E J (1983). Regional Issues and Transport I~frastructure: Some Reflections on the Lancashire- Yorkshire Motorway, in Transport Location and Spatial Policy by Button K J and D Gillingwater (eds), Gower, Aldershot.
National Audit Office (1988). Department of Transport, Scottish Development Department and Welsh Office: Road Planning. HMSO. Cm 688.
Pells S R (1989). User Response to New Road Capacity: a Review of Published Evidence. Working Paper 283, Institute for Transport Studies, University of Leeds.
Pizzigallo P and Mayoh J (1989). Manchester Outer Ring Road Portwood to Denton, a Before and After Study. Greater Manchester Transportation Unit.
Purnell S (1985). The Effect ~f Strategic Network Changes on Traffic Flows. PRA Note 4, BP 105, Greater London Council.
Younes B (1990). The Operational Environmental and Economic Impacts of the Rochester Way Relief Road. PhD Thesis, Imperial College, London.
PART III
THE IMPLICATIONS OF INDUCED TRAFFIC
Chapters 6 to 10
Chapters 6, 7 and 8 describe in some detail the Department's current methods of forecasting and appraisal. We point out that, in general, they do not take account of induced traffic. In Chapter 9, we discuss the implications of induced traffic for economic evaluation. Chapter 10 demonstrates, by reference to a number of specific traffic forecasting models, why this gap in the Department's methodology might have serious consequences in some cases.
CHAPTER 6: THE DEPARTMENT'S CURRENT PROCEDURES FOR TRAFFIC FORECASTING
INTRODUCTION
- 6.01 In Chapters 2 and 3, we set out all the potential responses of drivers to new and improved roads. Currently, in the appraisal of most of its schemes, especially those in uncongested areas, the Department takes account of only the reassignment (route choices) of local traffic. In special circumstances, however, other effects which are often regarded as some form of induced traffic, such as the reassignment of longer-distance traffic and trip redistribution (destination choices), are taken into account. In this chapter, we describe, without comment, the Department's current practice in traffic modelling, in order that our advice given in later chapters can be more readily appreciated.
- 6.02 The models for most of the Department's schemes are quite simple, consisting mainly of procedures for assigning a matrix of vehicle trips to a network. More complex models have been developed by agencies other than the Department and used to show the effects on traffic demand of road improvements. These models and the results obtained from them are not covered in this chapter but are described later in our Report, in Chapter 10.
- 6.03 In this chapter, we outline first the overall framework for the Department's traffic modelling practice. We then go on to describe the form that scheme appraisal models generally take, making specific mention of the areas covered. We then set out the principles of the Department's forecasting methodology, followed by notes on the roles of land-use data, the National Road Traffic Forecasts (NRTFs), the National Car Ownership and Trip End Submodels, and the National Forecast Adjustment Factor (NFAF). The way in which scheme forecasts are developed is explained. We outline other models which have been used by the Department for forecasting future traffic. These include multimodal transport demand models of London and Avon, and various regional highway traffic models.
- 6.04 Although there have been few occasions when variations to the normal fixed trip matrix have been modelled for the appraisal of the Department's schemes, we draw attention to these, and to methods for dealing with constraints to traffic growth in urban areas. We conclude the chapter by outlining the Department's special approach to the modelling of traffic for the appraisal of motorway widening schemes.
THE OVERALL FRAMEWORK
- 6.05 Forecasts of the traffic expected to use a new or improved road are required so that the road can be designed and evaluated in operational, safety, economic and environmental terms. The importance of reliable forecasts has already been stressed in Chapter 2.
- 6.06 The Department of Transport's recommended practices for traffic forecasting are set out in the Traffic Appraisal Manual (TAM). This Manual provides guidance on the development of models for producing forecasts of traffic at the scheme level, within the overall framework of the National Road Traffic Forecasts (NRTFs).
6.07 Variants on this theme of models for scheme appraisal within a national framework are employed in special circumstances. In this chapter, we concentrate initially on the straightforward approach to the preparation of traffic forecasts for trunk road appraisal. In later parts of the chapter, we outline some of the more sophisticated approaches which are sometimes used.
SCHEME APPRAISAL MODELS
- 6.08 The guidance set out in the Traffic Appraisal Manual (TAM) on the development of scheme-specific models, often known as 'local models', include the following key themes:
- the study area should be the smallest possible, consistent with including the area of influence of the options being assessed;
- the simplest possible modelling approach should be employed, consistent with the objectives and requirements of the traffic appraisal;
- surveys should be reduced to the minimum possible scale, with maximum use made of existing data;
- the performance of models used in the appraisal process should be validated against data which are independent of those used to calibrate the models; and
- the accuracy of models should be quantified in statistical terms, as far as possible.
THE AREA COVERED BY A SCHEME APPRAISAL MODEL
- 6.09 The study area for a scheme is defined as the area within which traffic flows on any particular road link will be significantly affected by the implementation of the scheme. In defining this area, account is taken of the following factors:
- the density of the existing trunk and principal road network and the location of any competing routes;
- the balance between the value of extra information, which would be available from a wider study area, against the higher costs of data collection and model development that this would entail; and
- the influences on the scheme of changed land-use plans and local authority road proposals.
- 6.10 It is not generally feasible or necessary in the appraisal of trunk roads to model individual trips separately. For convenience, a coarser view is taken, by dividing the study area into 'zones' and treating all the trips originating or terminating in each zone together. Generally speaking, the finer the zoning system the more accurate the assignment process will be, but at the expense of greater computing time and greater difficulty in assembling the land-use data necessary to run the model. The balance between these conflicting aims is a matter for judgment.
6.11 An important consideration will be whether the scheme is an isolated scheme or part of a comprehensive route improvement. In the latter case, it is likely to be more efficient to construct a single model to estimate the reassignment of longer-distance traffic, resulting from the improvement of the route as a whole, and to estimate local traffic growth on each scheme along the route using individual scheme appraisal models.
THE FORM OF SCHEME APPRAISAL MODELS
- 6.12 The selection of the model form most suited to a particular study is a matter for local judgment. The model used directly for the appraisal of trunk road schemes almost invariably represents only road traffic movements. In the interurban context, the occasions when other responses are modelled are few but, in urban areas, other responses, such as redistribution and inter-modal transfer of trips, may sometimes be represented within the overall modelling framework. We describe some of these multimodal modelling processes later in this chapter but, for the moment, we shall concentrate on the single mode approach used for the majority of the Department's schemes.
- 6.13 For schemes to improve single links in a simple road network, the 'model' may simply be a traffic count factored by the expected traffic growth taken from the NRTFs. For most schemes, however, the responses of users will be such that more complex models are usually required.
- 6.14 The most common form of traffic model contains the following elements:
- car driver trip matrices by purpose of travel;
- light and heavy goods vehicle trip matrices;
- a quantitative representation of the links and junctions comprISIng the road network; and
- a procedure for assigning the trips in the various matrices to the road network.
- 6.15 The values for vehicle trips in existing trip matrices are most reliably developed from roadside interview surveys. They may also be derived from surveys by interviewing members of households, but this approach is adopted only rarely nowadays. Surveys which involve matching registration numbers are also used sometimes, although these do not yield the true origins and destinations of trips or give information .about the purposes of trips. Trip matrices can also be synthesised by trip end and gravity distribution models, where local survey data are not available, although this approach is also rarely used nowadays.
6.16 The aim of the assignment procedure is to load the vehicle trips from the matrix on to the road network to reproduce (as closely as possible) existing traffic flows on links. This is done by synthesising likely routes that traffic would take from each zone to all other zones so that, when all zone-to-zone movements are allocated to links, a reasonable representation of the base year traffic flows is obtained. The basis for synthesising these routes in the base year situation is then used for forecasting future traffic flows.
6.17 The assignment procedure will vary according to the complexity of the network and the levels of congestion either occurring now or expected in the future. For the very simple cases, traffic assignments can be carried out manually. For many interurban schemes, simple 'all-or-nothing' techniques are used, often for traffic flows during a 12-hour or 16-hour average weekday. Route choices are determined on the basis of a combination of time and distance or, sometimes, on the basis of time alone.
6.18 In an all-or-nothing assignment, all the trips between a pair of zones are allocated to one route. In more complex networks, drivers' differing perceptions of what is the best route for them are represented by introducing a stochastic or random element to the route choice process. This results in some drivers on journeys between similar origins and destinations choosing different routes through the network and is known therefore, as a 'multi-routeing' assignment procedure.
6.19 All-or-nothing traffic assignments are often the most appropriate for use in scheme appraisal models; particularly where there are few competing routes, where zone sizes are small, and where no single zone is important to the scheme being appraised either generates or attracts a large number of trips. Multi-routeing is more appropriate when the network includes several competing routes and there are several large zones.
6.20 For schemes in congested areas, such as adjacent to or within urban areas, more complex techniques are required, which take account of the effects of congestion on drivers' behaviour. The process, known as capacity-restraint, may use link-based speed/flow relationships (such as those used in COBA) to reflect the reductions in traveltime which will arise from increases in traffic flow. A series of traffic assignments is undertaken, using either all-or-nothing or multi-routeing techniques, with changes in speed being made after each assignment so that the travel times accord with the flows assigned. This iterative process of assignment is continued until stable flows are obtained on all the major links - that is, until the process has converged.
6.21 In congested areas, the most commonly-used assignment processes seek to fulfil Wardrop's First Principle, which states that no driver can reduce his generalised cost of travel by changing routes - that is, all routes used by drivers from any given origin to any given destination will have equal travel costs and routes not used will have greater travel costs. Processes which are based on this Principle are known as 'equilibrium' assignments.
6.22 The most sophisticated form of traffic assignment, used when congestion is prevalent, is called the 'congested assignment model'.
6.23 An important point about all these capacity-restrained traffic assignment techniques is that they are usually carried out for several relatively short periods of the day, so that the variation in congestion throughout the day can be modelled explicitly. Typically, separate models are produced for the morning and evening peak hours, on a weekday, and also for a typical hour between the peaks. In contrast, the simpler forms of model, which do not include capacity-restraint processes, usually apply for much longer periods of the day, such as 12 or 16 or (occasionally) 24 hours.
PRINCIPLES OF FORECASTING TRAFFIC
- 6.24 The Department oversees all the forecasts produced for its schemes. A common approach to forecasting is achieved by using centrally-produced trip end estimates to control the extent of local traffic growth. The centrally-produced trip end forecasts are derived using the National Submodels (described below), which are fed by the National Planning Data Files (also described below). The National Planning Data Files are constrained such that the local projections sum in total to the national projections. The finest zone size at which this can be achieved sensibly is the local authority District level. Using the same assumptions about economic growth as those used in producing the National Road Traffic Forecasts (NRTFs), a national set of trip ends is produced at the local authority District level, which is made compatible with the NRTFs.
- 6.25 In practice, however, to ensure that the local forecasts of vehicular travel are also fully compatible with the NRTFs requires one further factor - the so-called National Forecast Adjustment Factor (NFAF). This is the factor which controls the growth in the total of the trip ends from the National Submodels to that of the overall vehicle-kilometres forecast in the NRTFs. (The NFAF is described in more detail in paragraph 6.42 et seq.)
- 6.26 We now explain the main elements of the Department's forecasting process in greater detail. An important input to the process is what is termed for these purposes the 'landuse' data, which is described next.
THE NATIONAL PLANNING DATA FILES
- 6.27 The National Planning Data Files contain, for each District, the total population and the numbers of households, resident workers, and jobs. These data relate to the base year and to a series of forecast years at five-yearly intervals. The data currently used are based mainly on Office of Population, Censuses and Surveys (OPCS) 1986 mid-year estimates of population and the 1984 Census of Employment, and OPCS/General Registry Office (Scotland) (GRaS) County-level population projections. However, at the time of writing, data from the 1991 Census have been processed and will supersede the population and household data from the earlier sources. Because the data come from a variety sources, the Department has to manipulate the information in order to achieve what it regards as "acceptable levels of uniformity and consistency" (Munro and Smith 1990).
- 6.28 The disaggregation of County-level projections to District-level projections is carried out by the Department of Transport, assuming initially that changes will occur uniformly in all Districts within a County. When the projections were last updated in 1990, all shire Counties in England were invited to comment on the disaggregation of the County control totals to District level. As a result, extensive revisions were made in most such counties. In the absence of single planning authorities in Greater London and the former Metropolitan Counties, the appropriate Regional Offices of the Department of the Environment were consulted about the assumptions for those areas.
6.29 The Department has expressed the view to the Committee that this involvement of the Counties in the process ensures that all local factors "considered relevant by the local
authorities" are taken into account, and furthermore it ensures that the process "reconciles the need for a national data set consistent with local plans and aspirations".
6.30 Projections for areas smaller than Districts (or Boroughs in London) are not prepared centrally, but are considered in the course of the appraisal of individual schemes.
THE NATIONAL ROAD TRAFFIC FORECASTS (NRTFs)
- 6.31 The National Road Traffic Forecasts are for all roads in Great Britain, taken together, and are made for the period over which trunk road schemes are appraised, which is normally more than 30 years, allowing for planning, design and construction (Department of Transport 1989). These forecasts are of vehicle-kilometres expected to be run in each year in the future from a given base year.
- 6.32 The main determinant of traffic growth is considered to be overall real income, or Gross Domestic Product (GDP), with average fuel price exercising a lesser influence. As the future levels of these factors cannot themselves be forecast with precision, the traffic growth forecasts are therefore presented as a range, with the upper and lower bounds based on optimistic and pessimistic combinations of assumptions about growth in GDP and fuel prices. Since the high and low forecasts that result are regarded as equally possible outcomes, scheme appraisal is carried out using both ends of the range.
- 6.33 The forecasts are based on observed 1988 traffic levels, but are rebased periodically. They take account of erstwhile trends in traffic, car ownership and use and road freight traffic, going back nearly 30 years. These forecasts are made for the longer term; they are not necessarily expected to be accurate over short periods.
- 6.34 The forecasts of car traffic combine forecasts of car ownership, car use and population growth (from the National Planning Data Set).
- 6.35 The 1989 forecasts of car ownership are derived by averaging the results of two models. The first one models car ownership at the household level, using cross-sectional and time-series data from the Family Expenditure Survey (FES), and it simultaneously incorporates the effects of income and time. The second model uses cross-sectional data from the 1985-86 National Travel Survey (NTS), to establish the effect of income, and uses the estimate of this effect to establish separately the time period by reference to erstwhile growth in car ownership. The main difference in the forecasts produced by the two models is in their estimate of the time trend. The Department takes the view that it has no way of distinguishing the predictive reliability of the two models and, therefore, an average of the results from the two models is used.
- 6.36 The main determinants of the forecast of car use, in annual kilometres run per car, are real income and fuel price. Values of the relevant elasticities are based on analysis of the 1985-86 National Travel Survey and evidence of the effect of real increases in fuel price in 1974-77 and 1978-82.
- 6.37 The forecasts of heavy goods vehicle (HGV) traffic are derived from relationships between tonne-kilometres and GDP growth, as well as the distribution of that growth
between different sizes of vehicles. The forecasts of light goods vehicle (LGV) traffic are related directly to the growth in GDP.
THE NATIONAL SUBMODELS
- 6.38 The Traffic Appraisal Manual defines two National Submodels, as follows:
- the National Car Ownership Model (NCOM), which estimates car-ownership by District; and
- the National Trip End Model (NTEM), which estimates the numbers of trips by car starting and ending in each District.
- 6.39 The NCOM relates zonal car ownership to gross household income and an accessibility index. The same assumptions about economic growth are used as are input to the NRTFs. The aggregated District-level forecasts are constrained at the national level to equal the car ownership forecasts given by the NRTFs.
- 6.40 The NTEM estimates the numbers of origins and destinations in each District, for each of home-based work, employers' business and other purpose trips, and for non-homebased trips. The inputs to this estimation are the car ownership forecasts produced by the NCOM and the National Planning Data Files.
- 6.41 Like the NRTFs, the District-level trip end forecasts are produced for both low and high economic growth assumptions. They are produced for five-yearly intervals and the latest year for which forecasts are currently available is 2011.
THE NATIONAL FORECAST ADJUSTMENT FACTOR (NFAF)
6.42 We noted in paragraph 6.25 that a factor called the 'National Forecast Adjustment Factor' (NFAF) is required to make the local forecasts compatible with the NRTF. The NFAF is defined as the ratio of (a) the growth in vehicle-kilometres from the NRTF for Great Britain as a whole to (b) the growth in trip ends produced by the NTEM, fed by the National Planning Data Files, summed across all Districts. There is thus a single NFAF for each of low and high growth, for each forecast year. The current NFAFs for a sample of forecast years from a base of 1986, are given in Table 6.1 which follows.
Assumptions underlying future car ownership Year Low growth High growth 1996 1.12 1.14 2001 1.14 1.18 2006 1.16 1.23 2011 1.18 1.27
Table 6.1: The Current National Forecast Adjustment Factors (NFAFs)
6.43 We note that, in recent months, the Department has recalibrated the National Car Ownership and National Trip End Submodels. It has also updated the National Planning Data Files to take account of the 1991 Census data. These new models and land-use data have been used to produce new District-level trip ends. From these new trip end forecasts, and the current (1989) NRTFs, new NFAFs have been calculated. The modifications, combined with rebasing the forecasts to 1991 (instead of 1986), have resulted in the much lower NFAFs shown in Table 6.2 below. At the time of writing, the Department has issued these new models and forecasts in preliminary form for comment.
Table 6.2: The Proposed Updated National Forecast Adjustment Factors (NFAFs)
| | Assumptions | underlying
future
car
ownership | | | | | | |
|------|---------------|------------------------------------------|--|--|--|--|--|--|
| Year | Low
growth | High
growth | | | | | | |
| 2001 | 1.00 | 1.02 | | | | | | |
| 2006 | 1.01 | 1.04 | | | | | | |
| 2011 | 1.02 | 1.06 | | | | | | |
| 2016 | 1.03 | 1.07 | | | | | | |
FORECASTS FOR SCHEME APPRAISAL
- 6.44 All the elements of the Department's forecasting procedures have now been outlined. Figure 6.1 summarises the overall process and, in the following paragraphs, we explain how the forecasting process works.
- 6.45 Scheme-specific forecasts are produced by various methods according to the type of traffic model employed. In all cases, however, already-committed changes to the road network are included in the base (do-minimum) case. It is to this do-minimum network that the proposed scheme is added, to form the relevant do-something network.
- 6.46 In the case of the simplest models which take the form of traffic counts on the links concerned, the growth factors applied are those developed directly from the NRTFs.
- 6.47 For more complex models which contain trip matrices, there are several ways in which forecasts can be produced. For small schemes, the Department favours the use of County-wide factors based on trip end growth, but NRTF growth in the vehiclekilometres run is also used occasionally. For study areas where growth is expected to be fairly homogeneous, a uniform growth factor is often applied, taken as the trip end growth which is output by the NTEM for the study area, multiplied by the NFAF (as defined in paragraph 6.42).
Figure 6.1: The Department's Traffic Forecasting Process for Trunk Road Scheme Appraisal
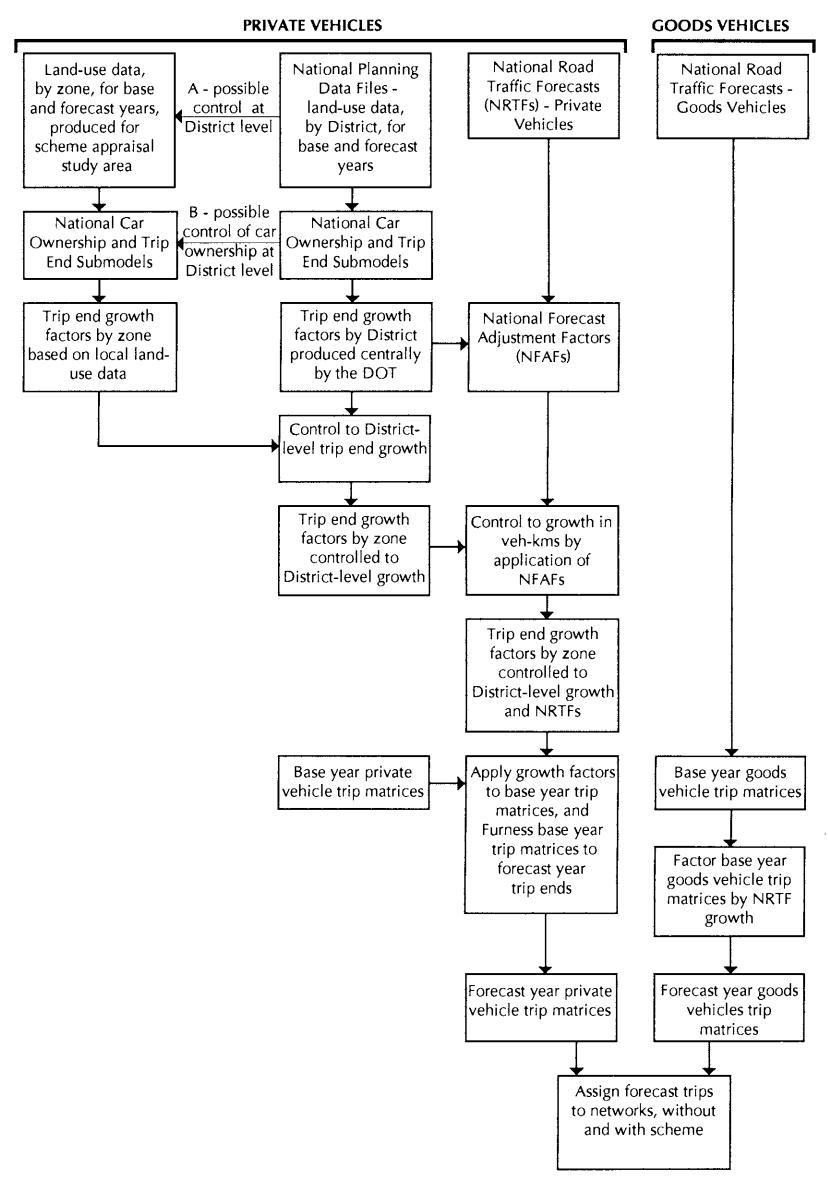
- 6.48 For study areas where differential growth is expected, zonal growth factors are developed, as follows (where zones are normally subdivisions of Districts). The number of non-car-owning households in the base year is fed into the NCOM, to give an estimate of the average household income in each zone. To this is applied the NRTF assumptions of low and high GDP growth, to give future year incomes. These are then fed back into the NCOM, to yield forecasts of car ownership by zone. These zonal car ownership forecasts are then fed into the NTEM, along with the corresponding zonal forecasts of the land-use data (population, households, resident workers, and jobs), to yield forecasts of trip ends by zone. The same process is used to synthesise trip ends by zone for the base year. For each zone, the ratio of the forecast year trip ends to the base year trip ends is then taken, to produce zonal trip end growth factors. These growth factors are then controlled to the growth forecast centrally, at District level, and NFAFs (as defined in paragraph 6.42) are applied. The resulting growth factors are then applied to the trip ends in the calibrated base year trip matrix, to produce the final forecast of future year trip ends. The base year trip matrices can then be Furnessed (or factored) to the forecast year trip ends, to yield the final trip matrices. This process is not often used, however.
- 6.49 This process enables account to be taken of local expectations of changes in the pattern of land-use within Districts, while maintaining control over the total numbers of trips forecast at District level. In cases where complementary land-use changes are expected in adjacent Districts, the central controls can be applied to the two Districts combined.
- 6.50 We note here that the Department's advice, as given in TAM, is that the NFAF should be applied, whether or not redistribution is carried out through a Furness procedure described above. The NFAF is designed to correct the trip end forecasts for the increased use of cars. The Furness redistribution process models the increases in trip lengths, which arise from activities becoming more dispersed. To some extent, therefore, the NFAF duplicates the effects of the redistribution process. If a capacity-restraint procedure is used in the assignment then, as congestion increases, so trips will tend to increase in length with more circuitous routes being chosen to avoid the more congested parts of the network. This capacity-restraint process also therefore tends to duplicate the effects included in the NFAF. We shall return to the issue of the NFAF later in our report.
OTHER MODELS USED FOR FORECASTING
6.51 We are aware that other models have played some role in trunk road appraisal in certain circumstances. We discuss briefly here the production of forecasts in London using a relatively conventional multi-stage model, in Bristol using a strategic transport demand model, and the general use of regional highway traffic models for the estimation of long-distance traffic diversions. We also describe the occasions where the trip matrix has been allowed to vary in trunk road appraisals, methods of limiting growth forecasts in local scheme appraisals in urban areas, and the special case of models applied to motorway widening schemes.
London
- 6.52 The London Transportation Studies (LTS) model is a relatively conventional multi-stage model, with the stages being those of forecasting car ownership and trip ends, primary modal split, distribution, road traffic assignment, and public transport modal split and assignment. The car ownership forecasts are produced using NRTF assumptions about economic growth, and are constrained to match the District-level forecasts produced centrally by the Department. However, this is the limit of strict control to central forecasts, since (in the LTS model) neither land-use data nor private vehicle trip ends are constrained. The LTS model does contain feedbacks between the road traffic assignment stage and the distribution and primary modal split stages, thereby yielding forecasts of growth in private vehicle trips which take account of supply side constraints.
- 6.53 The objectives of the LTS model are to provide a consistent basis for analysing the effects of large infrastructure proposals, and to provide a source of data for more specialised models. The model is based on 1981 survey data, although the Department is planning to produce an updated version based on the 1991 London Area Transport Survey (LATS) data.
- 6.54 The LTS model has been used in several ways in trunk road scheme appraisals in London. In the case of the East London River Crossing, growth factors for vehicle trips have been derived from the LTS model and employed in a local model containing trip distribution and assignment stages. For schemes on the A13, matrix growth factors derived from the LTS model have been applied to local congested assignment models.
Avon
6.55 In Bristol, a strategic transport demand model called START has been used to derive growth factors. The START model can reflect the effects of changes in the supply of transport on travellers' choice of trip frequency, time of day, mode, destination, and route. The model operates at a very coarse level of zoning and with only a notional network. However, the model does reflect the effects of limits to transport supply in the production of its demand forecasts. In deriving the growth factors for trunk road appraisal, NRTF assumptions about economic growth have been used, and car ownership levels and land-use data forecasts were constrained at the District level to centrally-produced forecasts. The resulting growth factors have been applied to a capacity-restrained assignment model of the road system around Bristol, to yield traffic forecasts for the appraisal of motorway widening schemes.
REGIONAL HIGHWAY TRAFFIC MODELS
6.56 The Department has a number of regional highway traffic models. In the main, these are simply large-scale road traffic assignment models. The Department has drawn our attention to the fact that the trip data in these models is of variable quality and, in some cases, is now quite old. However, these models are capable of providing estimates of the diversion of long-distance traffic, which can then be input to local scheme appraisal models for individual schemes which (taken together) make up a longer route improvement or development corridor.
VARIABLE TRIP MATRIX APPRAISAL OF TRUNK ROAD SCHEMES
6.57 We understand that, to date, the trip matrix has been allowed to vary in the main appraisals of only two trunk road schemes. These two schemes are the East London River Crossing in London and the A55 in North Wales. In both cases, the schemes being evaluated were new schemes designed to overcome substantial barriers to existing movement and, in both cases, the effects of trip redistribution were taken into account. The sensitivity of the operational evaluations to variations in the trip matrices have, however, been tested in a number of appraisals, especially in the West Midlands where the effects of redistribution have been assessed.
CONSTRAINTS ON TRAFFIC GROWTH IN URBAN AREAS
- 6.58 Constraints on traffic growth are sometimes modelled in the appraisal of the Department's schemes in or near to urban areas, through a number of techniques applied at the scheme level. These techniques include simple common sense adjustments, such as controlling the demands for parking in central areas to the parking supply assumed to be available in the forecast year, and reducing the trip matrices assigned in the peak hours, to reflect typical spreading of the peak periods as congestion rises.
- 6.59 In addition, a number of techniques are used to constrain the growth in the trip matrix to reflect the limits of the capacity of the road system. These methods range from very simple cut-offs applied when growth exceeds a certain level, to quite sophisticated methods involving the use of elasticities of demand. While we are aware that some of these methods have been used in the appraisal of trunk road schemes, we cannot be sure which of them have been used and how frequently.
- 6.60 Our understanding is that any such constraints on growth in the trip matrices have been applied to the do-minimum case, and that the same trip matrix has been used in the with-scheme case as well. Thus, the trip matrix has not been allowed to expand in response to the extra capacity provided by the scheme being appraised.
MODELS USED FOR MOTORWAY WIDENING SCHEMES
- 6.61 The appraisal of motorway widening schemes, while generally following the Department's standard approach, poses a number of special problems.
- 6.62 An existing stretch of motorway subject to congestion will discourage traffic using alternative parallel routes from transferring to the motorway. By widening that stretch, some of the longer-distance traffic may be encouraged to divert. To estimate these effects, use is made of a regional traffic model (if available), or manual analyses of trip data, where no suitable regional model exists. The Department has advised the Committee that "generally, there is little traffic on parallel routes within the motorway corridors which can divert, although traffic could divert from alternative strategic routes".
6.63 Conditions during the peak periods on congested motorways can be crucial for the operational and economic evaluations. In these circumstances, traffic conditions in peak periods is usually modelled explicitly, but within the framework of an all-day model.
6.64 Flows on motorways in congested areas can be affected appreciably by the lack of capacity of the non-motorway roads providing access to the motorway system. Where this is likely to occur, then traffic assignment techniques are employed which meter the rate at which traffic can enter the motorways, by taking account of the capacity of the access roads.
6.65 The Department recognises that new or improved motorways may stimulate new development within the motorway corridor, and that the resulting increase in activity could affect both the main line traffic flows and turning movements at junctions. However, the Department has advised the Committee that, while the Department itself cannot anticipate where development will occur, it does take account of locations where planners consider that development is likely take place. To the extent that planners know that new or improved roads are likely, their plans should reflect their existence. Where possible, account is taken of such developments in the traffic forecasts, although the overall District-level controls on traffic growth are not relaxed.
6.66 We understand that the Department does, where it judges appropriate, use procedures which will allow the trip matrix to vary between the do-minimum and with-scheme cases, for the purposes of operational appraisal. This is in recognition of the fact that some motorways are currently congested, or may be congested in the forecast year dominimum situation, and that (consequently) some trip suppression or induction may occur. Widening congested sections of motorway will enable more traffic to flow than could use the motorway as it stands and this phenomenon clearly underscores the need for a variable matrix approach to traffic appraisal. Nevertheless, the Department has told the Committee that "modelling the phenomenon to enable an adequate economic appraisal poses some major difficulties".
REFERENCES
Department of Transport. Traffic Appraisal Manual. Revisions to 1991. Highways Economics and Traffic Appraisal Division.
Department of Transport. COBA 9 Manual. Revisions to 15 November 1993. Highways Economics and Traffic Appraisal Division.
Department of Transport (1989). National Road Traffic Forecasts (Great Britain) 1989. HMSO.
Munro A and Smith C (1990). Traffic Forecasting: the Contribution of Population Projections. Population Projections: Trends, Methods and Uses. OPCS Occasional Paper 38.
CHAPTER 7: THE ROLE OF TRAFFIC FORECASTS IN THE DEPARTMENT'S DESIGN AND ASSESSMENT PROCEDURES
INTRODUCTION
7.01 Traffic flows are used in a variety of forms at various stages in the process of designing and assessing a trunk road scheme, including the selection of standards, geometric design, pavement design, environmental appraisal, and safety and economic evaluations. In this chapter, we outline the use made of traffic flows in the design and assessment processes, adding comments on the likely sensitivity of the processes to errors and inaccuracies in the traffic forecasts.
SELECTION OF GEOMETRIC STANDARD
- 7.02 The first use made of forecast traffic flows is in the selection of the most appropriate standard for the new or improved road. Guidance for this process is set out in TD20/85. Forecasts are required for the 'design' year. This is normally taken as 15 years after the assumed opening year of the scheme, and forecasts are usually produced for the design year directly by the traffic model.
- 7.03 Interurban traffic models are usually specified to produce traffic flows for a 12, 16 or 24-hour period on an average weekday in a 'neutral' month (April, May, June, September, or October). Models of urban areas often produce flows for the morning and evening peak hours, and for an 'average' interpeak hour, again on an average weekday in a neutral month. Where periods of shorter than 24 hours have been modelled, then the flows output by the traffic model have to be expanded to represent the full 24-hour period, and the factors for this expansion would normally be derived from local automatic traffic count data. A further factor is then developed, also from local count data, which converts the average neutral month weekday traffic to Average Annual Daily Traffic (AADT). Both low and high growth AADT flows are calculated.
7.04 The Department's Standard TD20/85 specifies ranges of flows for each of the various design standards for highway geometry which can be selected, from single carriageways through to dual four-lane motorways. The procedure for assessing the appropriate carriageway widths is then as follows:
- select for local assessment those carriageway widths within whose flow range either or both of the low and high design year flows fall;
- consider any local factors which suggest that different widths outside those given by the guidelines should be assessed, such as unusually high or low costs, severe environmental effects, or major network changes in the evaluation period;
- carry out COBA, and possibly QUADRO, runs to determine the Net Present Values (NPVs) for each width; and
- enter the NPVs and all other relevant factors into an assessment framework and select the optimal geometric standard.
7.05 This process does not justify the standard selected; it merely indicates which standard is likely to be justified. The exercise is a broad-brush one, designed to avoid waste of effort in designing and assessing the wrong kind of scheme for any particular circumstance. In our judgment, errors in the traffic forecasts would have to be very substantial for misleading results to be obtained from this stage of the scheme design and appraisal process. Following selection of the likely standard, further design work is required, followed by further traffic modelling and economic appraisal, in order to determine whether or not the scheme is good value for money.
7.06 The information given in TD20/85 should not be taken as an indication of the ultimate traffic flows which can be carried by different carriageway widths. The design capacity of an interurban road depends on the design speed which can be accepted, with higher flows being permissible at lower speeds. In deciding upon the level of service which a road is designed to provide, account is taken of the extent to which traffic may divert to other routes, safety needs, the case for local widening on gradients (especially on single carriageways), and the effects of future highway maintenance activities.
TRAFFIC FLOWS FOR GEOMETRIC DESIGN
- 7.07 The basic unit of flow for geometric design purposes is the 24-hour AADT. Factors are applied to the AADT in the design year (15 years after the year of opening) to produce estimates of peak flows which are used for various features of the design, such as junctions, as defined in the Department's Standard TD9/81. The designer usually seeks to accommodate high growth traffic flows, as these make greater demands on the geometry of the highway than the low growth flows.
- 7.08 In the case of interurban schemes, the traffic model will usually produce flows for a 12, 16 or 24-hour period, from which the AADT and appropriate highest hours of flow can be derived. In urban areas, the traffic model may yield peak hour traffic flows directly. These can be aggregated to yield AADT flows and factored to represent the appropriate highest hour of flow in the year.
- 7.09 Some idea of the sensitivity of the design of the road geometry to errors and inaccuracies in the traffic forecasts can be gained from Figure 7.1. Clearly, in some cases, a change in the forecasts could necessitate a change to the design, while in other cases, where the forecast flows lie well within the capacity of the scheme, significant errors in the traffic forecasts may be able to be accommodated without affecting the design.
TRAFFIC FLOWS FOR PAVEMENT DESIGN
7.10 The Department's procedures for the design of road pavements are contained in Volume 7 of the Design Manual for Roads and Bridges. The traffic estimate required is the cumulative number of millions of standard axles that will pass over a pavement during its design life. The basis for deriving this estimate is usually the AADT. Flows for each year of the scheme's life can be interpolated and extrapolated from traffic forecasts for the year of opening and the design year, which, at 15 years from the year of opening, is half way through the usual scheme life. The proportion of the traffic flow which is heavy vehicles is an essential requirement of this part of the scheme design.
Figure 7.1: The Relationship Between Annual Average Daily Traffic Flow in the Design Year and the Road Standard Selected as the Starting Point for Assessment
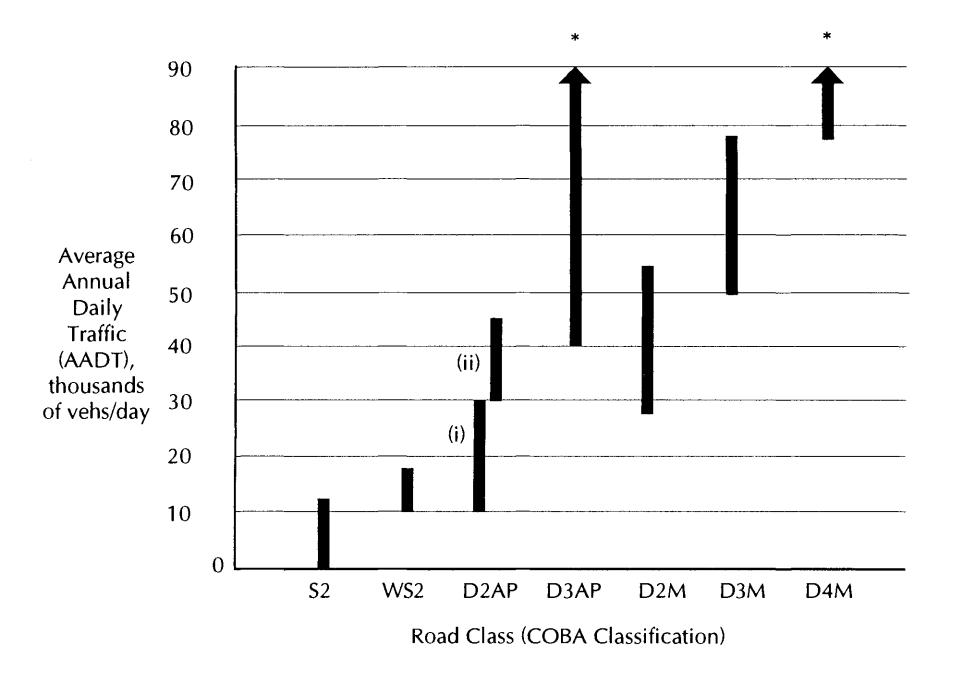
Key
52 Normal single carriageway W52 Wide single carriageway D2AP Dual 2 lane all-purpose carriageway
- (i) Priority junctions, restricted access, generally at-grade roundabouts
- (ii) Restricted access, left-turns only, no gaps in central reserve,general'y gradeseparated intersections
D3AP Dual 3 lane all-purpose carriageway D2M Dual 2 lane motorway D3M Dual 3 lane motorway D4M Dual 4 lane motorway
*TD20/85, the source for this figure, gives no upper limits to the flow ranges for these road classes
- 7.11 The Design Manual requires that pavements should have a design life of 40 years. For flexible pavements, this is based on a staged construction, with major maintenance in the form of overlays being required after 20 years. As well as providing the required life, this approach is said to minimise whole-life costs.
- 7.12 The pavement design process assumes a 2% per annum growth for heavy vehicle traffic throughout the design life, and this, together with a rounding up of the pavement thickness to the nearest 10 mm, is intended to give a conservative design. The 20/0 per annum growth roughly equates to the national high growth forecasts of commercial vehicle traffic. If this high growth were to be exceeded or additional traffic induced, then the pavement would be underdesigned. For example, a 150/0 increase in design traffic loading from 1,000 to 1,150 heavy vehicles per day at opening would require an increase in the design thickness of flexible surfacing and road base of 10 mm.
- 7.13 It is important that both traffic flows and pavement performance are monitored after a new road is constructed. If it is found that the assumed growth rates of vehicles or standard axles are being exceeded, the design can be re-assessed and the pavement strengthened, for example, by bringing forward the second stage overlay. It would, therefore, be possible to achieve a 40-year design life, but more extensive maintenance is likely to be required at an earlier date, with even a third stage overlay possibly being required. Thus, although the position is recoverable, the provision of an additional overlay on structures could require them, in turn, to be strengthened or reconstructed. Significant underestimates of future traffic can have serious cost implications.
TRAFFIC FLOWS FOR ENVIRONMENTAL APPRAISAL
- 7.14 Of the environmental issues included in Volume 11 of the Department's Design Manual for Roads and Bridges, the assessments of the effects on cultural heritage, ecology and nature conservation, landscape, land use, blight, water quality and drainage, geology and soils, and policies and plans are not primarily dependent on the forecast traffic flows. The issues which are related to the forecast traffic flows are air quality; noise and vibration; effects on pedestrians, cyclists and community severance; and driver stress.
- 7.15 Normally, environmental appraisal is based on expected high growth conditions in the design year (15 years after opening). In the case of air quality, the estimates of emission levels relate to the 24-hour period, while noise calculations are generally based on 18 hour traffic flows. Important factors are the proportion of the total flow which is heavy goods vehicles and the speed of traffic. Wh~re conditions vary appreciably during the day, then separate calculations may be undertaken for different periods of the day. This could apply to air quality, and to the effects on pedestrians and cyclists. Driver stress is usually only assessed on the basis of average hourly flows and speeds.
- 7.16 Air quality is affected in two different ways by a road scheme. First, there might be localised changes, either improvements or reductions in air quality, along all or part of a scheme. Secondly, there might be significant changes in the overall quantity of emissions from traffic.
- 7.17 The major exhaust pollutants from internal combustion engines are: carbon monoxide, oxides of nitrogen, hydrocarbons, particulates, lead, and carbon dioxide. The net effects
of a road scheme on levels of each of these pollutants is complex. It is true that traffic flow is a key determinant of the overall levels of pollutants, but other factors intervene. Trunk road schemes are directed at reducing congestion and stop-start operations, and to that extent will reduce carbon dioxide and other emissions on a per vehicle-kilometre basis. On the other hand, where speeds increase above a certain point by road improvements, or where trip distances increase (for example, by traffic diverting to a bypass), some emissions may rise.
- 7.18 Any increase in pollutant levels will contribute to the deterioration in overall air quality. Hence, any errors and inaccuracies in the traffic forecasts - of both flows and speeds will affect the accuracy of the forecast overall impacts on air quality. However, for carbon monoxide and oxides of nitrogen, acceptable thresholds have been defined. Clearly, in some circumstances, the accuracy of the traffic forecasts will be crucial to the question of whether the thresholds will be exceeded. In other instances, the emission levels will be so far either above or below the threshold that the errors or inaccuracies in the traffic forecasts will have no material effect on whether or not the thresholds are exceeded.
- 7.19 Traffic noise is related to traffic flow, the proportion of heavy vehicles, traffic speed, as well as to the road configuration, the type of road surface, the intervening ground cover between the source and the listener, screening, the angle of view of the traffic, and reflections from facades. Keeping all other factors constant, increases or decreases in the traffic flow and the proportion of heavy vehicles will cause corresponding increases or decreases in noise levels. However, there are limits to the change in noise level which is perceptible to the average person. For example, halving or doubling the flow of traffic would lead to a corresponding reduction or increase in noise levels of about 3 dB(A), which is the smallest change which can be perceived by the average human-being. Notwithstanding this general rule, small changes in traffic flow can have important consequences for the noise appraisal where thresholds are crossed. For example, a small increase in the forecast traffic flow could result in a noise level changing by a small amount from just below to just above 68 db(A), thereby enabling the affected property owner to qualify for compensation.
- 7.20 Vibrations produced by traffic can be transmitted through the air or the ground, and can affect buildings or disturb occupiers. Ground-borne vibrations are produced by the movement of rolling wheels on the road surface and can be perceptible in nearby buildings if heavy vehicles pass over irregularities in the road surface. There is no evidence that such vibrations cause damage to buildings, although it can be a nuisance to residents. This should not be an issue in the case of a new road. Air-borne vibrations from low frequency sound emitted by vehicle engines and exhausts can be a source of annoyance and can occur to some extent along any type of road. Research has shown that noise levels can be taken as a good indicator of this type of vibration nuisance. There is little evidence that noise levels below 60 dB(A) produce significant vibration nuisance but, at 75 dB(A), appreciable nuisance may be experienced by 50% of people. Thus, the effects of errors or inaccuracies in the traffic forecasts will vary according to the overall level of traffic.
- 7.21 The most obvious effects on pedestrians and cyclists occur through a new road either limiting the number of places at which they may cross or obliging them to deviate from
the routes they would use if the new road were not built. But the flow of traffic may also have a direct effect on pedestrians or cyclists by causing delays to those wishing to cross a new road. Errors and inaccuracies in the traffic forecasts will have a corresponding effect on these delays to pedestrians and cyclists. Where changes in delays of this kind are significant, then they would normally be valued using the standard values of time and included in the economic evaluation. However, such changes may also be manifest in terms of increased community severance.
7.22 The assessment of driver stress is related to traffic flow and speed, and varies by type of road. The Design Manual classifies driver stress simply as low, moderate or high. Thus, the effects of errors and inaccuracies in the traffic forecasts, both flow and speed, will be marked in those cases where a condition changes category, but of no consequence where no change in category results.
TRAFFIC FLOWS FOR SAFETY AND ECONOMIC EVALUATIONS
- 7.23 The economic evaluation performed by COBA requires both low and high growth flows for either a 12 or 16-hour period, for an average weekday in any month, or the Annual Average Hourly Traffic (AAHT). The program factors the input flows to represent the flows in the total hours in one year. The COBA calculations include estimations of the user benefits and disbenefits arising from changes in travel times, vehicle operating costs, and accidents.
- 7.24 If peak and interpeak hour models have been used, then it is necessary to develop factors to apply to the individual hourly flows so that, when added together, they represent a 12-hour period.
- 7.25 The COBA program takes traffic flows from the traffic model, for both the dominimum and with-scheme cases, and calculates the corresponding travel times. By contrast, the URECA program, which is designed to perform COBA-like calculations using data output from a congested assignment model, takes both the traffic flows and travel times from the traffic model.
- 7.26 QUADRO, which is used to assess the delays to traffic caused by roadworks, uses the low and high growth flows output by the traffic model, converted to represent the Maintenance Season Average Daily Traffic (MSADT).
- 7.27 The economic evaluation is central to the Department's appraisal of trunk road schemes, and is the subject of the next chapter.
REFERENCES
Department of Transport. COBA 9 Manual. Revisions up to 15 November 1993. Highways Economics and Traffic Appraisal Division.
Department of Transport. QUADRO 2 Manual. Revisions up to 15 November 1993. Highways Economics and Traffic Appraisal Divisioll.
Department of Transport. URECA Manual. 1990 version. Highways Economics and Traffic Appraisal Division.
Department of Transport (1981). Road Layout and Geometry: Highway Link Design. Departmental Standard TD 9/81.
Department of Transport (1985). Traffic Flows and Carriageway Width Assessment. Departmental Standard TD 20/85.
Department of Transport, Scottish Office Industry Department, Welsh Office, Department of the Environment Northern Ireland. Design Manual for Roads and Bridges Volume 7: Pavement Design and Maintenance.
Department of Transport, Scottish Office Industry Department, Welsh Office, Department of the Environment Northern Ireland. Design Manual for Roads and Bridges Volume 11: Environmental Assessment.
CHAPTER 8: THE DEPARTMENT'S APPROACH TO THE ECONOMIC EVALUATION OF SCHEMES
INTRODUCTION
- 8.01 The Department's approach to the economic evaluation of trunk road schemes is set out in the Introduction to the COBA 9 Manual and the principles are discussed in Chapter 1. In order to comment on the Department's appraisal procedures, it is first necessary to set them out clearly. This is the purpose of this chapter.
- 8.02 The Department uses a form of cost/benefit analysis for the appraisal of trunk road schemes. The costs of road schemes are compared with the resulting benefits derived by road users, which are expressed in monetary terms. Cost/benefit analysis is seen as a tool which helps to promote the efficient use of scarce investment resources.
"All governments are concerned to secure value for money from investment expenditure, and to find tools which measure value for money objectively between programmes, in priorities within them, and in relation to individual projects. Financial profitability yardsticks cannot generally be applied to roads investments. .. and cost benefit analysis was developed as a technique for assessing 'value for money' in precisely such circumstances. It is, however, a partial technique, economic appraisal of the sort embodied in COBA ... does not purport to measure value for money over the whole range of costs and benefits including those broadly classified as environmental. The limited but important role of economic appraisal has been spelt out in successive White Papers on roads ... This prominence accorded to economic objectives confirms the weight placed on economic appraisal as the primary test of 'value for money' . .. [but] COBA (and economic appraisal) must be seen as only one element in the appraisal process, to be used along with assessments of environmental and other considerations. " (COBA 9 Manual - Introduction).
8.03 In policy terms, it is fair to say that the Government's first objective for the Road Programme is to promote economic growth, and that cost/benefit analysis, in the form of the COBA 9 program specifically, is the value for money test which is applied to assess the contribution of schemes to that objective. The Department has told SACTRA that it considers the adequacy and robustness of the test to be extremely important matters for national roads policy.
THE ROLE OF ECONOMIC EVALUATION
8.04 Before proceeding further, therefore, it is important to understand the role which COBA plays in the appraisal process. First of all, COBA is intended for use at a decentralised level, by the Department's Regional Offices and its consultants. For that reason, COBA has an important control function. By requiring the use of a standard procedure, the Department effectively ensures that a very large number of appraisal parameters are treated in like manner by the many designers and analysts involved up and down the country. By limiting appraisers' discretion, the Department seeks to ensure that the value for money test is applied consistently across all schemes.
- 8.05 Secondly, value for money tests should be applied throughout the different stages of scheme preparation. According to the COBA Manual, they should be used to contribute to the following decisions:
- "a) the assessment of the need for a corridor improvement (either online or new route) prior to entry to the Department's Road Programme;
- b) the priority to be accorded to individual schemes by comparison with those from other schemes in the region or the country;
- c) the optimal timing of the scheme, including consideration of the merits of staged construction and timing in relation to competing or complementary schemes in the network;
- d) the selection of a short list of potentially attractive solutions to present at Public Consultation;
- e) the selection of the preferred option to recommend to the Secretary of State after Public Consultation;
- f) the selection of the optimal link design standards for the options under consideration;
- g) the selection of the optimal junction types for options under consideration. " (COBA 9 Manual - Introduction).
- 8.06 Clearly, the value for money tests will be simpler and more broad brush at the early stages than at the later ones. The important point is that the Department's policy is to use value for money tests in a wide range of appraisal and design contexts and throughout the preparation of trunk road schemes. Thus, appraisal should be viewed as a process rather than as a set piece which is reached at a particular point (usually towards the end).
PRINCIPLES OF ECONOMIC EVALUATION
- 8.07 The aim of cost/benefit analysis in general, and COBA in particular, is to enable a comparison to be made between the capital costs of investments and the benefits which accrue over the life of the project. The general approach used is to assess the value of the resources committed to the provision of the project against the value of the benefits which result. An important feature of cost/benefit analysis, as practised in the UK, is that the valuation of these benefits should have an adequate empirical and/or theoretical basis. Thus, the values which the Department assigns to travel time savings are based on the findings of research studies designed to elicit the willingness of travellers to pay for travel time savings.
- 8.08 The basic proposition in the estimation of benefits to travellers is that road travel is a good which is subject to the same economic laws as other goods and services in the economy. Therefore, we expect on a priori grounds that the volume of demand for travel at a given point in time, and given external factors such as the level of income, the pattern of consumer preferences and the prices of related goods, should be at least somewhat responsive to the generalised (time plus money) cost of travel. If travel becomes cheaper, people and firms can respond, rearranging their budgets so as to take advantage of the lower cost.
- 8.09 The COBA 9 Manual acknowledges this. In a passage highly relevant to our Report, it is noted that:
"When a road improvement takes place, several changes in trip patterns are possible in principle:
reassignment: traffic travelling from A to B may re-assign to a new route
redistribution: traffic may change its destination and go to C instead of B
generation: trips may be made when previously travel did not take
place
modal split: trips to the same destination may be made by a different
mode of transport
time of day: trips may be made at different time of day. "
(COBA 9 Manual para 1.3.1.).
The term 'generation' is used in the COBA Manual in the same sense as our term 'induced trips' (see Chapter 2).
- 8.10 In addition, one potentially important response must be mentioned. This is the possibility that a fall in travel costs will stimulate changes in the location of activities (housing, shops, offices, factories, warehouses etc), which in turn will create more vehicle-kilometres on the network than if the pattern of land-use had remained fixed.
- 8.11 In principle, then, travellers may take advantage of a fall in costs of travel between A and B in very many different ways. If demand is responsive in at least some of those ways, then the benefits of a fall in the cost of travel are as shown in Figure 8.1.
Figure 8.1: The Demand for Trip-Making in Relation to its Cost
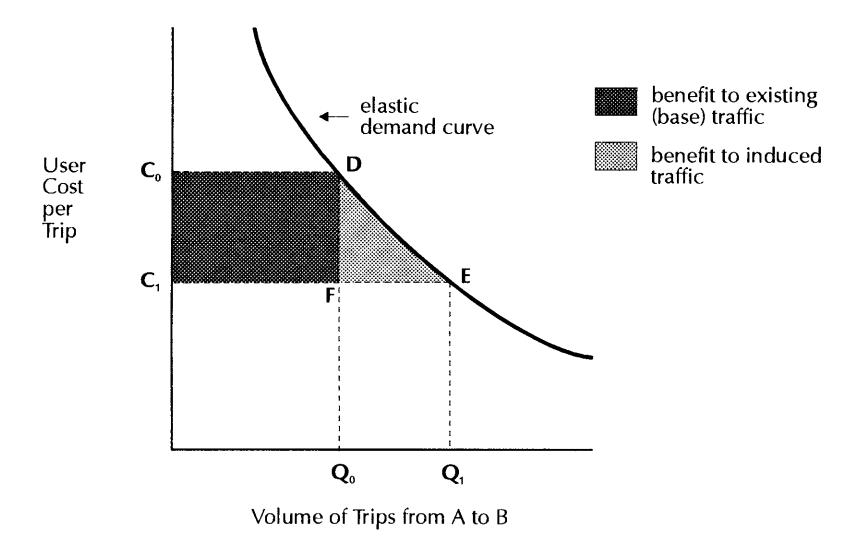
8.12 Figure 8.1 shows that the volume of traffic willing to travel between orIgIn A and destination B at a cost per trip of Co is Qo. When this cost falls to Cl, the volume increases to Ql. The aggregate benefit to travellers between A and B due to the fall in cost per trip is CoDECl. This benefit may be considered in its two components. First, there are the Qo trips which were being made at a cost per trip of Co. With the improvement, the cost per trip falls to Cl. These Qo trips each receives a benefit which is equal to the full cost difference (CO-Cl) without and with the scheme. Secondly, there are the trips which are induced by the fall in costs. These receive a benefit equal to the difference between the users' willingness to pay for these trips and the costs the users incur. This difference is the area DEF in Figure 8.1. Provided the cost change is not too large, it is reasonable to assume the demand curve is linear over the relevant range. In that case, the average induced trip receives a benefit equal to half the cost change. Hence, the total user benefits may be written as
$$(C_0 - C_1) Q_0 + \frac{1}{2} (C_0 - C_1) (Q_1 - Q_0) = \frac{1}{2} (C_0 - C_1) (Q_0 + Q_1)$$
This is the so-called 'rule of a half formula. It can be extended to deal with complex networks, more than one mode, and many origin-destination pairs. It was the basic evaluation tool used in the land-use/transportation studies of the 1970s. It should be noted that the total user benefit is not the same as the change in the total user cost due to travel. In Figure 8.1, when the user cost per trip falls from Co to Cl, yielding benefits of CoDECb the total user cost due to travel may either rise or fall depending on the elasticity of demand.
- 8.13 For almost all trunk road scheme appraisals, however, the Department adopts a simplifying assumption, namely that the volume and pattern of traffic is unaffected by the scheme; that is, that there is no induced traffic. This is known as the fixed trip matrix assumption. In terms of the possible responses listed above, the only one which is allowed for is reassignment of traffic to take advantage of lower cost routes between given origins and destinations. The acceptability of the fixed trip matrix assumption goes to the heart of our terms of reference.
- 8.14 With the fixed demand assumption, unlike the variable demand case considered above, the user benefits of an improvement are simply equal to the change in user (time plus operating) costs. In Figure 8.2, Co is the user cost per trip without the improvement, Cl is the user cost per trip with the improvement in place. The user benefit is therefore simply the cost difference per trip (CO-Cl) multiplied by the fixed volume of trips (Qo).
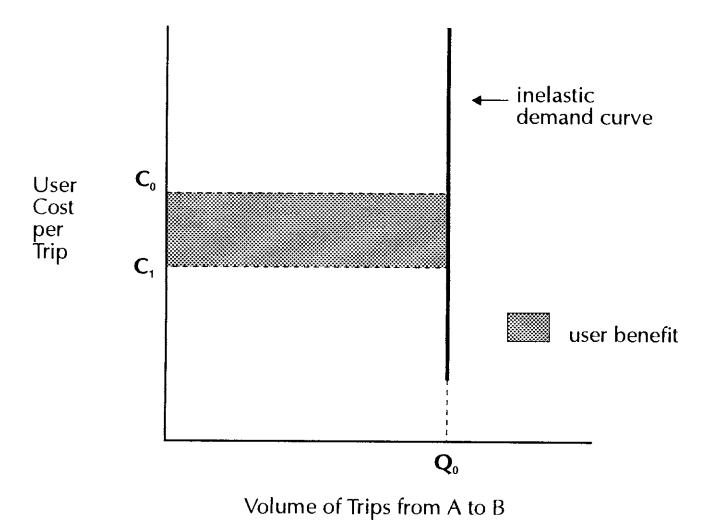
Figure 8.2: The Demand for Trip-Making Assumed Independent of its Cost
- 8.15 The fixed matrix assumption is a convenient operational procedure for two reasons. First, it is possible to estimate the user benefits directly by calculating the user costs, link by link, in the do-something and do-minimum cases and subtracting one from the other. This enables the analyst to examine where on the network the benefits are accruing, and to use professional judgment to assess the scheme economics in the light of that. Secondly, and an important practical point, all arguments about the relevant elasticity or shape of the demand curve are short-circuited.
- 8.16 Before proceeding further, we need to consider the supply side, or road network capacity, more explicitly. For illustrative purposes, we take the case of a single origin A and destination B, served by a single route. The results are, however, generalisable to many origin-destination pairs and many routes. The costs which users incur when they make journeys are principally their time and the operating costs of their vehicles. The costs of travel between A and B depends on the distance, the physical characteristics of the route, and the density of traffic encountered. The last two of these are encapsulated in the speed/flow relationship (Figure 8.3).
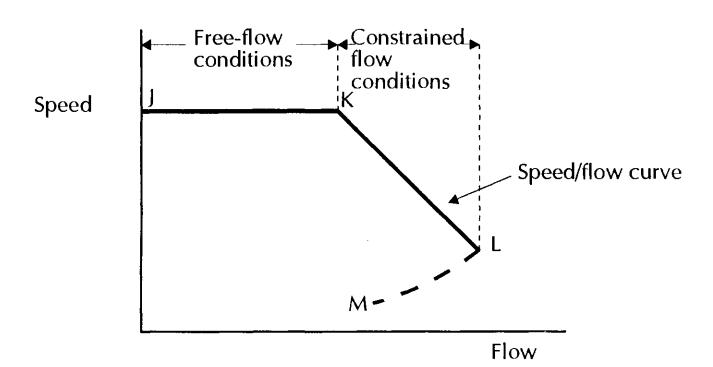
Figure 8.3: The Speed/Flow/Cost Relationship
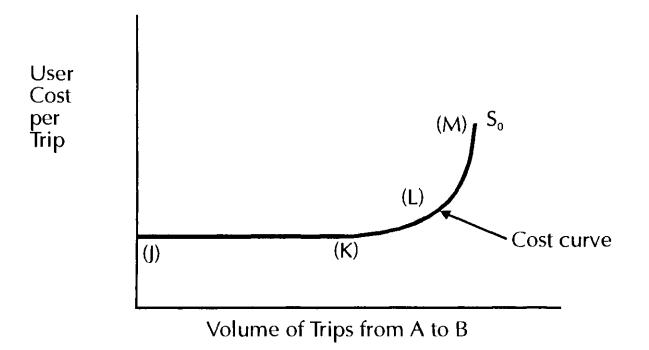
- 8.17 A simple speed/flow relationship consists of two components a free-flow speed, set by the physical characteristics of the road and independent of the volume of traffic. This applies over the flow range JK in Figure 8.3 where K is the maximum free flow. Higher flows than K can be accommodated but at the expense of reduced speeds - segment KL on the curve. Over this segment, individual vehicle speeds are constrained by the presence of other vehicles, although the flow is still smooth and uninterrupted. This segment KL of the speed/flow relationship is referred to, therefore, as constrained flow, with some delays being imposed on vehicle users as traffic volumes rise.
8.18 In reality, there is a third segment, more difficult to define, which occurs when traffic flow temporarily exceeds capacity. The consequence of this happening is an upset in the stability of the flow - sometimes characterised by shock-waves travelling back through the traffic stream - leading to disruptions of the smooth flow. If the flow is saturated (that is, beyond about 95% of capacity), queues will form. Over this segment LM, with unstable congested conditions, both speeds and flows will fall. In this situation, with frequent stops and starts and long queues forming, delays accumulate rapidly.
8.19 The simplified speed/flow curve (JKL) can, with knowledge of the values of time and the relationship between speed and operating costs, be mapped on to a cost curve. This curve, labelled So in the lower half of Figure 8.3, tells us the level of user costs per trip at each possible volume of traffic. In the free-flow region JK, the curve is horizontal because speeds, times and operating costs per trip do not vary with traffic volume. In the constrained flow region KL, the cost per trip increases with volume because additional volumes are associated with lower speeds and longer journey times. In the unstable congested flow region LM, very considerable delays arise when queueing occurs, at flows which may be well below the free-flow limit, L.
8.20 In practice, there is a family of COBA link speed/flow curves and junction delay formulae corresponding to different road types. These curves are not quite of the form presented here. However, broadly speaking road improvements produce time benefits in one of two ways, either by increasing the free-flow speed (Case X in Figure 8.4) or by increasing capacity so as to extend the free-flow range (Case Y in Figure 8.4).
Figure 8.4: The Effect on User Costs of Road Improvements (as assumed in COBA)
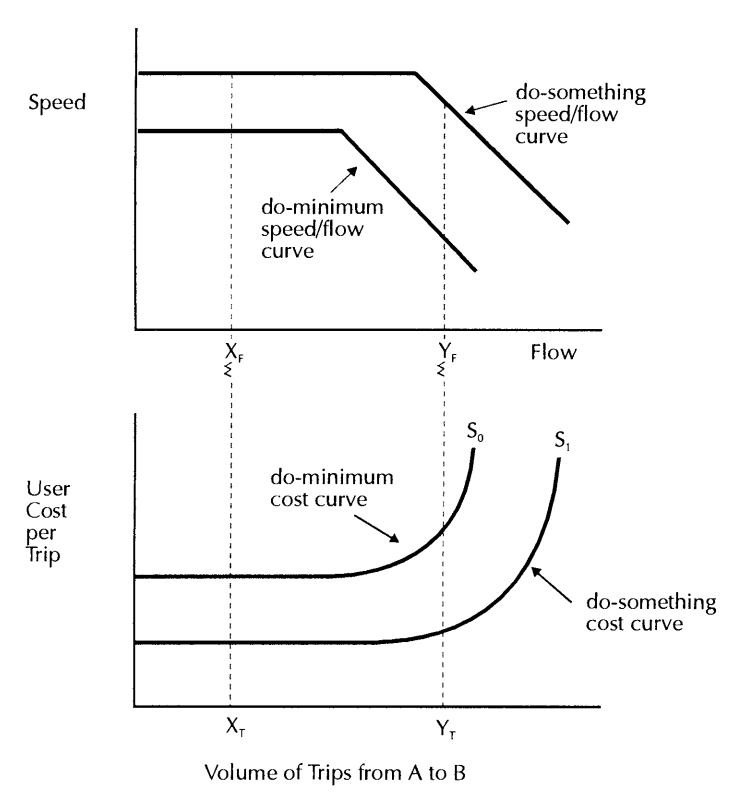
- 8.21 COBA deals in only a stylised way with heavily congested conditions. It does so by applying minimum speed cut-offs on links and maximum delay cut-offs at junctions. The purpose of these is to prevent modelled travel times rising to unrealistic levels in the do-minimum and exaggerated benefits being claimed therefore in the do-something. The behavioural implication is that, if network conditions deteriorate to a certain point, drivers will respond in a variety of ways which prevent conditions from worsening further (see the COBA 9 Manual, Sections 5.7 and 6.4). Such stylised approaches inevitably run into difficulties in dealing with severe network-wide congestion, when more sophisticated methods are required.
- 8.22 Suppose now that some induced traffic does actually result from the reduction in user cost per trip. The vertical demand curve in Figure 8.2 is no longer correct because the volume of traffic is no longer a fixed quantity (such as Cases X or Y in Figure 8.4) but is larger in the do-something than in the do-minimum scenario. The effect on the user benefits of this induced traffic will depend on whether the case is of type X or type Y in Figure 8.4.
- 8.23 These two cases are considered in Figure 1.7.2 of the COBA 9 Manual. The first, corresponding to X in Figure 8.4, is shown in Figure 8.5.
benefit to induced trips (Q1-QO) omitted under fixed matrix assumption II inelastic demand curve elastic demand curve do-something cost curve do-minimum User cost curve Cost per Trip Qo Q1
Figure 8.5: Additional User Benefit due to Induced Trips
8.24 This is the case where the induced traffic in the do-something does not affect the equilibrium user generalised cost of travel - that is, congestion is absent throughout the life of the scheme. In this case, with certain provisos discussed in Chapter 9, the fixed matrix assumption is a reasonable, conservative approximation to the true user benefits. The assumption results in the benefit to induced traffic being omitted, but the COBA 9
Volume of Trips from A to B
Manual states (paragraph 1.3.6) that this is unlikely to represent more than about 10% of the fixed matrix benefit.
- 8.25 The exception is the estuary crossing type of scheme where an eXIstIng barrier to movement is crossed. Here, with a large cost change, the proportion of benefits due to induced traffic may be much more significant. The classic example in the UK is the Humber Bridge where the volume of estuary crossing traffic rose from 2,000 vehicles per day in 1977 to 7,500 vehicles per day in 1982, one year after opening. Here, with a very large cost change, induced traffic was over twice reassigned traffic and accounted for over half the scheme benefits (Tuckwell et al 1985).
- 8.26 The second case given in the COBA 9 Manual is shown in Figure 8.6.
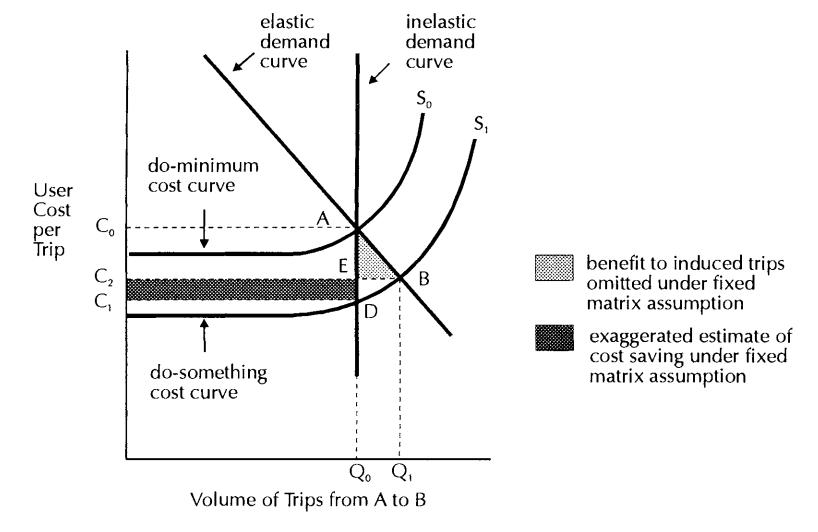
Figure 8.6: The Erosion of User Benefits due to Induced Traffic
Here, the additional traffic induced by the network improvement affects travel conditions, reducing speeds and partially re-congesting the network, despite the increase in capacity. The fixed matrix assumption gives a cost saving (and therefore a benefit) of CoADC1. But if the demand, after allowing for user responses is Qb then the user benefit will be COAaC2• This may be greater or less than CoADC1 depending on whether the omitted benefit to induced traffic ABE is greater or less than the area C2EDC1. This latter is the increase in costs imposed on the existing (base) traffic Qo by the new (induced) traffic, QI-QO. This figure from the COBA Manual depicts 'partial filling-up'; the investment stimulates demand for travel to increase above what it would otherwise have been and this moderates the fall in costs for existing traffic. This case is discussed in paragraph 1.7.9 of the COBA 9 Manual.
8.27 The conclusions from the principles outlined in Chapter 1 of the COBA 9 Manual are clear. First, if travel demand were wholly inelastic with respect to user cost, the fixed trip matrix assumption would be by definition correct, and the results unbiased (Figure 8.2). Secondly, even if travel demand is elastic, then provided network conditions are uncongested, the fixed matrix assumption will give a reasonable approximation for most types of scheme (Figure 8.5). Thirdly, however, if demand is elastic and network conditions are congested, then the fixed matrix assumption becomes problematic (Figure 8.6). These are, in essence, the conclusions reached by the authors of the COBA 9 Manual in 1981.
SAFETY APPRAISAL
8.28 Within COBA, the safety performance of the network is assessed in a series of relationships between accident rates and traffic volumes for each category of link and junction. Money values are attributed to the forecast change in accidents which results from a network improvement and the benefits are incorporated in the Net Present Value calculations. Under the fixed matrix assumption, the safety impact of a scheme is measured by the effect it has when handling a fixed volume and pattern of trips. If, however, there is some induced traffic as a result of the scheme, then it is necessary to compare the safety performance of a lower traffic volume in the do-minimum and of a higher traffic volume in the do-something. Clearly the size of the safety benefits could be sensitive to the fixed trip matrix assumption.
THE COBA PROGRAM
8.29 The COBA program is the Government's economic evaluation tool for the great majority of trunk road schemes. The COBA program relies on the assumption of a fixed trip matrix. The logic of the calculation is set out in Figure 8.7.
Figure 8.7: The Structure of the Traffic and Economic Appraisal
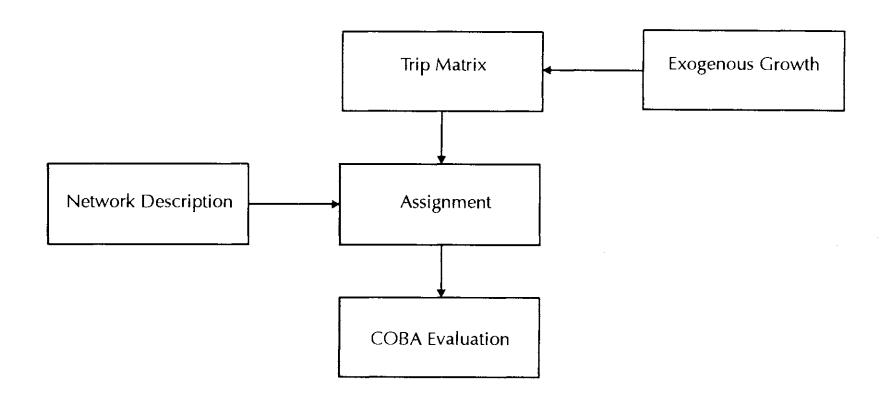
- 8.30 From the forecasting procedures described in Chapter 6, an origin-destination (O-D) matrix of trips is constructed and this is assigned to the base, do-minimum network and the improved, do-something network. Growth factors are applied to project the assigned flows forward into the future so that the volumes change through time. However, at each point in time, the trip matrix is the same in the do-minimum and do-something cases - this is the fixed trip matrix assumption.
- 8.31 The COBA program requires as inputs (a) the network description, that is a codified description of each link and junction within the study area, and (b) the assigned flows on the do-minimum and do-something networks. Embodied within COBA are standard speed/flow curves. COBA uses these to calculate, from the assigned flows, the link speeds and junction delays across the network. Values of time and operating cost formulae are then used to convert the physical performance of the system to its economic equivalent. The difference between the time and operating costs of the dosomething and the do-minimum comprises the user benefit of the scheme. This calculation is performed for the opening year and the design year, and COBA automatically interpolates and extrapolates the benefits to cover the full 30-year appraisal period.
- 8.32 COBA 9 was designed primarily for the appraisal of interurban trunk road schemes, but was considered in 1981 to have some applicability to urban and conurbation trunk road schemes. In that context, however, it was recognised that there is potential for lack of consistency between the travel costs on which the assigned flows are based in the assignment model and the travel costs which are computed separately by COBA for the evaluation. When dealing with multiple routeing, congested junctions and complex interactions within the network, the required consistency may not be achieved. Following the 1986 SACTRA Report, the Department has developed URECA (URban EConomic Appraisal). This method takes as input the flows and costs from a congested assignment model and performs the economic evaluation directly from those equilibrium flows and costs. URECA has been used during the last two to three years and analysts are still gaining experience of using it in complex urban congested conditions, in connection with major local authority schemes as well as trunk road schemes. The current version of URECA is designed for use only in conjunction with a fixed trip matrix so that its contribution lies in improving the consistency between the route assignment and evaluation of a given matrix.
HOW COBA IS USED
- 8.33 As well as setting out the relevant principles of economic appraisal, the COBA Manual provides advice to the analyst on how the principles should be applied. This clearly involves official and professional judgment, as well as adherence to the procedures.
- 8.34 The Manual advises that COBA 9 is applicable to the "great majority ofschemes", but that there are schemes for which additional or alternative techniques are more appropriate. These are listed as:
- "a) Schemes costing less than £IM where a less sophisticated approach can be adopted ... however there will be schemes in this category that can and should be assessed using COBA.
- b) Larger schemes where the effects of redistribution are assessed in the traffic modelling process. Variable trip matrix evaluation techniques may be applied using values and principles consistent
with COBA. This category includes schemes requiring a broadly based 'strategic assessment' incorporating redistribution, and c) Schemes where the formulae used in the COBA program are considered inappropriate (e.g. some conurbation schemes). COBA9 has wider applicability to urban and conurbation trunk road schemes than COBA8, but where congestion presents problems which are beyond its range, special treatment is required. "
(COBA 9 Manual - Introduction).
- 8.35 In practice, according to the Department, the only trunk road schemes which have been evaluated using variable matrix methods during the last decade have been the East London River Crossing and the A55 Conway Crossing. In the case of the East London River Crossing, a variable matrix was used which allowed for redistribution but not for the other possible responses of generation, mode split or trip retiming. In that case, the COBA advice was followed and a benchmark COBA fixed matrix evaluation undertaken, against which the variable matrix results were compared.
- 8.36 Over the last decade, the Department has developed a number of methods designed to deal with the appraisal of congested urban and conurbation schemes. The development of URECA was one response to the problem. Another has been recognition of the need for intervention to modify the NRTFs where it was apparent that these could not be accommodated on the base do-minimum network and, in some cases, the do-something network as well. A range of growth cut-off methods has been used in such cases. An Advice Note 'Traffic Appraisal in Urban Areas' is currently in draft. These developments have, however, all taken place within the fixed matrix COBA or URECA framework.
- 8.37 To conclude, it is recognised in the COBA Manual that, in principle, circumstances exist where the fixed matrix assumption is inappropriate or at least needs to be subject to sensitivity testing. In practice, the Department's advice has been that, in general, COBA and URECA provide sufficiently robust results for the decisions for which they are required. Only in very exceptional cases such as estuary crossing schemes, has the Department advised that the sensitivity of the appraisal result to the fixed matrix assumption needs to be tested.
REFERENCES
Department of Transport. COBA 9 Manual. Revisions up to 15 November 1993. Highways Economics and Traffic Appraisal Division.
Department of Transport. URECA Manual. 1990 version. Highways Economics and Traffic Appraisal Division.
SACTRA (1986). Urban Road Appraisal. HMSO.
Tuckwell R M, Fell R M and Hague J H (1985). Return on the Bridge - the Economic Prospects of the Humber Bridge. Highways and Transportation. 32 (1): 3-9.
CHAPTER 9: IMPLICATIONS OF INDUCED TRAFFIC FOR ECONOMIC EVALUATION
INTRODUCTION
- 9.01 In Chapters 4 and 5, we considered the evidence relating to the first of the four questions posed in Chapter 2; that is, whether or not induced traffic is a real phenomenon. In Chapters 6, 7 and 8, the Department's approach to traffic forecasting and economic evaluation of trunk road schemes has been described. With rare exceptions, the Department relies on the fixed trip matrix as the basis for scheme appraisal, making no allowance for any induced traffic effects of new capacity.
- 9.02 We now turn to the second question does induced traffic matter? It is possible, as a matter of logic, that, even if induced traffic is a real phenomenon, it is of such little consequence for scheme design and economics that it can be safely ignored. Indeed, the practical interpretation of the COBA 9 Manual is that, by ignoring induced traffic effects, a conservative appraisal will generally result.
- 9.03 The Department's reliance on fixed trip matrix evaluation methods for new road construction has been the subject of much review and comment in the literature (for example Mackie and Bonsall 1989, Crovetto and Ortuzar 1990, Mogridge et aI1987a,b) in papers commissioned by the Department (Helm 1991, Dodgson 1991), and in the evidence submitted by Mr S Plowden. The quantitative work of Williams and others is considered in Chapter 10.
- 9.04 The proposition, which we now take to be correct, that induced traffic does exist, opens up three broad lines of critical argument developed in the literature and evidence submitted to us. The first is that the fixed matrix assumption is not an acceptable simplification; that is, it does not - at least in some circumstances - produce appraisal results which satisfy the Department's requirements for a robust test of project worth. The second line is that induced traffic is partly a manifestation of induced economic activity resulting from new infrastructure, and that this induced economic activity should be considered within the scope of the cost/benefit analysis. The third line is that the Department's appraisal principles, as expressed in Chapter 1 of the COBA 9 Manual, are sound, but that the Department has failed to put those principles fully into practice. These three lines of argument are explored in turn.
THE ROBUSTNESS OF THE TRAFFIC BENEFITS TO THE FIXED DEMAND ASSUMPTION
9.05 The proposItIon that road scheme appraisal results based on the fixed trip matrix assumption are not robust if there is in fact some induced traffic is clearly a central issue. There are actually several arguments - the possibility that part of the assumed national traffic growth is scheme-related, the realism of future forecast traffic flows in the absence of new investment, Dodgson's limiting case and Mogridge's conjecture. Each of these is discussed below, and the findings are summarised in paragraph 9.23.
External versus Scheme-related Traffic
9.06 When COBA is used as the appraisal tool, no induced traffic resulting from the scheme being assessed is allowed for. All traffic growth throughout the life of the scheme is held to be due to external influences, principally income and car ownership growth. What if some part of the traffic growth is actually scheme-related, but treated in the appraisal as externally caused? Then, even in the absence of congestion, the Department's procedures may not provide conservative, cautious estimates of the user benefits. For, although the base year traffic forecasts should, on average, be correct, progressively over the life of the scheme, as growth occurs, some traffic which should be treated as induced traffic would actually be treated as base traffic.
Figure 9.1: Effect of Scheme-Related Growth on the Estimate of Benefits
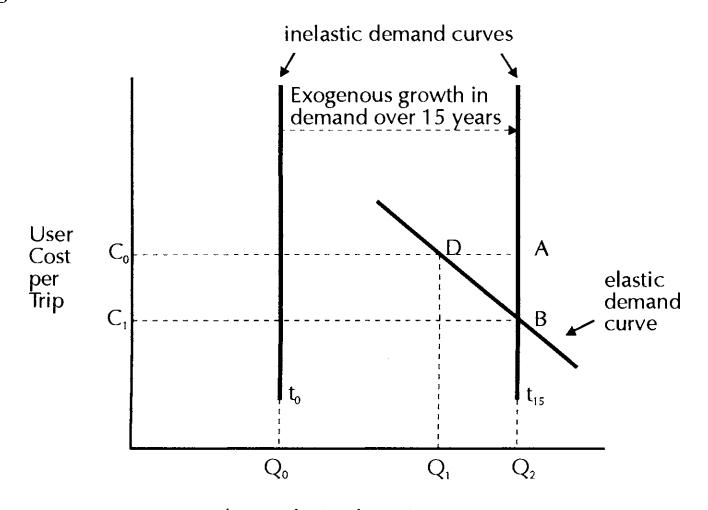
Volume of Trips from A to B
- 9.07 If the traffic forecasts project growth from Qo trips at period to to Q2 trips in the design year, tIS, the measured benefit in year 15 (using COBA) will be CoABC1. But, if a component of that growth would not have occurred in the absence of the scheme, the correct benefit measure for year 15 is CoDBC1. On a sample calculation with a discount rate of 80/0 and a traffic growth rate of 30/0 of which one-third is scheme-related, the effect is to overestimate the Present Value of the Benefits by 5%.
- 9.08 Thus, we conclude that, even in the absence of congestion, the COBA fixed matrix assumption is conservative only if the traffic growth rate applied to the matrix is genuinely independent of network quality and contains no scheme-related component.
Realism of the Do-Minimum
9.09 A related point concerns the ability of the do-minimum network to cope with a high forecast exogenous growth of traffic on the network. With traffic forecast to grow at
- (say) 30/0 per annum compound over the appraisal period under high growth assumptions, there is an obvious question - would the forecast traffic volumes actually materialise on the base, unimproved network at the speed/quality of service levels which those volumes would imply? Or would some trip suppression mechanisms come into play? It is absolutely crucial for the robustness of the Department's procedures that the base do-minimum network should be capable of handling the forecast traffic over the life of the scheme at plausible quality of service levels.
- 9.10 Suppose that unconstrained traffic growth forecasts are applied to a network which is already operating close to capacity. If, in fact, less than that volume of traffic would actually choose to travel on the unimproved, do-minimum network, the fixed matrix assumption leads to an overestimate of benefits.
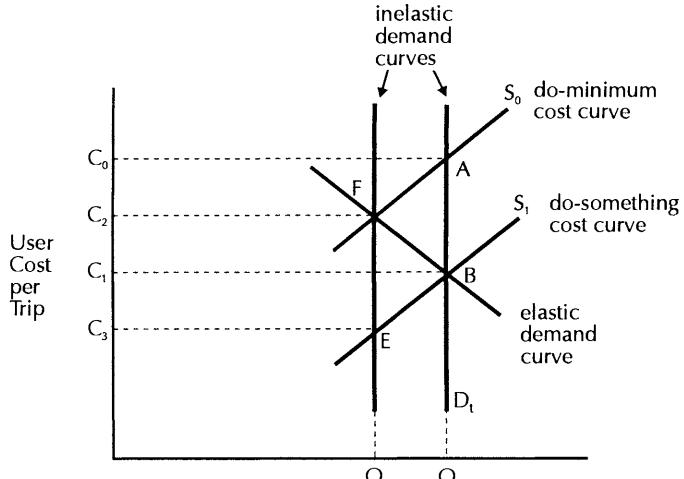
Effect of an Overloaded Do-Minimum on the Estimation of Benefits Figure 9.2:
- Volume of Trips from A to 8
- 9.11 In Figure 9.2, the modelled benefit at a given time t is (using COBA) CoABC1 but, if in the do-minimum, the realistic equilibrium volume is Ql at a cost of C2, rather than Qo at a cost of Co, the true benefit is C2FBC1. The assumption of unconstrained exogenous NRTF growth causes the do-minimum flows and costs both to be higher than would actually occur. It can readily be seen from first principles that, in capacityconstrained conditions, the realism of the do-minimum user costs and volumes is crucial to the credibility of the appraisal results.
- 9.12 The Department has recognised that problems of this kind can arise when dealing with forecast growth on congested urban and peri-urban schemes. Accordingly, it has developed growth cut-off procedures in order to prevent unrealistically high travel times being forecast in the do-minimum case and, hence, unrealistically large benefits being attributed to the scheme. However, in order to maintain the fixed matrix assumption,
the same cut-off needs to be applied to the do-something as the do-minimum. Thus, in Figure 9.2, if traffic is cut off at Qb the fixed matrix benefit will be C2FEC3.
- 9.13 There are several points to make about this type of procedure. Clearly it is better to cut off growth than to allow unrealistic speeds and flows in the do-minimum case. However, the use of growth cut-offs within a fixed matrix context is inconsistent with the idea that growth is influenced by network quality, which implies cutting off growth later (if at all) in the do-something case than in the do-minimum. A great deal of judgment is involved in the use of cut-offs and it is not easy to see how, in using them, appraisal consistency is preserved. We are not convinced that the user benefit calculated under fixed demand assumptions with cut-offs is an adequate proxy for the true benefit in capacityconstrained conditions. In Figure 9.2, only by chance will C2FEC3 equally C2FBC1. Errors are particularly likely if congestion features in the do-something as well as the do-minimum case.
- 9.14 Thus, we conclude that a realistic representation of do-minimum network conditions is fundamental to the integrity of the economic evaluation process. This is especially so in conditions where congestion occurs regularly on the network even in the base year. The Department's strategy for dealing with the situation where forecast traffic cannot be accommodated on the do-minimum network is to apply a cut-off to the growth projection. However, growth cut-offs are a very blunt instrument, particularly if they are applied nonselectively to the do-minimum and do-something cases.
The Limiting Case
9.15 Some people in evidence asserted that prOVISIon of new road capacity in congested situations is futile; that demand will expand rapidly to meet the increased supply, leaving road conditions no better than they otherwise would have been. Returning to the analysis of the previous chapter, this case of total filling-up is illustrated in Figure 9.3. Here, a reservoir of suppressed trips exists which is released when network supply is expanded from So to SI. In the limiting case of perfectly elastic demand, user costs are unchanged; there are, therefore, no user benefits and any expansion of capacity is worthless in COBA terms.

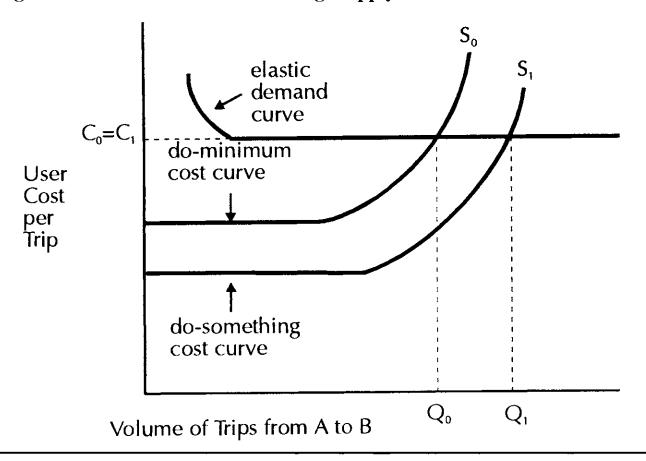
9.16 In 1990, the Department commissioned two short pieces of work from Mr D Helm and Mr J Dodgson to consider this case. A number of important points emerged from their reviews. For the limiting case to apply, the filling-up process must be immediate and total. There must be no consequential relief or decongestion elsewhere on the network. In considering the outcome, the proper comparison is between the performance of the network with the scheme in place and what would have happened in the absence of the scheme at any particular point in time. This is not the same thing as comparing the network performance before and after the scheme opened. To this extent, the term 'before and after', although frequently used, is misleading, especially if the time period of implementation is long. Figure 9.4 illustrates this.
Figure 9.4: A Before and After Paradox in Evaluation
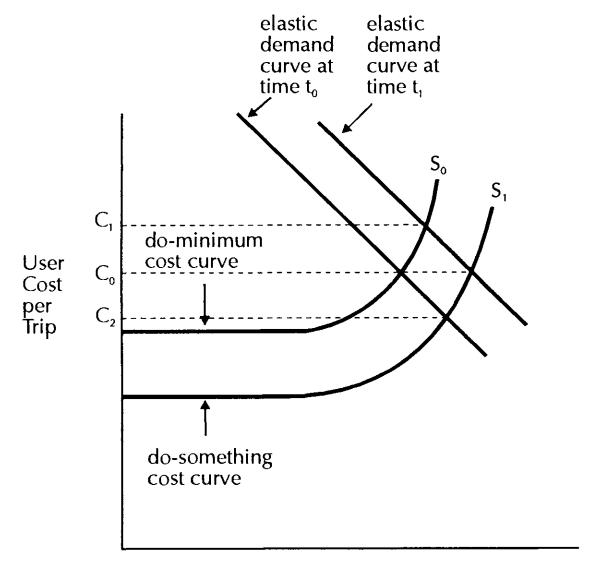
Volume of Trips from A to B
Here exogenous growth would increase user costs per trip from Co to C1 in the absence of any improvement scheme (that is, So) between time period to and t 1• Putting in the scheme (SI), on the other hand, will reduce the user cost per trip to C2 at time period to. However, the effect of the exogenous growth will mean that the user cost per trip with the scheme in place will rise steadily as time goes on. It is clear from Figure 9.4 that, at time t b the user cost per trip in the do-something case will have risen from C2 back to Co (the original do-minimum figure for user cost per trip), apparently negating the benefit. But even though, on the face of it, travel costs are no longer reduced, the proper comparison is between Co and C1 - that is, the forecast user cost per trip with and without the scheme in each time period. Provided these are different (the demand curve is downward sloping) there will be positive user benefits arising from the scheme.
- 9.17 Dodgson demonstrates convincingly the precise conditions under which the limiting case of no user benefits (Figure 9.3) applies. He states that the requirements are:
- " (i) There are alternatives which are perfect substitutes for the improved facility.
- (ii) Some of these alternative facilities are not congested.
- (iii) The improved facility will not attract all the traffic from these uncongested alternatives".
9.18 Dodgson continues:
*"Although [these*J circumstances are the limiting case, if *alternatives are very good, but not perfect, substitutes, then the mechanisms described may lead to considerable substitution which leads [in turn*J to a considerable increase in traffic on the improved facility and to small reductions in generalised cost and low levels of user benefit throughout the network . .. ".
- 9.19 This takes us back to the case of partial filling-up previously discussed in paragraph 8.26. If, from the traveller's point of view, there is some degree of substitutability between travel destinations, modes, times of day, and the other choices discussed in Chapters 2 and 3, then network improvements will trigger some mixture of those responses, leading to some increase in vehicle-kilometres on the network. If the network is congested, the result of this may well be a partial (but not total) erosion of the benefits from the improvement.
- 9.20 The Committee's own conclusions are as follows. In the limiting case of full and immediate filling-up, with no relief to any other part of the network, the benefit to users of a road improvement which takes place in these suppressed demand conditions would indeed be zero. The limiting case, although unlikely, is important analytically in establishing the conditions under which total erosion of benefits could occur. However, the crucial practical question is how robust the Department's benefit measures are to the phenomenon of partial filling-up described in paragraphs 8.26 and 9.16.
Mogridge's Conjecture
9.21 A series of papers by Mogridge and colleagues posit an even worse social outcome than the no-benefit case just discussed (Mogridge et al 1987a,b). They consider the case in which the principal form of user response is to switch mode from public transport to car. Mogridge argues, following Downs and Thomson, that road improvements will cause a switch of traffic away from public transport as equilibrium is restored between the two modes. However, since public transport is subject to commercial constraints then, as traffic is lost, fares have to be increased and/or services cut, thereby causing a second-round diversion from public to private transport. Mogridge concludes that:
"if journey costs on public transport are increased as a result of loss of demand, then the new equilibrium cost will be at a higher level than before. Increasing road capacity thus increases journey costs for cars. ".
9.22 We conclude that this argument does merit consideration in the context of capacity improvements to radial routes in metropolitan areas, where public transport has a significant share of the travel market and some mode-switching may occur. For interurban trunk road improvements, however, modal transfer is less likely than other responses such as trip redistribution and retiming, and therefore this effect is unlikely to be significant.
Summary
- 9.23 The foregoing points are all consistent with the principles of economic appraisal set out in Chapter 1 of the COBA Manual. In particular, we believe it is correct, as a matter of principle, to say that:
- the COBA fixed matrix assumption is conservative only if traffic growth is caused wholly by external factors, such as income growth, and is entirely unrelated to network quality;
- it is crucial for scheme appraisal that the do-minimum is represented by realistic achievable equilibrium flows and costs in the absence of the scheme;
- in the limiting case of total and immediate filling-up of new road capacity, with no relief occurring elsewhere in the network, release of suppressed demand could result in the user benefits being entirely eroded; and
- in the less extreme case, where improving a congested network leads to partial filling-up, some erosion of the fixed trip matrix benefit may well occur.
THE COMMERCIAL BENEFITS OF ROAD INVESTMENT
9.24 The second line of argument put by some in evidence is broadly that: (a) of course, induced commercial traffic exists, it would be very worrying if it did not, and (b) induced commercial traffic is a direct manifestation of induced economic activity, which is what road investment is all about. There are two questions which need to be addressed. First, what is the evidence that road improvements induce commercial traffic? Secondly, what are the implications for road investment appraisal?
The Evidence
9.25 At a general level, it is not credible that the pattern and structure of economic activity would remain the same in the absence of a developed trunk road and motorway network. As the Freight Transport Association evidence (Freight Transport Association 1991) says:
"Many businesses have reduced factory and warehouse locations to take advantage of reduced journey times provided by motorways. Some industries and services, such as next day parcels services and express coaches, would not have been possible without the productivity opportunities afforded by motorways ...
Evidence from member companies illustrates that these productivity improvements have led to real cost savings. One food industry company has reduced its distribution depots from ten to four during the past five years. These improvements have been made possible by the improved road systems between its factories and its customers. .. The same company has been able to close all its depots in the South- West and serve them from a West Midlands factory, as a result of the opening of the M5 motorway. ".
- 9.26 This is a vivid example of the way in which any commercial organisation rightly concerned to minimise its costs of doing business should respolld to a transport network improvement. The improvement lowers transport costs relative to non-transport costs (manufacturing and warehousing) and thus encourages a more transport-intensive solution to the distribution problem. Economies of scale in warehousing or manufacturing are exploited by operating systems with an increased aggregate vehiclekilometres from a reduced number of manufacturing or distribution points. Induced vehicle-kilometres of traffic on the network are the physical manifestation of this economiC process.
- 9.27 A study of the impact of the Humber Bridge on commercial traffic found a variety of responses, including expansion of market areas, increased market penetration, depot rationalisation, changes to inter-depot boundaries, and rationalisation of production in the frozen vegetable industry. Most of these responses imply induced traffic is a healthy commercial response to network improvements. Anecdotal evidence from Scotland suggests that the improvement of the A9 has had a major effect on the economy of the Highland Region, in general, and the city of Inverness in particular.
Implications for Road Investment Appraisal
- 9.28 It is obviously important that the direct transport cost reductions to commerce and industry from road improvements should be appropriately represented in any investment appraisal. It has long been asserted that the Department's appraisal methods tend to underrate these benefits, and the Leitch Committee commented that "this may well be a fruitful area for research" (ACTRA 1978). More recently, work by Quarmby (1989) again suggests that the transport cost savings approach may undervalue the benefits to the physical distribution system.
- 9.29 It is clearly right in principle to allow for induced commercial traffic within the traffic and economic appraisal. However, evidence on the appropriate elasticities of commercial vehicle-kilometres is admittedly very limited. Nevertheless, the question of the wider economic benefits of road schemes has been repeatedly studied in the UK, continental Europe and the USA. The mainstream view (for example, Mohring 1976, Dodgson 1973, ACTRA 1978, Parkinson 1981, Jara-Diaz 1986 and Halcrow Fox and Associates 1985) based on microeconomic analysis is that, with certain exceptions, provided the direct transport benefits are correctly estimated, there are no additional indirect benefits. Adding the indirect benefits to the direct benefits normally involves some form of illegitimate double-counting.
- 9.30 Two exceptions, however, arise in imperfect markets, where prices of products or factors do not reflect marginal resource costs. The most important example is that of widespread underemployment of labour for which the wage rate does not equal the opportunity value. Here, if it could be demonstrated that infrastructure investment
induced entirely new economic actIvIty at the national level, which brought such resources into employment, the benefits of so doing would not be represented in the direct transport benefits, and would be genuinely additional. Examples might be the attraction of footloose industry from abroad, or the exploitation of natural resources for which transport was the constraining resource (mineral extraction or fisheries, for example).
- 9.31 The second example is that of a road which diverted economic activity from a low unemployment location to a high unemployment location and therefore permitted the economy as a whole to operate at a higher level of employment than would otherwise be the case. Here, the relocation of existing economic activity would result in a national gain over and above that measured in the direct transport benefits.
- 9.32 These examples suggest that legitimate additional benefits can occur, but only in rather unusual specific circumstances. It may be argued that this is inconsistent with the great emphasis that business interests and local government often place on securing road investment. Certainly, at the local level, road investment may stimulate economic development if poor accessibility was previously a constraint. But, from the national viewpoint, which is the relevant one for the purposes of trunk road appraisal, most of this development is diverted from elsewhere rather than created. An important development for city A is of no relevance in a national cost/benefit analysis if it is mirrored by a corresponding loss to city B.
- 9.33 The Leitch Committee (ACTRA 1978) concluded on this issue:
"Any presumption that such possible restructuring effects can help to justif}' a scheme must therefore be treated with great caution . .. The Department is, in our view, correct in excluding the indirect effects from the evaluation. Nor should they appear automatically within the overall assessment. We recommend that they be included only where strong evidence can be adduced to support them. ".
We agree with this conclusion, but add the rider that it presumes that the direct transport benefits, including benefits to induced traffic, are correctly measured in the appraisal.
THE DEPARTMENT'S APPRAISAL PRACTICE
- 9.34 Perhaps the most compelling theme to emerge from the evidence concerns, not the principles of economic appraisal, but the application of these principles in the Department's current practice. Indeed, we commend Chapter 1 of the COBA 9 Manual as a sound and clear statement of the principles of economic appraisal of roads. The principal point of contention is the way in which they are given practical effect.
- 9.35 As discussed in Chapter 8, the Department's stated position is that the fixed matrix method embodied in the COBA 9 program has wide applicability. However, they do acknowledge circumstances in which use of the fixed matrix is inappropriate and can give a misleading indication of the economic value of schemes.
- 9.36 The Department has told the Committee that its policy is one of "horses for courses". It is recognised that, as common sense would suggest, different schemes pose different problems requiring differing appraisal treatments. Appraisal should not be more
sophisticated than is necessary "to give a robust conclusion on the design, appraisal and value for money of the scheme".
- 9.37 The level of sophistication required (which horses for which courses) is a matter of professional judgment on which the Committee has been asked to give its view. As a preliminary point, we note that one weakness of the fixed matrix method is that the robustness of scheme economics to induced traffic cannot be tested as a standard operating procedure. This weakness has, in our view, become more serious with the passage of time, as congestion affects more and more schemes in the programme. Over the last decade, and particularly since the 1989 NRTF revision, there is no doubt that problems of forecast flows exceeding capacity have become much more prevalent in trunk road appraisal.
- 9.38 The Department has commissioned a number of reports from consultants, particularly over the last four years. That produced by The MVA Consultancy and the Institute for Transport Studies at the University of Leeds, on modelling the effects of congestion on interurban highway networks (MVA/ITS 1990), states:
"By no means all schemes will suffer from such (lack of) capacity problems and, in many circumstances, it may be considered acceptable to continue with current appraisal methods. However, our information to date suggests that of those schemes that have been (re-) appraised in the light of NRTF 1989, almost one third are experiencing serious capacity problems in the Do-Minimum. It is not merely the case that the forecast growth would lead to a certain amount of congestion which might need to be taken into account of in the assessment process: rather, it is often infeasible for the 'Do-Minimum' to accommodate the predicted growth of traffic, in some cases even in the off-peak.
The presence of a significant number of schemes where the existing methodology is inappropriate, without modification, means that the option of ignoring congestion in interurban appraisal is not sustainable. ".
We conclude that the condition of partial filling-up, described in Chapter 8, is a quite realistic phenomenon and is likely to become increasingly common. This is the scenario in which, from first principles, the use of the fixed matrix assumption becomes problematic.
- 9.39 The practical question which the Department has asked its various consultants, and indeed this Committee, is how it should respond to this. It is our belief that, at the time the COBA 9 Manual was prepared, the Department fully intended to develop a variable matrix version of COBA for use on schemes where such a method was judged to be appropriate. This was the role envisaged for the MATBEN/NETBEN/RDEVAL suite of programs developed for the Department, and used by some Regional Offices, particularly West Midlands Regional Office, but never officially adopted.
- 9.40 Since that time, however, attention has switched to the development of methods such as growth cut-offs, which attempt to mimic or proxy variable matrix methods within a fixed matrix framework. These methods and the consistency with which they are used in scheme appraisal have not been subject to wide external debate and validation. In
evidence, one Regional Office described their use as "arbitrary". For the reasons set out in paragraph 9.14, we do not think they are a conceptually satisfactory way of dealing with the reality of trip suppression.
9.41 We conclude that reasoning from economic theory and logic indicates that variable trip matrix evaluation methods are likely to be necessary to give the required levels of robustness and consistency for public expenditure decisions on a significant proportion of trunk road schemes. However, qualitative arguments are not enough. It is necessary to consider whether the effects of allowing travel demand to vary with road capacity are quantitatively important for scheme appraisal. This is the purpose of Chapter 10.
REFERENCES
ACTRA (1978). Report of the Advisory Committee on Trunk Road Assessment. HMSO.
Crovetto G and Ortuzar J de D (1990). User Benefits from Fixed and Variable Demand: Some Comments. Traffic Engineering and Control 31(6): 356-357.
Dodgson J S (1973). External Effects and Secondary Benefits in Road Investment Appraisa1. Journal of Transport Economics and Policy 7(2): 169-185.
Dogdson J S (1991). Identification and Estimation ofEconomic Benefitsfrom Urban Road Improvements. Unpublished report to TRRL.
Freight Transport Association (1991). The Transport Dilemma.
Halcrow Fox and Associates (1985). Development Impact of Urban Roads. Technical Note 20 of Urban Roads Appraisal: Review of Methods.
Helm D (1991). Identification and Estimation of Economic Benefits from Urban Road Improvements. Unpublished report to TRRL.
Jara-Diaz S R (1986). On the Relation Between Users' Benefits and the Economic Effects of Transportation Activities. Journal of Regional Science 26(2): 379-391.
Mackie P J and Bonsall P W (1989). Traveller Response to Road Improvements: Implications for User Benefits. Traffic Engineering and Control 30(9): 411-416.
Mogridge M J H, Holden D J, Bird J and Terzis G C (1987b). The Downs/Thomson Paradox and the Transportation Planning Process. International Journal of Transport Economics XIV(3).
Mogridge M J H and Holden D J (1987a). A Panacea for Road Congestion? - A Riposte. Traffic Engineering and Control 28(1): 13-19.
Mohring H (1976). Transportation Economics. Ballinger Publishing. Cambridge, Massachusetts.
The MVA Consultancy and The Institute for Transport Studies (1990). Modelling the Effects of Congestion on Interurban Highway Networks. Report to TRRL.
Parkinson M (1981). The Effect ofRoad Investment on Economic Development in the UK. Government Economic Service Working Paper 43.
Quarmby D A (1989). Developments in the Retail Market and their Effect on Freight Distribution. Journal of Transport Economics and Policy 23: 75-88.
CHAPTER 10: IMPLICATIONS FROM EXPERIENCE OF TRANSPORTATION MODELLING
INTRODUCTION
- 10.01 We concluded from the evidence in Chapters 4 and 5 that induced traffic is a real phenomenon - the first of our four questions at the end of Chapter 2. In Chapter 9, we sought to answer the second of our questions - does induced traffic matter? In this chapter, we also address this same question, but also go on to answer the third of our questions - where and when does it matter most?
- 10.02 In Chapter 6, we described the Department's current practice in modelling traffic for the appraisal of trunk road schemes. The vast majority of the Department's models represent only the effects on choice of route in response to a road improvement scheme. Only very occasionally are other effects, such as trip distribution and trip suppression, modelled. In this chapter, we consider what more complex models can tell us about the changes in trip matrices which could arise from road improvement schemes.
- 10.03 Mathematical models of transportation systems have played a prominent role in transportation planning in this country since the second half of the 1960s. These models are hypotheses of how people use transport systems, based on theories about human behaviour. The reason for using any kind of synthetic model is that the complexities of human behaviour are such that future travel choices cannot be forecast directly from observation of existing behaviour, although it is inevitable that behaviour is represented in a simplified way in a model. A model must calibrate - that is, it must explain the relationships displayed by observations. It must also validate - that is, it must replicate observed conditions, such as the pattern of traffic flows on roads. The fundamental proposition is that a well-calibrated and validated model can be used as a predictive tool.
- 10.04 Models provide a means of extrapolating empirical evidence, based on theories of human behaviour. Thus, by means of models, more extensive conclusions can be drawn from the necessarily limited empirical evidence of how road users respond to changes in the road system. (By changes in the road system here we include additions to or deletions from the network, road improvements, and changes in the levels of traffic congestion.) However, it needs to be recognised that these extrapolations rely for their validity on the realism of the underlying theories.
- 10.05 Transportation models can only tell us about the relationships actually built into them. They cannot inform us about drivers' reactions for which mathematical relationships or procedures have not been developed and incorporated in the models. In that respect, the evidence from modelling exercises is only as good as the behavioural basis behind the model forms and the response coefficients.
- 10.06 A transportation model of some form has been at the heart of most planning studies of transport systems in this country over the last 25 years. Up to the late 1970s, these models were often of the conventional four-stage structure (trip ends, distribution, modal split, and assignment). The responses to changes in the road system which these models could handle were generally confined to changes in mode, destination, and
route. However, most of these models were not updated during the 1980s and have gradually fallen into disuse amid doubts about their accuracy and value for money. Practitioners have preferred instead to concentrate on assignment modelling alone, principally of the traffic system, although some models of public transport systems were built before bus deregulation took effect in 1986. More recently, some strategic transport demand models have gained favour. These have very simplified networks and generally embody relationships which have been tested to varying extents, but include changes in time and frequency of travel, in addition to changes in mode, destination and route.
- 10.07 As a result of these evolutionary developments, very few well-specified and wellcalibrated four-stage models of transport systems now exist in this country. There are exceptions where models of this type have been developed using relatively recent data (such as London, Belfast, and Glasgow), although generally they still include only changes of mode, destination and route effects. Four-stage transportation models are, in theory, capable of being used to demonstrate, in a systematic way, some of the responses travellers would make to changes in the road system. However, very few of these models developed in recent years in this country have been used for such purposes.
- 10.08 The strategic transport demand models developed more recently, for urban areas such as Edinburgh, Bristol and Merseyside, provide a means of testing a wider range of effects, including notably changes in time and frequency of travel, although route choice modelling is sometimes handled quite simply. To our knowledge, none of these models has been used in a systematic way to demonstrate the effects of changes in the road system. However, we are aware of some tests which have been undertaken using the strategic model of Bristol of the effects of tolls on motorways, which are of some relevance to our inquiries.
- 10.09 Models which represent the interaction between land uses and transport systems are also of interest. While many of the relevant processes remain imperfectly understood, several land-use/transport interaction models have been developed and applied in cities in various parts of the world over the last twenty years. They are generally too complex for each component submodel to be individually calibrated, but experience of using them has given some confidence in their results. Tests conducted as part of ISGLUTI (International Study Group on Land Use/Transport Interactions) contain some results of relevance to our inquiries.
10.10 The evidence from models which has been submitted to us falls into seven main groups:
- work done by Huw Williams of the University of Wales, using a single link model, and a network-based model of Cardiff, which includes procedures to model changes in mode and destination, as well as the aggregate effects of all forms of induced traffic (Williams and Moore 1990; Williams and Lam 1991; Williams and Lai 1991; Williams, Lam, Austin and Kim 1991; Williams and Yamashita 1992; and Williams and Yamashita 1992);
- work done by Halcrow Fox and Associates, under contract to the TRRL, to estimate the changes in mode, destination, and route resulting from new roads using a four-stage model of Belfast (Coombe, Leigh and Chua 1989) (subsequently elaborated by Emmerson at the TRRL);
work done by Halcrow Fox and Associates, using elasticity models to estimate the total traffic induced by new roads and road improvements in Belfast (Coombe, Leigh and Chua 1989), West London (Halcrow 1989; and Coombe, Forshew and Bamford 1990), and Norwich (Coombe 1992; Halcrow Fox and Associates 1992);
work done by The MVA Consultancy for the Department of Transport, using a strategic transport demand model of Bristol to evaluate the effects of tolls on motorways (MVA 1993);
work done during the ISGLUTI study, to demonstrate the effects of new roads on land-use dispositions (Webster and Dasgupta 1991);
work done by Halcrow Fox and Associates in Norwich, to estimate the effects of land-use development which could be stimulated by new roads (Halcrow Fox and Associates 1992);
work done by Marcial Echenique & Partners to investigate the land-use effects of a hypothetical new motorway (Williams and Lawlor 1990); and
work done by the Institute for Transport Studies at the University of Leeds, on the reactions of freight operators to changes in travel conditions (Mackie and Tweddle 1993).
The evidence provided by these studies is of two kinds: first, the calibrated relationships provide some guidance about the possible scale of induced traffic; and secondly, the models show the effects on economic benefits of induced traffic.
10.11 The key principles of transportation modelling which are important in this context (modal split or mode choice, trip distribution or destination choice, assignment or route choice, choice of time and frequency of travel, and elasticity modelling) have been explained in outline in Chapter 3. The remainder of this chapter is devoted to a brief summary of each of the studies listed in paragraph 10.10, insofar as they relate to the problem of assessing the impact of induced traffic on road scheme appraisal.
THEORETICAL MODEL BASED ON A SINGLE LINK
10.12 In their seminal work, Williams and Moore (1990) employed a measure, Delta, which relates benefit estimates under variable matrix assumptions to corresponding benefit estimates under fixed matrix assumptions. This measure is defined by reference to the following conventional diagrammatic representation of scheme benefits (Figure 10.1). This is essentially the same as Figure 8.6.
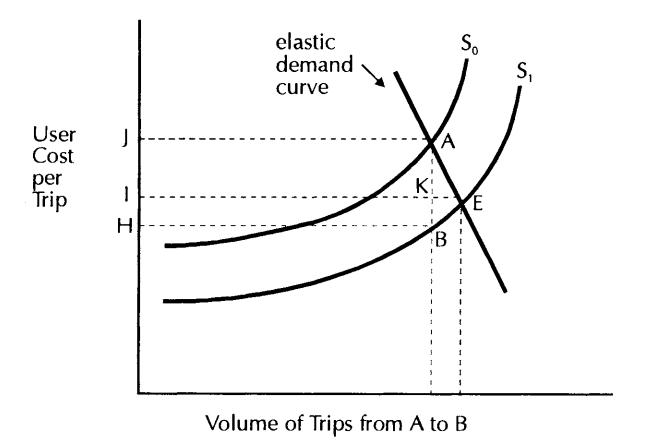
Figure 10.1: Relationship Between Supply and Demand
Implementation of the scheme shifts the cost (supply) curve from SO to Sl. Under a fixed matrix assumption (a vertical demand curve through A), equilibrium in the base (do-minimum) case is at A and in the with-scheme case is at B. As before, the fixed matrix estimate of user benefit is JABH. Under a variable matrix assumption (elastic demand curve), equilibrium in the base case is at A and in the with-scheme case is at E. The variable matrix estimate of user benefit is JAEI.
10.13 Delta is given by area JABH - area JAEI area JABH = area IKBH - area AEK area JABH
That is, Delta is a measure of the extent to which the congestion disbenefit resulting from the extra trips induced by a highway improvement outweighs the benefit accruing to these additional trips. It measures the extent to which trips attracted to a highway network by investment depresses the total benefit below (a positive value of Delta) or raises it above (a negative value of Delta) the level which would accrue under the assumption of fixed demand. Thus, Delta represents the error of trying to approximate variable demand calculations by the fixed demand estimates usually employed in scheme appraisal.
10.14 Williams' early work in this field employed a simple single link equilibrium model and a specified volume of travel. Schemes were represented by a change from one stal1dard Department of Transport speed/flow curve to another which had higher free-flow limits, free-flow speeds, capacities and speeds at capacity. Benefits were estimated under fixed demand (which allowed for no network effects, not even reassignment) and under variable demand (a simple negative exponential model, with an elasticity parameter, E,
reflecting an aggregate response to cost changes). The sensItIvItIes of Delta to the following were established: the elasticity parameter E; the volume-to-capacity ratio in the base case, Vo; and the extent of the supply changes brought about by schemes (or 'policy changes' as Williams called them), represented by the difference between pairs of speed/flow curves (the policies are labelled PI to P4). The resulting Delta values are shown in Table 10.1 below.
Table 10.1: Variation of Parameter Delta with Elasticity, Congestion Level and Scheme
| All values of Delta are percentages | ||||||||||||
|---|---|---|---|---|---|---|---|---|---|---|---|---|
| Low Congestion =0.5) (Vo |
Medium Congestion =0.75) (Vo |
High Congestion - (Vo 1.0) |
||||||||||
| Scheme | P1 | P2 | P3 | P4 | P1 | P2 | P3 | P4 | P1 | P2 | P3 | P4 |
| Low Elasticity (E = -0.25) |
-3 | -1 | -2 | -1 | -5 | +3 | +1 | +9* | -9 | +7** | +4* | +31 ** |
| Medium Elasticity (E = -0.75) |
-8 | -3 | -5 | -3 | -16 | +8* | +4* | +25* | -27* | + 17** +11 ** +62** | ||
| High Elasticity (E = -1.5) |
-17 | -7 | -10 | -7 | -34 | +17* | +10* | +43* | -40** +32** +23** +78** |
Source: Williams and Moore (1990).
Note that the asterisks in the table indicate volume-to-capacity ratios in the with-scheme case, as follows: no asterisk - flow below the free flow limit; * - flow between the free flow limit and 900/0 of capacity; and ** - flow within 100/0 of capacity.
10.15 The main findings from this early work are that:
- the value of Delta depends on the elasticity of demand, the initial level of demand, the characteristics of the cost function and the nature of the scheme;
- in about half of the tests, those involving low elasticities or low congestion or both, benefits were within 100/0 either side of the fixed matrix estimate;
- the fixed demand assumption will lead to substantial overestimation of benefits in congested conditions and with moderate to large traveller response, which are the conditions more likely to be found in or near urban areas; and
- low values of Delta or negative values (that is, the fixed demand assumption leading to an underestimation of benefits) are associated with transitions from congested to uncongested conditions, typical of rural schemes.
NETWORK-BASED MODELLING OF CARDIFF
10.16 Williams went on to use a road network model of Cardiff, in order to investigate further the effects of road system improvements in congested conditions. Three road schemes were appraised: a 3-lane bridge over the Taff estuary (H2), a similar 2-lane bridge (H2B), and a part of a distributor road, including the bridge over the Taff (H5) - see Figures 10.2a and b. These schemes were appraised using conventional fixed matrix techniques and using variable matrix techniques, in the form of two direct demand models. These were a negative exponential or variable elasticity model (VEM) and a power function or constant elasticity model (CEM).

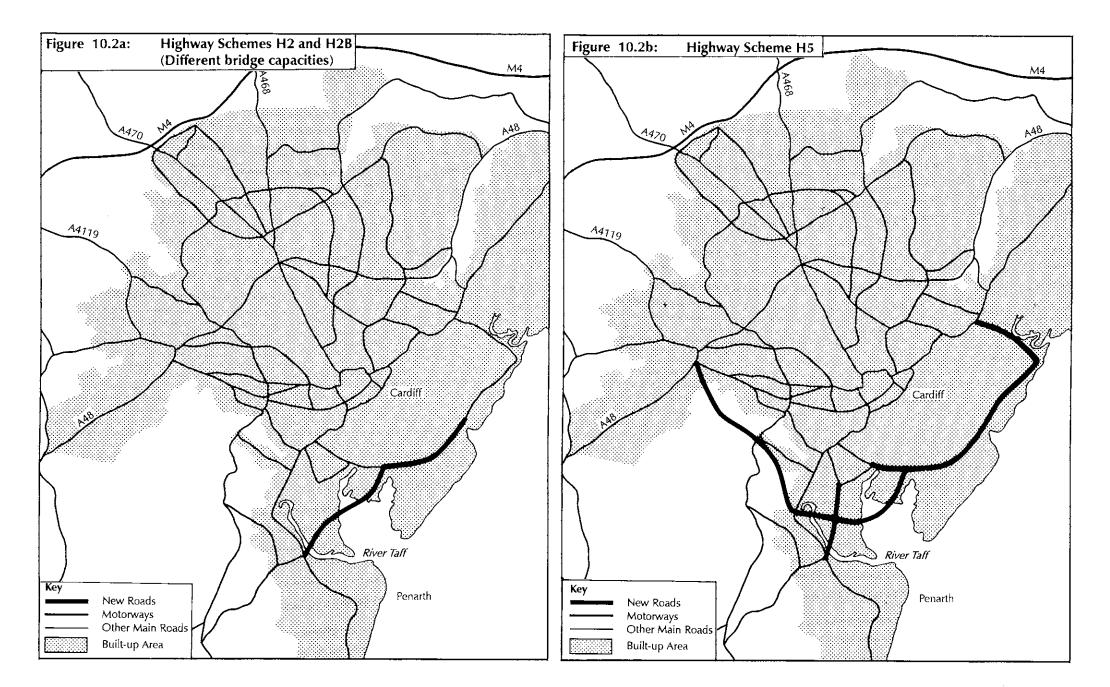
10.17 Reassignment was the only response allowed in the fixed matrix evaluation. In the direct demand models, all forms of response were subsumed within an aggregate elasticity parameter. The sensitivity of Delta to variations in the elasticity parameter (values between 0 and 2.25), the different schemes (H2, H2B, H5), the different model forms (VEM, CEM), and the level of congestion, which was controlled by parameter F (values between 0.5 and 2.0) used to scale the base trip matrix, are presented in Tables 10.2 and 10.3 below.
Table 10.2: Variation of Parameter Delta with Elasticity, Trip Matrix and Scheme Type: Variable Elasticity Model (VEM)
| | All
values
of
Delta
are
percentages
Scheme
type
(see
Figures
10.2a
and
b) | | | | | | | | | |
|-------------------|---------------------------------------------------------------------------------------------------------------|--------|-------|-------|-------|--------|--|--|--|--|
| | | | | | | | | | | |
| | H2 | | | | H2B | H5 | | | | |
| Elasticity
(E) | F=0.5 | F=I.0 | F=I.5 | F=2.0 | F=I.0 | F=I.0 | | | | |
| -0 | | 0 | | | | | | | | |
| -0.1875 | | +5.1 | | | | | | | | |
| -0.375 | | +14.6 | | | | | | | | |
| -0.75 | +17.7 | + 18.6 | +26.7 | +41.9 | +24.9 | + 19.1 | | | | |
| -1.5 | | +32.8 | | | | | | | | |
| -2.25 | | +38.9 | | | | | | | | |
Source: Williams and Lam (1991).
Table 10.3: Variation of Parameter Delta with Elasticity, Trip Matrix and Scheme Type: Constant Elasticity Model (CEM)
| | | All
values
of
Delta
are
percentages | | | | | | | | | | |
|-------------------|---------------------------------------------------------|----------------------------------------------------|--------|--------|-------|--------|--|--|--|--|--|--|
| | Scheme
type
(see
Figures
10.2a
and
b) | | | | | | | | | | | |
| | H2 | | H2B | | H5 | | | | | | | |
| Elasticity
(E) | F=I.0 | F=2.0 | F=I.0 | F=2.0 | F=I.0 | F=2.0 | | | | | | |
| -0 | 0 | | | | | | | | | | | |
| -0.25 | +7.4 | | | | | | | | | | | |
| -0.5 | + 13.3 | +9.5 | + 11.7 | + 11.3 | +10.4 | +7.3 | | | | | | |
| -1.0 | +19.4 | +22.1 | +17.7 | +22.8 | +13.4 | + 15.0 | | | | | | |
| -1.5 | +28.6 | | | | +23.8 | | | | | | | |
Source: Williams and Lam (1991).
- 10.18 The main findings from these tests were that:
- for each of the schemes examined, the disbenefits to eXIstIng traffic due to induced traffic exceeded the benefits which accrued to the induced traffic itself (that is, the Delta-values were always positive), and the fixed matrix benefit estimates, in consequence, overstated scheme benefits; and
- over the range of conditions investigated, the total benefit derived for all the highway schemes was dominated by reassignment effects.
- 10.19 In other research, Williams and Lai (1991) sought to assess the error from calculating benefits under a fixed matrix assumption, when the locational effects of a policy are better represented by a doubly-constrained spatial interaction (DeSI) (that is, trip distribution) model. A variety of highway schemes, as shown in Figures 10.3a to f, were tested.
Figure 10.3: Road Schemes in Cardiff
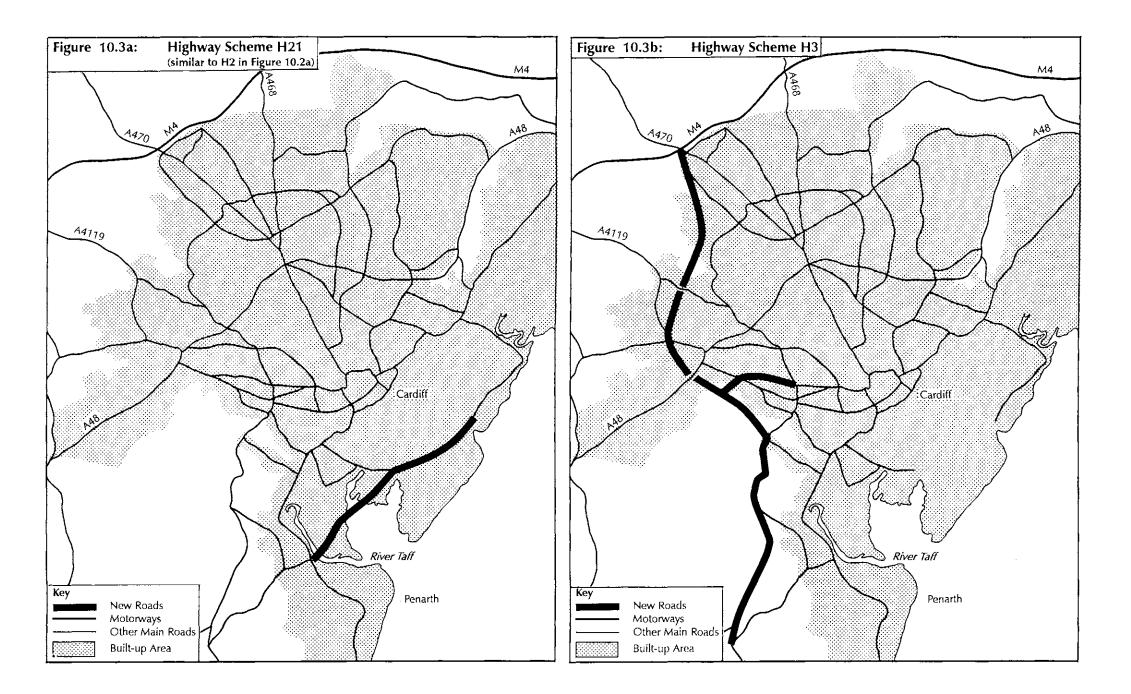
Figure 10.3 continued
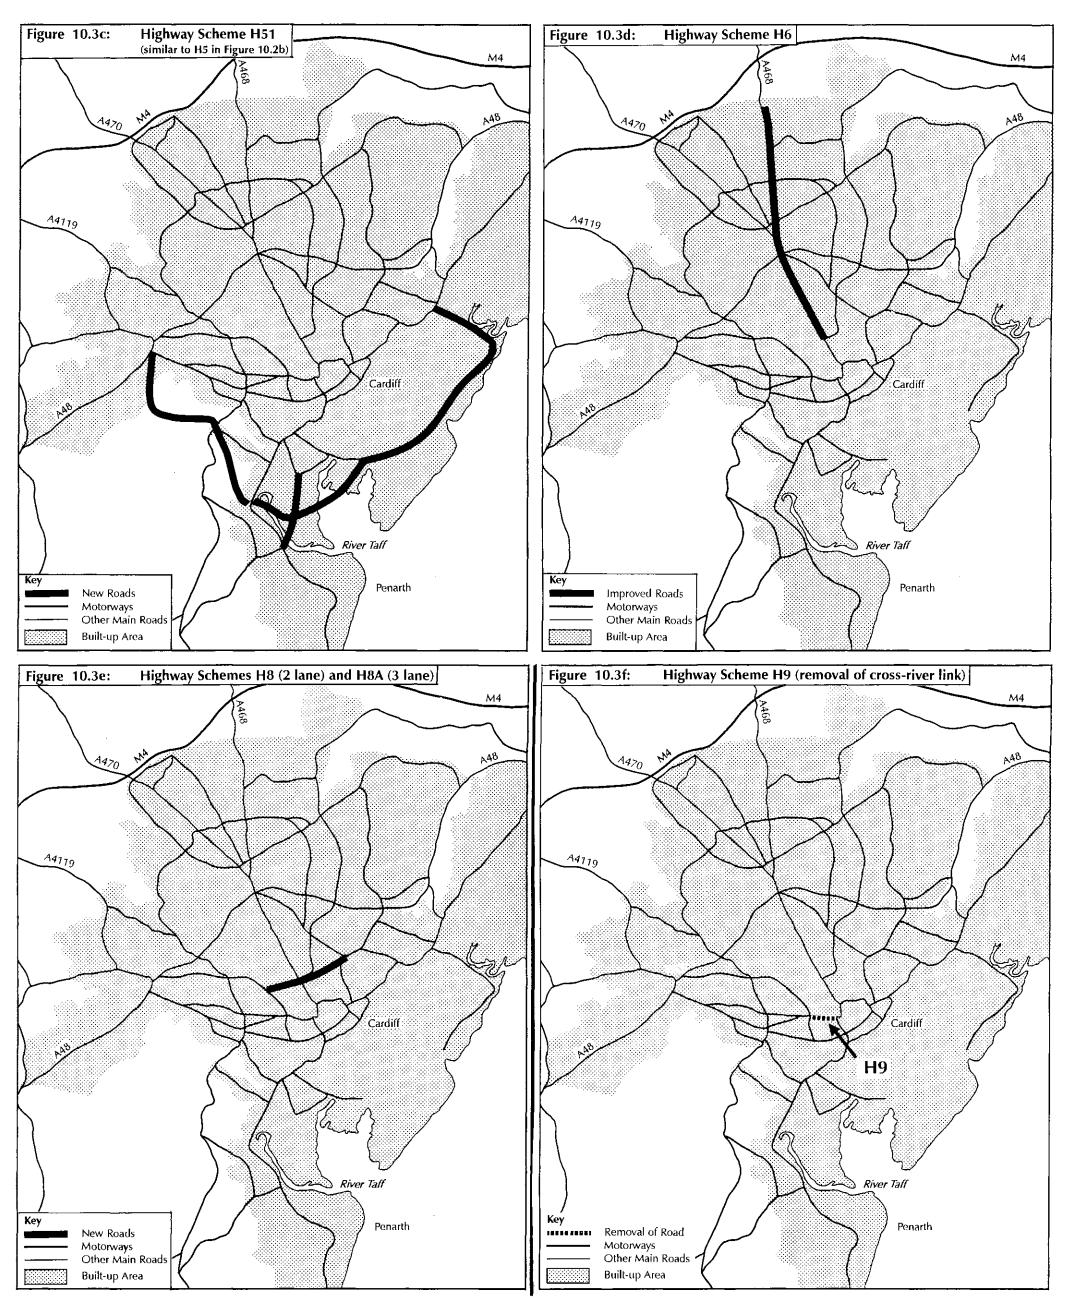
10.20 The Delta-values for these schemes are presented for the constrained DCSI model and unconstrained elasticity models in Table 10.4 below.
Table 10.4: Variation of Parameter Delta with Locational Substitution
| All | Delta values are percentages |
||
|---|---|---|---|
| Scheme | Constrained DCSI model |
Unconstrained VEM =-0.75 elasticity |
Unconstrained CEM =-0.75 elasticity |
| H21 | -9.7 | +17.3 | +10.7 |
| H3 | -0.6 | +27.3 | |
| H51 | +3.9 | +15.8 | |
| H6 | +3.9 | +21.0 | |
| H8 | -9.1 | ||
| H8A | -7.4 | +3.7 | |
| H9 | +1.3 | +19.2 |
Source: Williams and Lai (1991).
- 10.21 The main findings from this series of tests were:
- fixed matrix results may either overstate or understate the benefits derived from the DCSI model, but, for a particular scheme, it was not possible to anticipate the sign of Delta prior to the tests;
- over the whole range of schemes, the maximum value achieved for Delta using the DCSI model was +10%, indicating that change of destination added little to the user benefits derived from reassignment (bearing in mind the fact that, with the DCSI model, there was no net addition of trips to the system to generate substantial congestion disbenefits); and
- the difference between the Delta values for the doubly-constrained spatial interaction (DCSI) model and the unconstrained elasticity model (which represents a wider range of road user responses) ranged between + 10% and +20%, depending on the elasticity parameter and the form of the unconstrained model.
10.22 Williams et al (1991) used a model of Cardiffs public transport system to assess the joint and separate effects of modal transfer and other induced traffic effects. This model was used also to explore the benefits of a public transport scheme to congestion relief. The highway scheme used in these tests was H5 - see Figure 10.2b. Models incorporating a modal choice parameter (1) and a parameter subsuming responses other than modal choice (B) were used in the tests. Different parameter values were applied, as follows:
modal choice parameter values (I-values) of 0.005 and 0.01, where, at average modal costs, a value of 0.005 corresponded to a generalised cost public transport demand elasticity of about -0.8; and
B-values of 0, 0.0025 and 0.005, where a B-value of 0.0025 combined with an 1 value of 0.005 gave a generalised cost elasticity of approximately -1.1.
10.23 The appraisal results, for the highway scheme H5 shown in Figure 10.2b, are given in Table 10.5 below.
| | Parameter
Values | | | |
|------------------------|-----------------------------------------|--------------------------|--|--|
| Modal
choice
(I) | Other
than
Modal
Choice
(B) | Delta-values,
percent | | |
| 0.005 | 0 | +7.7 | | |
| 0.005 | 0.0025 | +13.7 | | |
| 0.01 | 0 | +10.2 | | |
| 0.01 | 0.005 | +27.1 | | |
Table 10.5: Variation of Delta with Modal Substitution
Source: Williams, Lam, Austin and Kim (1991).
The main findings of this study were that the mode transfer effect reduced the fixed matrix estimate of benefit by between 8% and 100/0, depending on the parameter value (1), while other responses then further reduced the benefit estimate by 60/0 to 170/0, again depending on the parameter value (B).
- 10.24 The analysis framework of the work discussed so far was then extended from a single time period to a project life (25 or 30 years), recognising that changes in exogenous variables -for example, car ownership, economic activity - will generate increasing travel demands and, in congested conditions, increasing user costs per trip. The key question addressed was: what are the implications of forecasting traffic and evaluating user benefits derived from a highway scheme, under the assumption that demand is insensitive to travel cost changes (zero elasticity) when the true elasticity is in fact nonzero?
- 10.25 The Cardiff road network model was used to explore these issues of trip suppression and elastic trip induction. Unconstrained elastic equilibrium assignment (EEA) models for demand forecasting and benefit estimation were developed and applied to a specific highway scheme, namely a peripheral road of motorway standard to the south of the city (H5 in Figure 10.2b) to illustrate these effects. Among the findings were the following:
- after 25 years, allowing for growth of 2.5% per annum, with an elasticity parameter of -0.5 in the EEA model, the total number of trips in the system was about 180/0 below the inelastic trip volume, whereas with an elasticity parameter of -1.0, the inelastic volume of trips was reduced by 280/0; and
• estimates of scheme benefit, calculated under elastic and inelastic assumptions, diverged considerably, in that with an elasticity of -0.25 the value of Delta was 28%, but with an elasticity of -1.0 the value of Delta was 50%.
Thus, taken over the lifetime of a project, the EEA models gave rise to significant degrees of trip suppression. Moreover, the erosion of benefits compared to those derived from the fixed trip matrix assumption was also significant, even with a generalised cost elasticity as low as -0.25.
- 10.26 The evidence put forward by Williams and his colleagues relates to schemes in a congested urban area - essentially the peak hour in Cardiff. This evidence shows that, if traffic volumes are in fact elastic with respect to travel costs, the fixed matrix assumption is likely to overstate the true benefits of schemes, that is, Delta-values are invariably positive. However, the following qualifications should be noted:
- a large proportion of the total benefit derived from the highway schemes tested arose from reassignment effects, which are encompassed in a fixed matrix evaluation;
- with medium elasticity and congestion assumptions, the reduction in the fixed matrix benefit estimate was typically of the order of 200/0 to 30%, although under heavily congested conditions and/or high elasticities, the loss of benefits would be greater; and
- for trip purposes which can appropriately be regarded as doubly-constrained (such as journeys to work and school) and which dominate peak periods, a fixed demand model would give a reasonable estimate of global benefits (although this ignores the effects in the long-term of the relocation of home, work and school).
- 10.27 Williams also concluded that failure to take account of the modal transfer effects of highway schemes is likely to lead to the further overestimation of the benefits. Significant overestimation of scheme benefits could be introduced if traffic growth over the life of a scheme were to continue unabated, fuelled by exogenous factors and independent of travel costs.
FOUR-STAGE MODELLING OF BELFAST
10.28 The Belfast model was of a conventional four-stage structure (trip generation, distribution, modal split, and assignment). For the purposes of research conducted for the TRRL into the sources of benefits of urban road improvements, the car ownership projections, the household categorisations synthesised by the trip end model, and the public transport system were taken as fixed and need not concern us here. The trip distribution model was a doubly-constrained gravity model, which operated at the 24 hour level. Separate sub-models were calibrated against local data for each of three trip purposes. The modal split model was a logit model designed to split person trips by basic mode (public and private transport), according to car availability and trip purpose. It operated for the 24-hour period and was calibrated against locally-collected data. Congested road traffic assignment models were calibrated for the peak and interpeak hours, based on the SATURN suite. Equilibrium assignments were performed, using junction simulation in the central area and link-based speed/flow relationships elsewhere. Time was used as the sole basis for route choice.
- 10.29 In the TRRL research, the Belfast model was run for the morning peak period with the following three networks:
- the 2001 do-minimum network which was formed by adding committed improvements to the base year network;
- the do-minimum network plus the Basic Highways Strategy (BHS basically a new crossing of the River Lagan - see Figure 10.4); and
- the do-minimum network plus the Basic Highways Strategy plus the Eastern Approaches Strategy A (EAS A - see Figure 10.4).
The second and third of these networks represent considerable increases in road capacity in some of the most congested areas of the city.
Figure 10.4: Road Schemes in Belfast
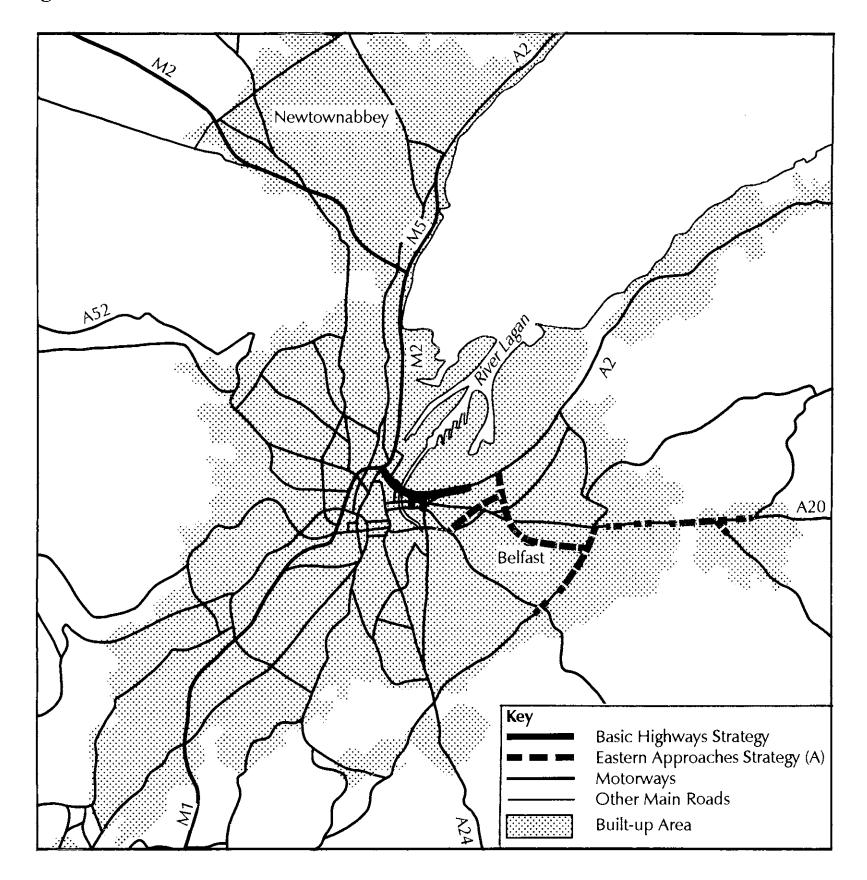
- 10.30 Two levels of demand were modelled with the first and third networks: the 2001 central scenario demands, and the same demands increased by 10%. For the second network, only the lower of the two levels of demand was used. The effects of the distribution, modal split and assignment models in response to the changes from the do-minimum network to each of the other three were isolated, for each of the two levels of demand.
- 10.31 The effects of the various model components on the trip matrices are summarised in Table 10.6 below.
| | | | Number of
sector-level cells different by | | | | | | |
|--------------------|------------------------|----------------------------------|----------------------------------------------|-------------|---------------------|-------------|--|--|--|
| Level of
demand | Network
improvement | Mode
component | Less than
1% | 1% to
5% | 5.1% to More
10% | than
10% | | | |
| 2001 CS | BHS +
EAS A | Redistribution
Modal
split | 171
287 | 88
2 | 16
0 | 14
0 | | | |
| 2001 CS | BHS | Redistribution
Modal
split | 207
289 | 60
0 | 18
0 | 4
0 | | | |
| 2001 CS +
10% | BHS +
EAS A | Redistribution
Modal
split | 171
285 | 84
4 | 14
0 | 20
0 | | | |
Table 10.6: Effects of Model Components on Trip Matrices
Source: Coombe, Leigh and Chua (1989).
10.32 The effects on changes in vehicle-hours, which typically form the bulk of the economic benefits from a road scheme, are shown below in Table 10.7.
| Table 10.7: | Effects of | | Model Components on Vehicle Hours | |-------------|------------|--|-----------------------------------| | | | | |
| | | Percentage change in vehicle hours due to | | | | | | | | |
|--------------------|------------------------|-------------------------------------------|---------------------------------------|------------------------------------|---------------------------------------------------------|--|--|--|--|--|
| Level of
demand | Network
improvement | Reassign-
ment only | Redistri-
bution and
assignment | Modal split
and assign-
ment | Redistri
bution,
modal
split and
assignment | | | | | |
| 2001 CS | BHS +
EAS A | -5.0 | -3.8 | -4.8 | -3.8 | | | | | |
| 2001 CS | BHS | -1.6 | -1.0 | -1.6 | -1.0 | | | | | |
| 2001 CS +
100/0 | BHS +
EAS A | -6.4 | -4.8 | -6.2 | -4.8 | | | | | |
Source: Coombe, Leigh and Chua (1989).
Thus, while the effects of the distribution model were just discernible, those of the modal split model appeared negligible. Translated into monetary values, the redistribution effects of the BHS plus EAS A reduced the economic benefits of this package of road improvements by about 100/0, under both levels of demand. The BHS network and the lower level of demand gave a reduction of about 60/0. (The modelled morning peak hour average speed in the Belfast central area on the 2001 do-minimum network was of the same order as the speeds observed today in many parts of central London.)
ELASTICITY MODELLING OF BELFAST, WEST LONDON AND NORWICH
- 10.33 Various elasticity-based procedures can be conceived which attempt to model the induced traffic effects of urban road improvements. These methods involve making successive adjustments to the demand for travel, in inverse proportion to the change in travel costs, modified by an elasticity value, iterating until the process has converged. (This process is of the type used by Williams (see paragraph 10.16 et seq).) One such elasticity procedure, which modified the trip matrix in relation to the travel time changes brought about by road improvements have been tested during the course of several separate studies using assignment models of Belfast, West London, and Norwich.
- 10.34 The Belfast schemes are shown in Figure 10.4, the West London schemes in Figure 10.5, and those in Norwich in Figure 10.6.
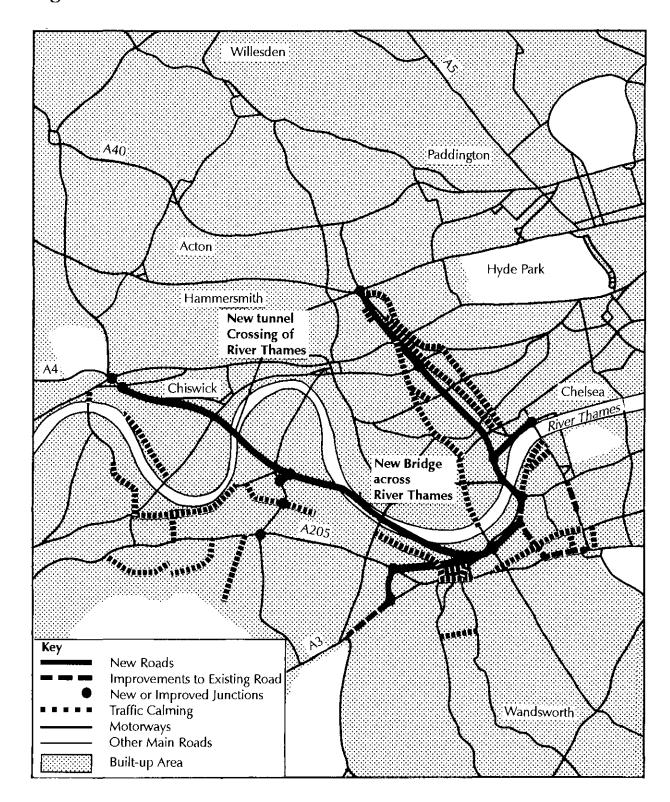
Figure 10.5: Road Schemes in West London
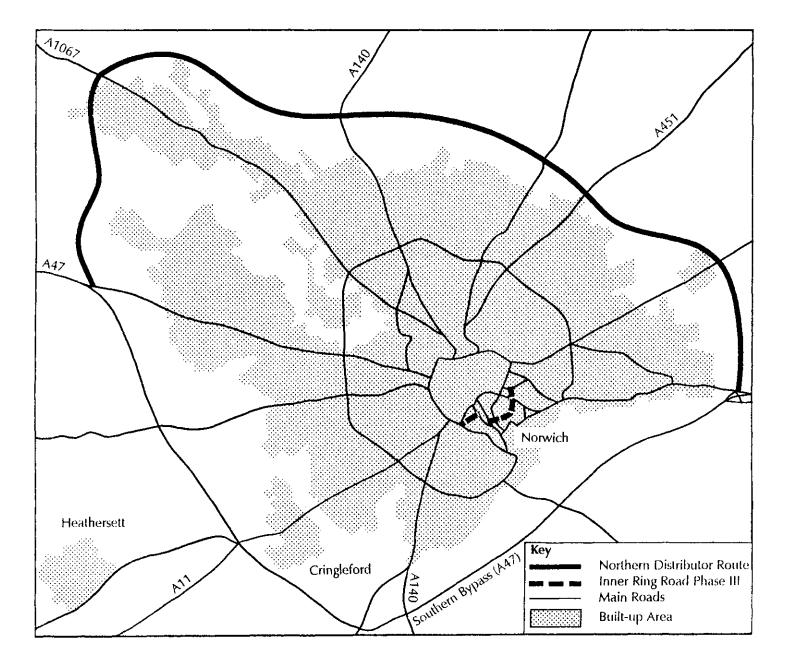
Figure 10.6: Road Schemes in Norwich
- 10.35 In each case, the scale of the changes to the various road networks is substantial. The crossing of the River Lagan in Belfast is now under construction, but we understand that it is unlikely that any greater increment will be added to the city's road system in the foreseeable future. The road schemes in the West London case included two new Thames crossings and other very major new roads, all of which have now been abandoned by the Department as having unacceptable impacts in the area. In Norwich, the two schemes tested are the two main ones in the currently preferred strategy, and we understand that it is very unlikely that anything larger will be built. (Permission for the Inner Ring Road scheme has recently been rejected by the Secretary of State for the Environment.)
- 10.36 The results of the elasticity tests of these schemes were as follows:
- in Belfast, using an elasticity with respect to travel time of -0.5, the changes brought about by the new crossing of the River Lagan and other major road improvements in the eastern corridor of the city resulted in about 2% more trips being assigned to the network, although the fixed matrix economic benefits were substantially reduced;
- in West London, using an elasticity with respect to travel time of -1.0, the changes brought about by the package of major road improvements, including new routes connecting the South Circular to the M41 and the M4, which involved two new Thames crossings, resulted in an overall increase in trips
crossing the study area cordon of just 1%, although this led to an erosion of the fixed matrix economic benefits of 30%; and
• in Norwich, using an elasticity with respect to travel time of -0.5, the changes brought about by (a) the completion of the Inner Ring Road and (b) the provision of a Northern Distributor Route around the north of the built-up area resulted in increases in the numbers of trips assigned of 2.30/0 and 2.9%, respectively, although these increases led to reductions in the fixed matrix economic benefits of 22% and 20%, respectively.
It appears from these tests that, viewed in overall terms, the numbers of additional trips assigned to the networks as a result of including new roads in the modelled networks are quite small. However, we need to set these changes in trip making in an appropriate context.
- 10.37 In Belfast as a whole, the forecast increase in trips by road between 1985 and 2001 was 190/0. In this context, the extra 2% resulting from the new roads could be seen as reasonably significant. The work showed that, keeping the trip matrix fixed, the addition of the new roads would decrease the average trip time from 20.1 to 19.1 minutes, that is, by 5%. (These figures are not focused on the trips affected by the new roads, of course, but include many trips which will be unaffected.) The number of trips assigned to the do-minimum network was reduced through trip suppression from 77,500 to 75,100, that is, by about 3%. The new roads caused the trip matrix to increase from 75,100 to 76,700, that is, by about 2%. (Again, these figures suffer from the inclusion of irrelevant data to the schemes in question.) Comparing the do-something tiip matrix derived by applying elasticities (that is, a variable matrix) with the original fixed trip matrix showed that, of the 289 sector-level cells, 132 showed differences of less than 1%, 130 showed differences of from 1 to 5%, 17 showed differences of from 5.1% to 10%, and 10 showed differences in excess of 100/0. Of course, there may have been larger absolute and percentage changes between pairs of zones, which have been masked in the comparison at sector level. At the sector level, however, all the induced traffic changes can be regarded as being quite small, in relation to the changes which are likely to occur through natural growth.
- 10.38 In West London, over the decade to 1988, traffic levels had increased by between 10% and 200/0, and an increase of another 10% in peak hour traffic levels was forecast up to 2001. If it had been decided to build the new river crossings, it seems unlikely that they would be in place before 2011 at the earliest. Thus, growth to the year of opening would probably be over 20% in the peaks and considerably higher in the interpeak. In this context, the forecast 1% extra traffic induced by the new roads could be seen as quite small.
10.39 In Norwich as a whole, the growth in trips by road forecast for the period from 1989 to 2006 was 550/0 for the 24-hour period and 37% in the morning peak hour after allowance for peak spreading and transfer to park-and-ride. The major one of the two roads - the Northern Distributor Route may not be needed until after 2006. Thus, by the time it is fully open, traffic is likely to have grown still more. Given this context, the extra 20/0 or 3% of trips which would be induced by the new road can again be regarded as quite small in relation to the total growth.
10.40 In the case of the Northern Distributor Route in Norwich, the increase in traffic flow in this road itself was 11% over half its length and between 20/0 to 4% over its other half. Taking a wider corridor would give lower percentage increases than those shown on the new roads themselves. Of the 1,743 links in the model's simulation area, the 2006 flows on 92% of them changed by no greater than 50 pcu/h. In 29 cases, the flows increased by from 101 to 200 pcu/h and, in only 2 cases, the flows changed by more than 200 pcu/h. Given that the scale C?f the new roads proposed in Norwich is substantial, in practical terms, these figures seem to confirm that view that the modelled induced traffic can be regarded as quite small in relation to the growth which is likely to occur anyway.
10.41 The disturbing feature, however, of relevance to our inquiry is that, despite these generally very modest additions to the total demand, they gave rise, in all cases, to very substantial reductions in the economic benefits. This finding is consistent with Williams' work reported earlier. Clearly, if induced traffic were actually larger than this because of effects not allowed for here, such as induced land-use change, the losses of economic benefits would be larger still. However, in recognising this conclusion, we need to emphasise that all these studies were of very congested urban areas.
10.42 There is, however, the question of what the chosen elasticities mean: do they represent all possible user responses, encompassing the total induced traffic in all its forms? or do they exclude certain effects which are estimated explicitly in other parts of the modelling process? There are practical limits to the magnitude of the elasticities which can be used: too large a value and the iterative procedures will diverge, and too small a value and the process will fail to converge satisfactorily. Leaving aside these practical questions, it appears that the general range of elasticities can be defined with some confidence. However, there is little evidence that will enable distinctions to be made about the precise interpretation of the elasticities.
STRATEGIC TRANSPORT DEMAND MODELLING OF BRISTOL
10.43 The strategic transport demand model of Bristol is a multi-modal equilibrium model, which seeks to show how different levels and types of transport investment, combined into overall strategies, would perform with certain land-use and economic growth assumptions. It is based on MVA's START model - see Bates et al (1991). This model has been used to test the effects of charging vehicle drivers for the use of motorways around Bristol (Figure 10.7).
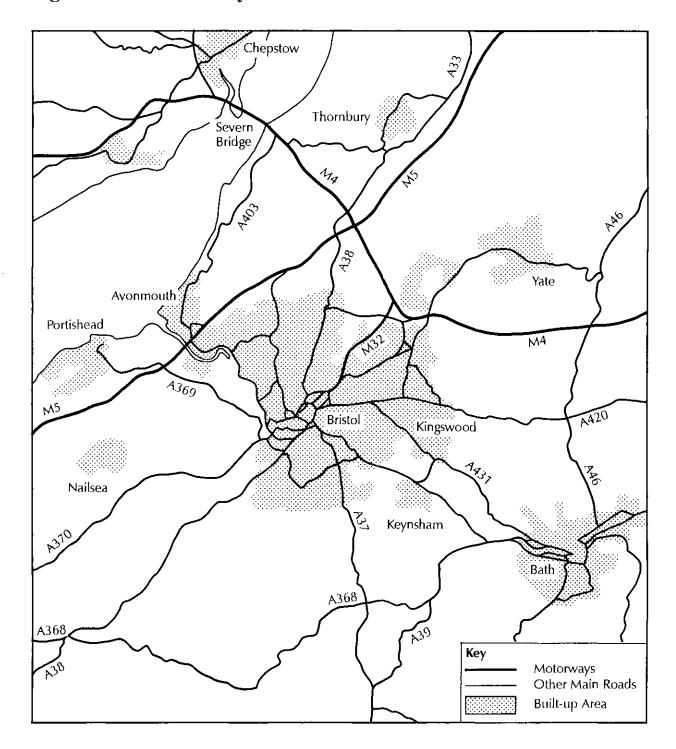
Figure 10.7: Motorways Around Bristol
- 10.44 The application of motorway tolls clearly acts in the reverse direction to the provision of new roads or road improvements; that is, it would tend to suppress traffic rather than induce it. However, we considered that these tests were of relevance to our inquiries because the model explicitly represents more responses to changes in the road system than any of the other models whose results have been submitted to us.
- 10.45 The model runs assumed tolls of 6 pence per km for light vehicles and 15 pence per km for heavy vehicles, with a flat charge of 20 pence being levied on all vehicles as they enter the motorway system. The 6 pence per km was equivalent, on average, to a notional halving of the speed of light vehicles using the motorway. Another way of looking at this is to imagine that the motorway is replaced by a road of considerably lower standard but on the same general alignment - that is, the reverse of improving an existing road to motorway standard.
- 10.46 The effects of this toll structure on the numbers of trips made by each of the various modes are shown in Table 10.8 below.
| | Morning peak | | Off-peak | | All day | | | |
|----------------------|-------------------------------------------------------------------|-------------------------------------------------------------|-------------------------------------------------------------------|-------------------------------------------------------------|-------------------------------------------------------------------|-------------------------------------------------------------|--|--|
| Main
mode | Thousands
of trips after
the
application
of the tolls | Percentage
change from
the base
number of
trips | Thousands
of trips after
the
application
of the tolls | Percentage
change from
the base
number of
trips | Thousands
of trips after
the
application
of the tolls | Percentage
change from
the base
number of
trips | | |
| Car | 217 | -1.7 | 1,166 | -0.5 | 1,623 | -0.9 | | |
| Bus | 31 | -0.8 | 90 | -0.4 | 145 | -0.6 | | |
| Rail | 5 | +18.5 | 12 | +20.4 | 23 | +19.5 | | |
| and
Walk
cycle | 168 | +1.0 | 499 | +0.9 | 728 | +1.0 | | |
Table 10.8: Effects of Motorway Tolls on Total Trips
The overall prediction was a reduction of less than 1% in the number of car trips over the day as a whole, with the suppression effect being more noticeable in the peak. The main modal switch was to rail, which showed substantial increases in its small overall market share.
10.47 The effects were greater when expressed In terms of vehicle-kilometres, as shown In Table 10.9 below.
| Table
10.9: | Effects
of | Motorway | Tolls | on | Car | Traffic, | Overall | and | in | the | Motorway | |
|----------------|---------------|----------|-------|----|-----|----------|---------|-----|----|-----|----------|--|
| | Corridors | | | | | | | | | | | |
| Main mode |
Morning peak | Off-peak | All day | |||
|---|---|---|---|---|---|---|
| Thousands of vehicle- kms after the application of the tolls |
Percentage change from the base vehicle- kms |
Thousands of vehicle- kms after the application of the tolls |
Percentage change from the base vehicle- kms |
Thousands of vehicle- kms after the application of the tolls |
Percentage change from the base vehicle kms |
|
| All cars |
3,085 | -6.0 | 15,126 | -1.6 | 21,398 | -3.2 |
| Cars in motorway corridors |
1,491 | -12.4 | 7,150 | -5.5 | 10,136 | -8.2 |
Thus, the toll structure tested was forecast to cause a shift away from car use of a little more than 80/0 in the corridors directly served by motorways, and a little more than 30/0 overall. The test showed that, in the Bristol situation, the overall effect of quite high levels of charging for the use of motorways would be to reduce car trips and carkilometres by fairly small amounts, with a knock-on effect of degrading the bus system, and a small transfer to the rail system. The deteriorated bus conditions would result in a transfer to walk and pedal cycle. The effects would be concentrated in the peak period, when the rail system provides a good alternative for commuters to central Bristol.
LAND-USE/TRANSPORT INTERACTION DORTMUND AND BILBAO MODELLING IN LEEDS,
10.48 The ISGLUTI work identified nine land-use/transport interaction models. In Phase 2 of the work, an extensive series of policy tests was undertaken using four of the models. The policies tested included additions to, or entirely new, inner and outer ring roads in Leeds, Dortmund in Germany, and Bilbao in Spain (as shown in Figure 10.8). The Dortmund tests were conducted using three models - DORTMUND, LILT and MEPLAN. The tests of Leeds used LILT and MEPLAN, and the Bilbao tests were carried out using MEPLAN only. The ways in which these models work is outlined in Webster and Dasgupta (1991).
Figure 10.8: Road Schemes in Dortmund, Leeds and Bilbao
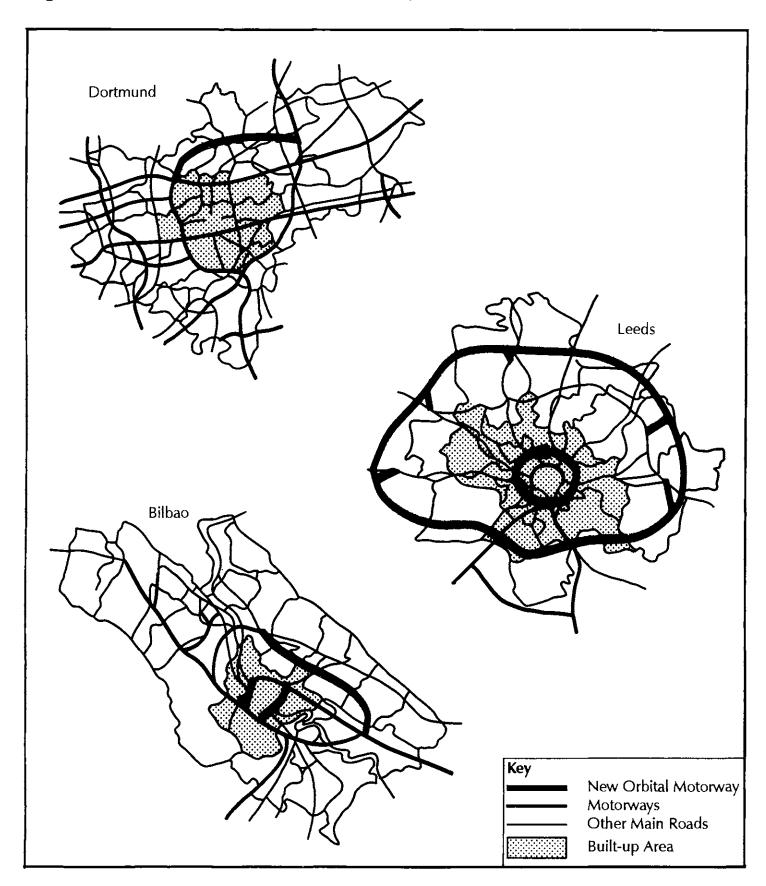
10.49 Webster and Dasgupta considered that the information from the tests:
"shows that the effects are on the whole very marginal. Changes in modal shares are generally about 1% or less, which is perhaps not surprising since all these cities allow reasonable orbital movement at present both near the centre and on the outskirts, though there is some congestion at peak times. However, at zonal level the impacts are quite substantial in some cases, but when averaged over the whole city, or large areas of it (as was required in this analysis because of the vast amount of data collected), the impacts become very diluted. In almost all cases car (and sometimes public transport also) gain at the expense of walk, and mean distances, though not travel times, tend to increase as a result. ".
10.50 These effects arose from two sources. The first source is the normal responses included in conventional transport models, such as modal transfer, trip redistribution, and reassignment. The second source is that the relocation of land-uses in response to the new and improved roads is predicted by the models. Unfortunately, the paper does not give sufficient information to enable us to distinguish the contributions of the two sources; indeed, it is unlikely that the modelling processes would enable them to be separated. What the tests appear to indicate to us, however, is that modelling the landuse changes as well as the responses of travellers does not appear to yield results which are a different order of magnitude from those obtained by conventional transportation models.
LAND-USE/TRANSPORT INTERACTION MODELLING OF A HYPOTHETICAL NEW MOTORWAY
10.51 Marcial Echenique & Partners submitted evidence of their use of the MEPLAN model to investigate the effects of a hypothetical new motorway in a real but unspecified region which contains a large conurbation and a number of smaller urban areas (Williams and Lawlor 1990). Their main conclusions were as follows:
"Firstly, the model results demonstrate the existence of a network effect (on traffic demand). The opening of a new motorway will cause traffic to divert from other competing lower speed roads onto this new motorway. It will, however, also create increased volume of traffic on roads connected to the motorway both through the extra distances that people travel to avail of the quality ofservice offered by driving conditions on the motorway and through the increase in the length of trips induced by the improved accessibility.
In general, the growth in traffic demand created by a new motorway appears to be driven more by land-use effects than by transport effects. The introduction of links allowing high speeds encourages individuals to avail of a wider spatial range ofjob and social activities. This can be achieved with little or no extra expenditure of travel time. The extent to which dispersal takes place is seen from the model results to be greatest in periods when incomes are rising quickly and when fuel costs are low.
A further impact of land-use effects on traffic growth has been demonstrated through the way in which the motorway appears to accelerate
the decentralisation of population while damping the rate of decentralisation of employment, leading overall to a demand for longer trips between home and work.
The study has demonstrated that land-use effects are not only important in determining the pattern of growth of traffic on roads, but that land-use effects on traffic demand resulting from a transport investment may be greater than the pure transport effects. ".
10.52 These conclusions are consistent with the research on travel time budgets discussed in paragraph 4.40 et seq and the evidence on the interations between land-use and transport in paragraph 4.48 et seq.
LAND-USE/TRANSPORT INTERACTION MODELLING IN NORWICH
- 10.53 The interaction between land-use and transport was approached differently in work done by Halcrow Fox and Associates in Norwich. A key element of transport strategy was a new road around the north of the city - the Northern Distributor Route (see Figure 10.9). The road's function was to distribute traffic between the northern radials, and to provide an opportunity to protect suburban residential areas from the intrusive effects of traffic. It lay outside the currently developed area, although it was recognised that the pressures for development of the land between the existing built-up area and the Route could well increase.
- 10.54 The question was: what would be the effect of the potential development shown in Figure 10.9 on the traffic flows expected to use the new road? The evidence reported in Chapter 4 has emphasised the often tenuous nature of any supposed link between road improvements and new land-use developments. Here, instead of attempting to investigate the new development which would arise because of the new road, assumptions were made about the levels of development, simply as tests of the sensitivity of the main forecasts to new developments in the vicinity of the road. The two assumptions were that the available sites, as shown in Figure 10.9, would be developed to 250/0 and 1000/0 of their assumed capacity. The assumptions about the kind of development, and the density of development, which it was postulated for each site, were held constant between the two tests. Thus, the simple assumption was made that the numbers of houses or jobs in the lower development scenario were 25% of those in the higher development scenario.
- 10.55 Feeding these assumptions into the transportation model showed that the total numbers of trips in the matrix would increase by 3% and 15%, respectively with the lower and higher development assumptions. Traffic flows on the new road, however, were predicted to increase by between 11% and 20% with the lower level of development, and by between 35% and 53% with the higher development level. (Flows varied along the length of the new road over the ranges indicated.)
- 10.56 Two points should be noted about this analysis. The first is that the changes in the overall numbers of trips masked more significant changes in flows on the roads. This will be the case, to some extent, with all the model results discussed in this chapter. However, we consider that the difference between the percentage change in the number
of trips in the matrix and the change in the flows on specific roads will be especially marked when the source of the change in trips is located close to the roads being considered, as in this case. The second point is that, over time it is not inconceivable that the sites shown in Figure 10.9 could be developed. If this did turn out to be the case, then the resulting induced traffic would be very significant indeed on the new road in the vicinity of the developments.
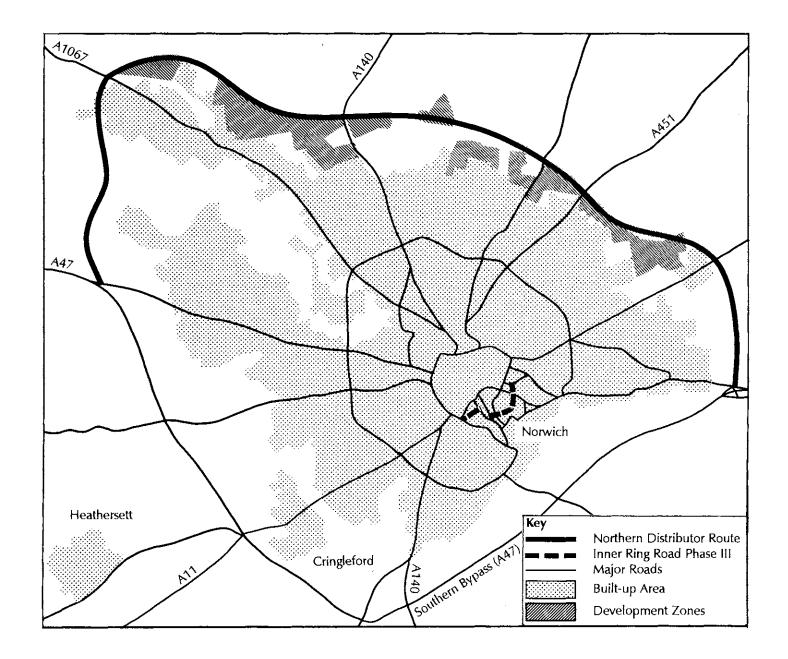
Figure 10.9: The Northern Distributor Route and Development in Norwich
MODELLING OF THE EFFECTS OF CHANGES IN ROAD CONDITIONS ON FREIGHT DISTRIBUTION
- 10.57 Little of the evidence submitted to us related directly to the effects of road improvements on the distribution of freight. One of the submissions described an exercise which employed computer models to investigate the possible responses of distributors to changes in road and traffic conditions (Mackie and Tweddle 1993).
10.58 Three freight operations were studied: a regional delivery from a brewery; a supermarket distribution; and an industrial gas distribution. The exercise involved three steps:
- acquiring an understanding of the distribution operation, the sources of supply, the nature of the on-site operations and investment, and the salient market characteristics;
modelling the eXIstIng distribution operations using commercially available vehicle routeing and scheduling programs, which included a depot location module; and
examining the impact of changes in the road network quality on the optimum distribution systems and their costs of operation.
10.59 The main findings of this work were as follows:
- in these three case studies, while there were no sharply-defined optimal distribution systems, with small numbers of depots, system costs were sensitive to depot location;
- in two of the three cases, a large change in network quality (modelled as a decline in traffic speeds on the motorways and dual carriageways to equal those on single carriageway A class roads) did not change the optimal depot configuration;
- although the results were volatile, it was clearly the case that cost savings in the distribution system may be significantly in excess of the transport cost savings in certain circumstances; and
- these excess savings arise from a mixture of reallocation of customers between depots, relocation of depots, and changes in depot numbers.
10.60 This study therefore demonstrated the potential for quality changes in the road network to affect the pattern of freight movements. The authors concluded that the assessment method employed in COBA, which takes into account only the direct cost savings that accrue to operators of commercial vehicles, probably underestimates the total benefits that are realised. Where transport costs form a large part of the total distribution expenditure of a company, the proportionate savings are likely to be larger. However, the authors warn that the role of road network improvements in the physical distribution revolution should not be exaggerated, as other factors also have considerable effects on system costs.
CONCLUDING REMARKS
- 10.61 We have presented evidence in this chapter on some analyses carried out using a theoretical single link model, models of six actual areas in this country: Cardiff, Belfast, Norwich, London, Bristol and Leeds (plus Dortmund in Germany and Bilbao in Spain), and a model of an unspecified region to test a hypothetical scheme. Apart from Williams' theoretical single link model and the model of the unspecified region, all the other models were of congested urban areas. None of the evidence therefore relates to the actual trunk and primary route interurban network; this is a serious deficiency of the evidence presented to us, since much of the Department's Road Programme falls into this category.
- 10.62 In five of the urban areas, the effects of major new road schemes have been estimated. The road schemes in Cardiff, Belfast, Norwich, London and Leeds all involved new river crossings in congested parts of these cities as well as, in some cases, substantial additions
to the road system on the periphery of the areas. In the fifth case, Bristol, the tests reported here were equivalent to replacing existing motorways with much reduced standard roads, again corresponding to a major change to the road system.
- 10.63 Although there are conflicting messages about the scale of the individual forms of induced traffic, the clear impression is that the magnitude of the estimates of induced traffic, produced by models of a variety of forms, is not large overall. One apparent exception to this finding relates to Cardiff, where Williams reported significantly greater proportionate increases in trips than were reported in other studies. We can find no ready explanation for this, and moreover, it is difficult to normalise all the modelled effects to some common basis.
- 10.64 The effects may be more significant in the corridors directly affected by the road proposals. This can be seen from the tests of the effects of development adjacent to the Northern Distributor Route in Norwich, where the overall increases in trips were much lower than the increases in traffic flows on the new road. (We must also remember in this case that the researchers were simply asked to estimate the effect on traffic flows if development took place near to the new road on the scale assumed; there was no implication in their work that the new road would cause development of the scale tested.)
- 10.65 Turning to the effects on economic benefits, where researchers have estimated the effects of modal transfer and redistribution, the changes in benefits have been shown to be quite modest. In the case of modal transfer, this is because the implied elasticities in the cases examined were quite low. In the case of trip redistribution, the implied elasticities were greater, but there would be offsetting effects as trips are redistributed from more congested areas to less congested parts of the network. However, where elasticity methods have been used, all in congested urban areas, using elasticities sufficiently large to capture all the induced traffic effects, very substantial reductions in benefits have been shown, consistently by all researchers.
- 10.66 We have reported, in paragraphs 4.05 to 4.07, evidence which suggests that the elasticities implied by transportation models calibrated against cross-sectional data are likely to be lower than real-life elasticities. The values of the elasticities employed in the elasticity modelling work are generally comparable with those derived from surveys of real-life elasticities, as reported in the literature. It is to be expected, therefore, that the elasticitybased analyses will show larger reductions in economic benefits than analyses undertaken using conventional modal choice and trip distribution models.
10.67 It is also worth noting here the nature of the mathematics involved in calculating the economic benefits of a road scheme. Typically, the bulk of the economic benefits will derive from time savings: hence, for simplicity, we can concentrate here on changes in total vehicle-hours. As an example, consider the first row in Table 10.7 from HFA's Belfast study, where we can see that reassignment alone caused a reduction in vehicle-hours of 5.0% (that is, from 22,570 in the base case to 21,445 in the with-scheme case). Because the vehicle-hour figures in the base and with-scheme cases are so similar, a small percentage change in the with-scheme vehicle-hours will result in a much larger change in the difference between the base case and with-scheme vehicle-hours.
10.68 We consider this to be the nub of what these model tests are telling us about the effects of induced traffic: namely, that small changes in traffic, in congested urban areas, will result in large changes in economic benefit, and that this is an inescapable result of the nature of the mathematics involved, which confirms the conclusions of the qualitative analysis presented in Chapter 9. If we regard the percentage reduction in economic benefits due to induced traffic as substantial, then we must recognise that the percentage reduction in Net Present Value, which is the crucial indicator of scheme worth used by the Department, will be much greater. The absolute reduction in the Present Value of Benefits is the same as the absolute reduction of the Net Present Value, but as the latter is always smaller than the former, the percentage reduction of the latter is always larger than the former.
10.69 As far as the effects of road system improvements on freight movements are concerned, there is some evidence that the actual benefits exceed the direct travel cost savings normally included in the economic evaluations.
10.70 Williams et al (1991) came to the conclusion that, insofar as current procedures for the appraisal of highway schemes in urban areas do not allow for the full range of trip response, they can be said to be flawed. Of more interest is the degree of error introduced by weaknesses in procedures. The circumstances where errors are likely to be greater will be:
- when congestion is greater as is usually the case in urban areas compared with rural areas;
- for those trip purposes, and in conditions where user behaviour is more responsive to changes in travel costs - again, this is usually the case in urban areas compared with rural ones;
- if traffic growth over time were assumed to be solely a function of exogenous factors and independent of travel costs;
- where a significant proportion of the response is new traffic, whether due to trip generation or mode transfer or induced land-use changes.
REFERENCES
Bates J, Brewer M, Hanson P, McDonald D and Simmonds D (1991). Building a Strategic Model for Edinburgh. Proceedings of PTRC Summer Annual Meeting.
Coombe D, Leigh S and Chua H (1989). The Sources of Benefits from Urban Road Improvements. Proceedings of PTRC Summer Annual Meeting.
Coombe R D, Forshew I G and Bamford T J G (1990). Assessment in the London Assessment Studies. Traffic Engineering and Control 31(10): 510-518.
Coombe D (1992). Proof of Evidence on Induced Traffic given at the Public Inquiry into Norwich Inner Ring Road Phase III.
Halcrow (1989). West London Assessment Study: Stage Two: Report on Options. Report for the Department of Transport by Sir William Halcrow and Partners Ltd, Halcrow Fox and Associates, Shankland Cox and Robert Adams, paragraphs 9.4 to 9.9.
Halcrow Fox and Associates (1992). Norwich Area Transportation Strategy: Final Report. Report for Norfolk County Council.
Mackie P J and Tweddle G (1993). Measuring the Benefits Gained by Industry from Road Network Improvements. Institute for Transport Studies, University of Leeds, Working Paper 391.
The MVA Consultancy (1993). Inter-Urban Charging: Case Studies. Summary Report for the Department of Transport.
Webster F V and Dasgupta M (1991). Land Use and Transport Interactions: Report of the ISGLUTI Study. Transport and Road Research Laboratory Contractor Report 295.
Williams H C W L and Moore L A R (1990). The Appraisal of Highway Investments Under Fixed and Variable Demand. Journal of Transport Economics and Policy 24: 61-81.
Williams H C W L and Lam W M (1991). Transport Policy Appraisal With Equilibrium Models I : Generated Traffic and Highway Investment Benefits. Transportation Research 25B(5): 253-279.
Williams H C W Land Lai H S (1991). Transport Policy Appraisal With Equilibrium Models II : Model Dependence of Highway Investment Benefits. Transportation Research 25B(5): 281-292.
Williams H C W L, Lam W M, Austin J and Kim K S (1991). Transport Policy Appraisal With Equilibrium Models III : Investment Benefits in Multi-Modal Systems. Transportation Research 25B(5): 293-316.
Williams H C W L and Yamashita Y (1992). Equilibrium Forecasts of Travel Demand and Investment Benefit Measures for Congested Transport Networks. Proceedings of PTRC Summer Annual Meeting.
Williams H C W L and Yamashita Y (1992). Travel Demand Forecasts and the Evaluation of Highway Schemes Under Congested Conditions. Journal of Transport Economics and Policy XXVI(3): 261-282.
Williams I and Lawlor C (1990). Growth of Traffic on Motorways and Other Trunk Roads. Volume 1: Analysis of Trends. Report to the TRRL.
PART IV
CONCLlISIONS FROM THE EVIDENCE AND THE IMPLICATIONS OF INDUCED TRAFFIC
In this chapter, we summarise our main findings from Parts II and III, an,d lay the foundations for our recommendations in Part v.

CHAPTER 11: CONCLUSIONS FROM THE EVIDENCE AND THE IMPLICATIONS OF INDUCED TRAFFIC
INTRODUCTION
- 11.01 At the end of Chapter 2, four main questions were identified which our Terms of Reference required us to answer. These are:
- does the provision of new or improved trunk roads and motorways give rise to induced traffic - is it a real phenomenon?
- if so, are the consequences in terms of the planning, design and evaluation of such road schemes significant - does it matter?
- if so, for which types and categories of major highway improvement is induced traffic likely to be significant - where and when does it matter most?
- how should the current forecasting and appraisal methods be amended to allow for induced traffic - what needs to be done?
In this chapter, we summarise the Committee's answers to the first three of these questions.
- 11.02 When reviewing these matters, an important question is what is the appropriate standard on which to arrive at a judgment? For a subject riven with the complexities of human behaviour and overlain with the difficulties of observation and measurement, we think that the appropriate standard is the balance of probabilities. In arriving at our view, we have had regard to a mixture of empirical evidence, economic logic and mathematical modelling work.
- 11.03 In its evidence to us, the Department has placed great weight on the need for consistency and robustness in road scheme assessment. We accept this. An important question is whether the Department's economic evaluation procedures are themselves consistent and robust. In other words, if the magnitude of induced traffic is uncertain, the Department may need to be in a position to test the sensitivity of scheme economics to its presence.
IS INDUCED TRAFFIC A REAL PHENOMENON?
- 11.04 If this question is posed at the macroscopic level has development of the motorway and trunk road programme over the last 30 years influenced the number and pattern of vehicle trips on the system? - our answer is an unequivocal "yes". Any other response defies credibility. If the question is posed at the microscopic level - does the provision of a particular new road scheme influence the number and pattern of vehicle trips on the relevant part of the network? - the answer is less clear cut.
11.05 It might be thought that the appropriate test is whether induced traffic is a phenomenon which can be observed on the ground. Where the existing network is sparse and a large change in network quality occurs as a result of a scheme (for example, the Humber
Bridge), significant quantities of induced traffic are unambiguously observed. However, such cases are the exception rather than the rule.
11.06 In the more general case of incremental improvements to the network, reliance on direct observation is more problematic for the technical reasons given in paragraphs 4.03 and 4.04. Evidence from traffic counts and surveys is inherently subject to a variety of sources of error, both in measuring what happened and in assessing what would otherwise have happened in the absence of the scheme. Therefore, it is necessary to refer to a wide range of direct and indirect evidence and to come to a view about the balance of likelihood.
11.07 The indirect evidence is addressed in paragraphs 4.11 et seq. Of this evidence, we find two of the lines of argument particularly powerful.
11.08 The first is the logical relationship between the elasticity of vehicle-kms travelled to fuel prices repeatedly found in the literature (though with a range of values), the monetary values of time and operating costs used in economic appraisal and the elasticity (responsiveness) of vehicle-kms to changes in the generalised user costs of travel. Unless either the elasticity of vehicle-kms with respect to fuel prices is zero or the value of travel time is zero, the elasticity of vehicle-kms with respect to travel time cannot logically be zero. If network conditions improve and user costs fall, the volume of traffic should logically respond.
11.09 The second piece of powerful indirect evidence is the observed phenomenon that over a long period, traffic growth rates have been slowest where congestion is worst and fastest where there is still spare capacity or where new capacity is provided. Association does not prove causation, but the evidence is at least consistent with the possibility that new capacity, by raising network quality, will indeed induce some vehicle-kms which would not otherwise take place.
11.10 Other sources of indirect evidence, such as the views of the public and professionals, are relevant supporting evidence but are not, by their nature, conclusive.
11.11 The direct evidence from traffic counts on improved roads is reviewed in Chapter 5. Perhaps the most famous instance where the provision of new capacity is alleged to have induced traffic is the completion of the M25. The findings of the Department's M25 Review, carried out by consultants, lead us to conclude that the M25 experience most probably does serve as an example of a case where 'roads generate traffic', although the overall size of the effect and its composition in terms of, for example, redistribution, mode shifting, increased frequency of travel and trips to and from new developments, is uncertain.
11.12 The Department of Transport's monitoring reports of forecast and observed traffic is also a very important piece of evidence, both in its own right and because of its influence upon the Department's thinking. The Department's view is that, if induced traffic was important but had been wrongly ignored at the time of making the forecasts, there would be a general tendency for observed traffic to be higher than the forecasts (that is, the forecasts would be underestimates). The Department's general conclusion for many years has been that "there is no evidence ofsuch an effect" (paragraph 5.10).
(More recently, the Department has modified its view to: "For most schemes, there is no clear evidence of such an effect at scheme level. However, it may have been a factor resulting in underprediction for a limited number ofschemes. " (paragraph 5.19).)
- 11.13 The interpretation of this evidence is very important indeed, because it is almost the only evidence available to the Committee specifically on British interurban trunk road schemes. The Committee is not convinced by the Department's interpretation in its scheme monitoring reports (Department of Transport 1993) for four main reasons:
- The conclusion rests upon the legitimacy of the NRTF correction which, in turn, relies on the assumption that the general growth rate of traffic represented by NRTF is independent of the rate of investment in the network. We spelled out our criticisms of this assumption in paragraphs 5.09 to 5.21.
- The after data are collected one year after the scheme is in place. This is much too short a time for all behavioural responses to have occurred. In particular, if the purpose of the scheme is to permit traffic growth to be accommodated, for one or two decades ahead, a sudden surge of induced traffic on opening is unlikely. Rather, one would be looking for differential growth occurring gradually over time.
- The Department's studies are, for budgetary reasons, confined to the new road and its immediate competitors, including the old road it replaces. The denser the network, the greater the possibility of ripple effects beyond the screenline, which make the results impossible to interpret.
- The Department's overall conclusion is derived from a mixture of overpredictions and underpredictions. Accepting for the purposes of argument the Department's position, there is still the possibility that induced traffic may be occurring in a significant proportion of schemes (generally where underprediction occurs), and quite different reasons may be accounting for overpredictions (for example, planned development that has failed to materialise).
The Department has accepted these points, while maintaining that making the NRTF correction is legitimate for their purposes of comparing predicted and actual traffic flows on newly-opened schemes.
- 11.14 Overall, we conclude that many of the reasons for advocating caution in the interpretation of before and after studies apply to the Department's work. This is not to deny the usefulness of doing before and after studies. But we do not accept that the Department's interpretation of its results as being soundly based in their rejection of the induced traffic hypothesis.
11.15 The studies of urban roads conducted by a variety of authors (most of which argue in favour of the hypothesis) are equally subject to interpretation. The studies are variable in quality of design and execution and in the level of resources devoted. They, too, are subject to the methodological difficulties outlined above. Our best interpretation of this evidence is as follows:
First, the circumstances of a particular scheme matter. Response of traffic overall may be affected by upstream or downstream bottlenecks, by parking or traffic management policies.
Secondly, there is strong evidence of trip retiming as an important response to new urban road capacity.
Thirdly, that, in so far as a pattern exists, there tends to be some traffic growth variable case by case, which is not simply reassignment within the immediate network. This must be either reassignment over a wider area or induced traffic or a mixture of both.
11.16 Considering all the sources of evidence in Chapters 4 and 5, our answer to the first question is that induced traffic can and does occur, probably quite extensively, though its size and significance is likely to vary widely in different circumstances.
11.1 7 We are not able to advise the Department, in general terms, about the composition of induced traffic in terms of, for example, new trips, redistributed trips, transfers between modes, and trips associated with new developments. The composition will depend on the circumstances. There is evidence to suggest, however, that trip retiming is an important behavioural reaction to changes in road capacity, second only to changes of route.
DOES INDUCED TRAFFIC MATTER?
- 11.18 In Chapters 6 and 8, the Department's approach to traffic forecasting and economic evaluation of trunk roads is set out. With rare exceptions, in scheme appraisal, the level and pattern of demand is assumed to be independent of the quality of the network this is the fixed trip matrix assumption. Allowance for induced traffic could have implications for all types of appraisal:
- operational appraisal the chosen design might be sensitive to the addition of induced traffic;
- environmental appraisal the environmental performance of schemes might be sensitive to induced traffic; and
- economic evaluation the economic performance of schemes might be sensitive to induced traffic.
- 11.19 The implications of induced traffic for economiC evaluation are discussed in the Department's COBA 9 Manual, Chapter 1, which provides a useful reView of the subject. The position taken in the COBA 9 Manual is as follows:
- for a wide range of schemes, the fixed matrix is a reasonable approximation to true user benefits;
- however, in exceptional cases such as estuary or mountain crossings, where large cost changes occur, failure to allow for induced traffic may significantly
understate true user benefits, and the COBA 9 Manual states - and we agree that variable matrix methods are required in such cases; and
- in cases where the network improvement stimulates additional traffic and this additional traffic affects travel conditions, partially recongesting the network, failure to allow for induced traffic may lead to an overestimate of the user benefits of schemes - this is the case of partial filling-up.
- 11.20 In response to this position, we believe as a matter of principle that:
- the COBA fixed matrix assumption is conservative only if traffic growth is fully caused by external factors (such as income growth) and is unrelated to network quality;
- it is crucial for scheme appraisal that the do-minimum is represented by equilibrium flows and costs that are realistic and achievable in the absence of the scheme;
- only in the limiting case of total and immediate filling-up of a new road by traffic, with no relief elsewhere in the network, would the user benefits be entirely eroded; and
- in the more general case of partial filling-up, the erosion of user benefits may well be sufficient to cause the fixed matrix assumption to be neither conservative nor robust (network conditions are nowadays such that this case is increasingly common).
This last category has been extensively considered in the modelling work by academics and consultants over the last few years. This work has focused mainly on congested urban conditions, but the logic suggests that it is the extent of capacity utilisation rather than whether or not the area is urban which is critical.
11.21 The conclusions which we distil from the evidence presented In Chapter 10 are the following:
- Modelling work tends to suggest that the scale of induced traffic may be modest in relation to the base levels of existing traffic.
- However, this must be a function of the size of the study area modelled, the scale of the scheme, the behavioural responses modelled and the values adopted for the model parameters.
- Even modest amounts of induced traffic can have serious negative effects on the estimated user benefits in congested network conditions. This is because a small increase in absolute vehicle-hours caused by induced traffic has a large effect on the value of the change in vehicle-hours between the do-minimum and dosomething.
The effect on the Net Present Value (NPV) of the scheme is, in turn, far greater proportionately than the effect on the Present Value of the Benefits.
Lastly, the errors associated with the fixed demand assumption will be greater the more heavily congested are the conditions and the more elastic is the response in travel demand to travel costs.
11.22 We conclude, therefore, that both economic logic and modelling studies demonstrate convincingly that the Net Present Value of a scheme can be sensitive to the treatment of induced traffic. This matter is of profound importance to the value for money assessment of the Road Programme.
WHEN AND WHERE DOES INDUCED TRAFFIC MATTER MOST?
- 11.23 We are now ready to answer the third question in paragraph 11.01. We consider that induced traffic is of greatest importance in the following circumstances:
- where the network is operating or is expected to operate close to capacity;
- where the elasticity of demand with respect to travel costs is high;
- where the implementation of a scheme causes large changes in travel costs.
This suggests that the categories of road where appraisal needs to be most careful are roads in and around urban areas, estuary crossing schemes, and strategic capacityenhancing interurban schemes (including motorway widening). We accept that the last category is included on the grounds of logic rather than modelling evidence. Indeed, this is an important gap in understanding which needs to be filled. Although the argument of the report is in terms of COBA, the conclusions apply equally to QUADRO benefits.
- 11.24 We believe that our conclusions are consistent with the principles of economic appraisal of roads expressed, for example, in the COBA 9 Manual. We think the problems have arisen with appraisal practice for two main reasons:
- First, over the last 10 years and particularly since the 1989 NRTF reVISIon, problems of congestion on the trunk road network have become much more prevalent and the consequences more crucial for the appraisal process. The partial filling-up case, in which suppression occurs in the absence of new capacity, has become relatively common.
- Secondly, the COBA, URECA and QUADRO programs exist only in fixed matrix form. In practice, the Department's advice has been that, in general, fixed matrix methods provide sufficiently robust economic evaluation results for the decisions for which they are required. Only in very exceptional cases, such as estuary crossing schemes, has the Department in recent years advised that the sensitivity of appraisal results to the fixed demand assumption needs to be tested.
We do not think this advice meets the tests of caution and robustness in scheme appraisal which the Department has set itself. There is, therefore, a need for a change in appraisal practice. In Chapters 12, 13 and 14 of the Report, we answer our fourth question - what needs to be done to take proper account of induced traffic in the appraisal of trunk road schemes?
REFERENCES
Department of Transport (1993). Comparison ofForecast and Observed Traffic on Trunk Road Schemes. Highways Economics and Traffic Appraisal Division.
PART V
THE WAY FORWARD
Chapters 12, 13 and 14
In Chapter 12, we establish the need for changes to be made to current procedures. Then, in Chapter 13, we set out our main recomme;t)ldations for change. Our key proposals are that the Department should adopt a more strategic approach to the planning and appraisal of the national roads programme, and should recognise the close relationship between the quality of the road network and the amount of traffic. We recognise that it will take some considerable time to implement our recommendations In full and, In Chapter 14, we offer some interim recomm\endations which will enable the Department to begin to improve its methodology before the procedures set out in Chapter 13 are fully developed.
CHAPTER 12: THE NEED FOR CHANGE
INTRODUCTION
12.01 In the previous chapter, we came to the conclusion that there is likely to be a significant proportion of the schemes in the Department's Road Programme where the possibility of induced traffic is real and cannot safely be ignored. In Chapter 6, we set out the Department's current traffic forecasting procedures. Our purpose in this chapter is to analyse how and why current procedures are deficient in dealing adequately with induced traffic. We set out our recommendations as to what changes should be made to current appraisal policy and practice in the next chapter.
THE CURRENT PLANNING PROCESS FOR TRUNK ROADS
- 12.02 The Department of Transport (through the new Highways Agency) is directly responsible for the trunk road network. This network caters predominantly for interurban movements, although there are some trunk roads which lie within urban areas. Instances where these occur include strategic routes through large conurbations or connections to ports. Although the development of trunk road improvements within urban areas is a matter for the Department, the responsibility for formulating and implementing transportation strategies for urban areas lies with the local authorities.
- 12.03 Route Identification Studies are generally undertaken as the first step in planning new motorways (and other strategic routes). The idea is to choose the alignment which would provide most relief of traffic in the settlements along the corridor, which maximises the Net Present Value, and which minimises the environmental impacts of the new motorway itself. (It is appreciated that these objectives sometimes conflict.) Having established the general line, the route is then divided into schemes of more manageable length for individual design, appraisal and (in due course) construction.
- 12.04 The Department regards the motorway network as largely complete, although some additions are still being considered. One example is the extension of the M6 northwards to Scotland in the form of the M74, although this is largely an upgrading of an existing trunk road route to motorway standard. Another example is the upgrading of the Al to motorway standard between Leeds and Newcastle. The emphasis in the current Road Programme is on widening existing motorways rather than building new ones.
- 12.05 Long-established trunk roads generally connect settlements and through traffic using them causes congestion and environmental nuisance within the settlements themselves. The response from the Department has been to promote the idea of bypasses to these settlements. When these are then joined up with new sections of road, a new road emerges, close to and largely parallel to the old trunk road. There have been occasions when the Department has taken a more fundamental look at the way in which the traffic and environmental problems in a trunk road corridor should be tackled, such as the recent investigation of routes across the Pennines. Route Identification Studies, such as those for new motorway alignments, are designed to determine the best general route within a corridor that should be developed. However, this more strategic approach appears to have been used rarely in recent years. Instead, the process of joining individual improvement schemes together seems to be have been the approach more
commonly adopted. A good example of this IS the progressIve development of the A30/A303 from London to Penzance.
OUR CONCERNS ABOUT THE CURRENT APPROACH TO THE PLANNING AND APPRAISAL OF THE TRUNK ROAD NETWORK
- 12.06 Our concerns about the Department's current approach relate to three levels of planning and appraisal, namely: national; regional or strategic; and individual schemes.
- 12.07 From our summary of the current trunk road planning process given above, it is our understanding that the Department's Road Programme emerges largely from a consideration of schemes designed to address specific, relatively localised problems. Although in some instances a strategic approach to an area or corridor has been taken, the Department does not appear to address the fundamental question of what the appropriate scale and coverage of the trunk road network should be, taking the country as a whole.
- 12.08 In SACTRA's 1992 Report, which was concerned with assessing the impact of trunk road schemes on the environment, the importance of making a policy assessment of the national trunk road network was stressed. It was argued that a broad range of environmental issues could only be considered properly at that level. The Department accepted these recommendations in their response to that Report.
- 12.09 The Government's objectives for trunk roads (given in paragraph 2.04) indicate that trunk roads are seen as means of influencing economic growth and, by implication, land development. It seems important to us that the policy for improving the national trunk road network provides general support for national economic development policies. In our view, this requires that national traffic forecasts take full account of the effects of economic development, including any traffic induced by the Road Programme. It is also necessary, in our view, to ensure that, in broad terms, the national road network is of an appropriate scale for the expected demands, and that major imbalances, such as between the capacity of the interurban and urban networks, are addressed.
- 12.10 At the strategic level, our understanding is that the Department does not, as a matter of course, assess whole routes before dividing them into schemes. In our opinion, environmental, land-use development, traffic and economic appraisals all need to be made at the strategic level in order that the best overall route can be selected.
- 12.11 In the 1992 SACTRA Report, it was argued that routes should be assessed in their entirety, so that the full environmental implications of the options for the entire route can be appraised in some detail. This is necessary if (in future) cases such as the M3 cutting through Twyford Down are to be avoided. The situation had been reached where the rest of the M3 had been built, and the Twyford Down scheme was the last link required to complete the whole motorway. The options for aligning this last part of the M3 were therefore substantially constrained by what had already been constructed. This is the antithesis of strategic planning.
- 12.12 By the same argument, assessment of the consequences of trunk roads for the pattern of land-use and development also needs to be considered at the regional or corridor
level. Predicting land-use changes is not an exact science, but we do believe that their assessment requires the strategic view.
- 12.13 The strategic approach is also required to deal adequately with long-distance rerouteing of traffic, when a series of improvements is made within a corridor. As we have seen in Chapter 5, such wide-area reassignment may be an important response to network improvements. The danger in appraising schemes independently is that, if tightly-drawn study areas are used, only local reassignments are identified and the wider, more strategic effects are ignored. Only by looking at a route or area-wide network as a whole can strategic reassignment within an area or corridor be properly assessed. This reassigned traffic may have implications for the design, environmental appraisal and economic evaluation of the route or network as a whole.
- 12.14 Often, the effects of individual schemes on regional accessibility will be small and the amount of extra traffic which they would induce would also be small. However, some schemes, such as a new river crossing in the heart of a congested urban area with high capacity approaches could induce significant amounts of extra traffic. But, whatever the impact of an individual scheme, we consider that induced traffic is likely to be more discernible when considered in combination with other related schemes along the route or in the vicinity. Again, this extra traffic may have implications for the design, environmental appraisal and economic evaluation of the route or network.
- 12.15 In Chapters 2 and 3, we explained that induced traffic can take many forms, and the estimation of all the effects would require complex models. It is probably too costly to develop models capable of estimating all possible forms of induced traffic for each individual scheme, especially if, at the scheme level, the effects may often be small. This again points to the wider area, whether a region or interurban corridor or urban area or conurbation, as being the appropriate level at which comprehensive models are developed and applied.
- 12.16 Having identified the preferred route, and established that it is economically worthwhile and that its net environmental effects are favourable, attention then rightly needs to switch to the details of each component scheme. Here again, we have some concerns about current practice.
- 12.17 Upgrading of whole routes and comprehensive network improvements cannot ever be achieved as one single scheme, for financial and practical reasons. It is necessary to divide the route to be improved into a series of smaller, more manageable, sections or schemes. At this level, there are many detailed decisions about the design to be taken. It is also necessary to carry out detailed appraisals, to check that the broader brush analyses undertaken at the corridor or regional level still hold good, and to establish the effects and value for money of each individual scheme.
- 12.18 Hence, the focus of the local scheme appraisal is different from that at the other levels. The local studies will be concerned primarily with identifying the best design to fit the local circumstances. Provided that the overall strategy has been appraised, it seems quite reasonable to us that the primary focus of the individual scheme assessment should be on local reassignments between the existing roads and the improved road. There will be instances, however, when other issues need to be considered. An obvious example is
where a scheme breaks a major barrier to movement, where we would expect induced traffic to be significant and to be modelled as part of the local scheme appraisal. In some instances, it may be possible to identify significant, but local, land-use changes which relate to the proposed scheme, and the effects of these may need to be taken into account in the scheme appraisal. But this does not obviate, in our view, the need to reflect the wider effects of improvements to the whole route or area in the local scheme appraisal. Thus, corridor or area-wide estimates of induced traffic should be properly fed down to the appraisal of individual schemes.
THE CURRENT APPRAISAL HIERARCHY
- 12.19 Different appraisal approaches will be appropriate to different kinds of area. We use several terms in this chapter, which distinguish between the following types of area:
- The term region describes an area at least as large as a single county and may cover parts or all of several counties. A region may include urban areas, but would be largely rural, and the focus of the analyses would be on longer-distance interurban movements.
- The term interurban corridor describes a corridor between major urban settlements, such as between London and Birmingham. There may be substantial urban settlements in the corridor, such as Oxford in our example, but the focus of the analyses being undertaken would again be on the longer-distance interurban movements. Most motorway widening schemes lie in interurban corridors.
- The term urban area is confined, for the purposes of this discussion, to those built-up areas where unrestrained traffic demand is unlikely to be accommodated on the road system. Urban areas may be freestanding or in close proximity to one another in a conurbation.
- The term peri-urban describes those areas which lie on the periphery of conurbations. The M25 is an example of a peri-urban scheme.
- 12.20 The various levels of appraisal or modelling currently operate in a hierarchical fashion. As we explained in Chapter 5, the National Road Traffic Forecasts (NRTFs) set the national framework, within which regional or interurban corridor studies and scheme appraisals are carried out. The NRTFs set the growth in overall vehicle travel, and subsequent stages in the modelling hierarchy are controlled to this growth. This process of controlling growth to a centrally-produced estimate is designed to ensure that local forecasts do not sum to more than could be expected for the country as a whole. It avoids the tendency for local appraisals to overstate local growth prospects.
12.21 Regional or interurban corridor models enable the effects of road network changes over wide areas to be estimated. The effects included in these analyses will vary with the circumstances and the models available. In some rare cases, such as the recent Trans-Pennine Study, some changes in traffic demand may be estimated and then fed into scheme assignment models. The changes in demand which are included will vary with the modelling approach adopted, but at most will be confined to redistribution and
modal transfer effects. In most cases, the regional or interurban corridor models will simply enable the rerouteing of longer-distance traffic to be modelled, which are then fed into local scheme assignment models as through traffic with respect to that scheme.
12.22 The most common approach adopted by the Department, as we explained in Chapter 6, is to model only local reassignment effects for individual schemes, with growth being controlled to that implicit in the NRTFs.
12.23 Models of the larger urban areas and conurbations pose special problems. Whether they are of the conventional four-stage or a more innovative strategic form, they are likely to contain procedures for forecasting travel demands by mode. Public transport and demand management policies fed into these models may have significant influences on the resulting forecasts of road traffic. It is not appropriate, therefore, to control the growth in road traffic in such urban areas to that given by the NRTFs which take no account of such policies. All that can be done at present, in urban areas where multimodal models are employed, is to control the land-use data and car ownership forecasts to those data produced centrally by the Department for each local authority district.
12.24 Models of the larger urban areas or conurbations are, at present, unlikely to contain road traffic assignment models which are sufficiently accurate for the appraisal of individual road schemes. It is quite appropriate, therefore, to adopt a hierarchical approach to the appraisal of urban schemes by estimating demand changes, using a multimodal urban model, which are then fed down to local road traffic assignment models for scheme appraisa1. In the case of smaller urban areas, the road traffic assignment component of a multimodal urban model may be adequate for the appraisal of individual road schemes.
12.25 Peri-urban schemes can present greater problems than urban ones. By their nature, these schemes are used by significant volumes of traffic local to the urban area, as well as performing an important function for long-distance traffic. Current urban models may provide some estimate of the demand changes and reassignments arising from these schemes, although (by definition) such schemes will usually lie at the periphery of the area covered by the models. Regional road traffic models, where they exist, will give some estimate of the effects of these schemes on longer-distance traffic routeing.
12.26 While the effects of changes in the trip matrices are sometimes considered in the operational design of schemes, we understand that the trip matrix is always assumed to be fixed for the economic evaluation. In a very few cases, the effect of varying the trip matrix is included in the economic evaluation, but always as a sensitivity test with the fixed matrix evaluation forming the cornerstone of the appraisa1. Thus, it is fair to say that some account is taken of induced traffic in some cases at some stages in the preparation of some traffic forecasts. In rare instances, the effects of induced traffic on scheme design are considered too, but the serious possibility of variations in the trip matrix is largely ignored when it comes to economic evaluation and, as far as we aware, in environmental appraisals as well.
12.27 In summary, therefore, some forms of induced traffic appear to be taken into account by the Department at three levels of traffic appraisa1. At the national level, allowance
in the NRTFs for induced traffic is far from explicit, and the forms of induced traffic which are included are also unclear. At the regional or interurban corridor level, induced traffic is taken account of only rarely, and the only form usually included is the reassignment of long-distance traffic. Some attempts have also been made to include induced traffic at the level of individual schemes, mainly in urban areas. In these instances, area-wide reassignments and trip redistribution appear to be the main effects included.
DEFICIENCIES IN CURRENT APPRAISAL PRACTICE
- 12.28 We have serious concerns about a number of important aspects of current traffic forecasting practice, which we draw attention to in what follows. We have confined our attention to what we believe are the key issues, where some change to current practice seems to us to be essential.
- 12.29 Our concerns focus on several areas, as follows:
- traffic forecasts at the highest tier in the existing hierarchy of models the national level;
- traffic forecasts at the middle tier in the hierarchy the regional, interurban corridor, urban area, conurbation, and peri-urban level;
- traffic forecasts at the lowest tier the scheme appraisal level;
- the way in which changes in land-use are handled in the forecasting process; and
- the rigour with which acknowledged variations in trip matrices are taken through into operational, environmental and economic assessments.
We consider each of these deficiencies in the remainder of this chapter, and we discuss our broad recommendations for dealing with the problems in the next chapter.
THE NATIONAL ROAD TRAFFIC FORECASTS
- 12.30 We have not conducted a review of the current National Road Traffic Forecasts; we have, however, taken note of the evidence put before us. The feature which gives us most concern, in the context of our current inquiry, is the extent to which the effects of the road building programme on traffic demand are reflected explicitly in the current NRTFs - that is, the extent to which induced traffic is already implicit in the current forecasts.
12.31 A reminder of the current methods used to produce the NRTFs may be helpful here. Two models of household car ownership are used to forecast the numbers of cars nationally at any given date in the future. One of these models is based on time-series data and the other on cross-sectional information. A model of car use, which is derived from historic data and relates car use to income growth and fuel price change, enables the national change in car use to be forecast (annual kms per car owned). The forecast car traffic is given by the forecast car ownership (taken as the average of the forecasts
produced by the two models) times the forecast car use. The national freight traffic forecasts are also derived from historic data. They are dependent essentially on projections of gross domestic product.
12.32 It is clear from this brief summary of the methodology employed by the NRTFs that much reliance is placed on past behaviour. It seems to us that this past behaviour will have been conditioned by the quality of the road system, and that future forecasts based on past behaviour will implicitly assume a continuation of past levels of service. In other words, account is not taken of, for example, faster deterioration in levels of service on the road system, as traffic levels increase and improvements fail to keep pace with the increasing congestion.
12.33 We were particularly concerned about the nature and magnitudes of the National Forecast Adjustment Factors (NFAFs), which are, as we explained in Chapter 6, used to reconcile the growth in vehicle-kilometres from the NRTFs with the growth in trip ends, forecast using the National Car Ownership and Trip End Submodels.
12.34 Our concerns about the nature of the NFAFs hinge on the conceptually doubtful practice of adjusting the growth in vehicle-trips to accord with the growth in vehiclekilometres. If the NFAFs were small (that is, close to 1.0), as they were when the concept was first introduced, then it may be argued that the conceptual inconsistency is unimportant. We IIshowed in Table 6.1 that the current NFAFs which result from the 1989 NRTFs are very substantial factors. With NFAFs of this magnitude, we believe that the conceptual mismatch between vehicle-trips and vehicle-kilometres needs resolution. However, as we showed in Table 6.2, the Department has recently revised the NFAFs downwards quite markedly, thereby reducing the importance of this issue, at least until larger values emerge again in the future.
12.35 We are also puzzled as to what the NFAFs actually mean, and we have received no convincing explanation from the Department. It seems intrinsically wrong to us that any factors are applied in the forecasting process whose meaning is obscure. Our interpretation of the NFAFs is that they are reflecting the apparent tendency for the average use of cars to increase over time. We can speculate about the reasons why cars may (in fact) be used more, for example:
- as land-use activities disperse, so travel distances between activities will increase;
- as congestion increases, so drivers will seek more circuitous routes in their efforts to avoid congestion; and
- more discretionary trips will be made, principally for purposes other than the journey to work.
12.36 The first two of these effects may already be accounted for elsewhere in the traffic forecasts prepared for appraising a scheme. If a trip distribution model of any kind is used in the scheme appraisal, then the effects of more dispersed land uses are likely to be reflected in the forecasts. Where assignment models which incorporate capacityrestraint procedures are used, then effects of following longer routes to avoid congestion will be reflected. The third effect may be interpreted as a way of allowing the trip rates
implicit in the National Trip End Model to increase over time. Thus, applying the NFAF in the preparation of traffic forecasts for scheme appraisal, as advised by the Traffic Appraisal Manual, will tend to duplicate effects taken account of elsewhere in the scheme appraisal forecasts.
TRAFFIC FORECASTS FOR REGIONS AND INTERURBAN CORRIDORS
- 12.37 We are concerned here with areas which are generally, although not wholly, rural in character, but not dominated by urban settlements. The issues which concern us in this case are that:
- whilst a few areas of the country are covered by reasonably up-to-date models, there are many areas where trunk road improvements are planned which are not covered by a regional road traffic model based on acceptably recent trip data;
- whilst the models which exist are useful for estimating the rerouteing effects on longer-distance traffic, they generally do not contain mechanisms for estimating the other changes in traffic demand which could arise from trunk road improvements; and
- whilst these models are used in some instances to provide estimates of the rerouteing of longer-distance traffic, they may not be used either consistently or as a matter of course.
TRAFFIC FORECASTS FOR URBAN AREAS AND CONURBATIONS
- 12.38 We see a fundamental difficulty with the application of the Department's current appraisal hierarchy to trunk road improvements in urban areas. The problem is that, in these larger urban areas, it will simply not be possible to cater for future unrestrained demand for travel by private vehicle. Demand management measures and public transport policies are likely to form part of an overall transport strategy aimed at containing the demand for travel by road within the capacity of the road system. In these instances, we expect that the (restrained) growth in travel by road will be inconsistent with the growth implicit in the NRTFs. In other words, it does not seem appropriate to control the growth in either vehicle-trips or vehicle-kilometres in the large urban areas and conurbations to the NRTFs as currently constructed. In fact, it can be argued that the NRTFs themselves should be modified to reflect the lower expected growth in road traffic in these areas, in the light of the capacity limitations, and a new emphasis on demand management and public transport policies.
- 12.39 In the smaller and medium-sized urban areas, the local authorities have generally been responsible for producing whatever models exist. Typically, these will contain only three stages: car ownership and trip end forecasting procedures, distribution, and road traffic assignment stages, the latter often being formed using a congested assignment model. While we would not wish to criticise this form of model as being suitable for the smaller and medium-sized urban areas, we are concerned that the full range of responses to trunk road improvements, either within or around these areas, cannot be estimated using these models.
12.40 In many of the larger urban areas and conurbations, hitherto, any modelling work has generally been the responsibility of the local authorities, with the notable exception of the London Transportation Study Model, for which the Department took over responsibility following the abolition of the GLC. These models are usually some form of multimodal model, either of the conventional four-stage form or (more recently) some form of strategic transport demand model. A number of issues concern us here. First, there are still several urban areas for which no model of this kind exists and, hence, for which no area-wide mechanism exists for assessing the demand changes which could arise from trunk road schemes. Secondly, where conventional four-stage models exist, while these models will generally include mechanisms for the estimation of modal transfer and redistribution effects, other responses are not often included, as they are in the more modern strategic transport demand models. Thirdly, where these models do exist, as far as we are aware, they are rarely used to estimate demand changes arising from trunk road schemes.
TRAFFIC FORECASTS IN PERI-URBAN AREAS
12.41 Forecasts of traffic on the periphery of large urban areas and conurbations seem to us to be potentially the most difficult of all. Regional traffic models, if they exist, are unlikely to handle properly the demand responses and interactions with the urban areas, while urban models are unlikely to cover sufficient of the hinterland to enable the full spread of effects to be modelled satisfactorily. A good example of this problem arises with the proposals to widen and add collector/distributor roads to the M25 between the M3 and M4. This particular situation is further complicated by the proposals to construct a fifth terminal at Heathrow Airport. The South East Regional Traffic Model can provide estimates of the effects on only longer-distance traffic, while the London Transportation Study Model, which does contain mechanisms for estimating modal transfer, redistribution and reassignment, does not extend sufficiently far out of London to embrace the full area over which the effects of the widening proposals are likely to be felt.
TRAFFIC FORECASTS FOR SCHEME APPRAISAL
- 12.42 The Department's traffic appraisals for individual schemes are generally carried out using road traffic assignment models. Increasingly, these nlodels are being built so that they can represent the effects of congestion separately during peak and interpeak hours. The trend towards this kind of modelling seems sensible. Also, use is increasingly being made of techniques which are designed to control the forecast traffic demand to fit the capacity of the do-minimum network.
- 12.43 There are two problems here. One is that a range of techniques are being used, and while some of these have some merit, others are of questionable validity. The second problem is that, once the demand has been capped or reduced in the do-minimum case, it is rarely, if ever, allowed to expand in the do-something case. This seems illogical to us. If the lack of capacity in the do-minimum case causes a suppression of traffic demand, then mutatis mutandis the additional capacity in the do-something case will necessarily release some of this suppressed demand. Moreover, we take the view that it is equally logical to allow demand to increase in response to the extra capacity in the
do-something case, unconstrained by the amount of suppression that is assumed to occur in the do-minimum case.
FORECASTS OF LAND-USE DATA FOR INPUT TO THE TRAFFIC FORECASTING PROCESS
- 12.44 Forecasts of land-use data are central to the traffic forecasting process. The NRTFs rely on the total number of households, while the Department's centrally-produced Districtlevel trip end forecasts rely on forecasts of population, households, employed residents, and jobs by type. We have several concerns with respect to the land-use data used currently in preparing traffic forecasts for trunk road appraisal.
- 12.45 From what the Department has told us about the way in which the District-level landuse forecasts are prepared (paragraphs 6.27 et seq), it seems that there can be considerable disparity between the land-uses assumed for the scheme and the approvals and aspirations of the planning authorities at the time that the traffic forecasts are produced. There appears, therefore, to be considerable scope for error due to the landuse data used in preparing the traffic forecasts being out-of-date.
- 12.46 Although land-use activities are changing continuously, the land-use and trip end forecasts appear to be updated relatively infrequently. For example, the Department has very recently updated the National Planning Data Files last prepared in 1990. Thus, it is possible for traffic forecasts which are prepared towards the end of the updating cycle to be seriously out of date.
- 12.47 We are also not convinced that the process for developing the land-use data achieves (as the Department claims) H a reasonable compromise between centralised methods, which can achieve national consistency but omit local knowledge, and localised methods which can take account of local plans and conditions but may neglect their relationship with the rest of the country".
- 12.48 Lastly, we are concerned about the extent to which account is taken of the changes in land-use which could be induced as a result of trunk road improvements. At the areawide level, changes in land-use as a result of a series of road improvements are not estimated. And at the scheme level, the practices for taking account of local developments which could arise from the improvement scheme seem to us to be (at best) ill-defined.
THE KEY ISSUES
- 12.49 Induced traffic is not currently handled in a systematic manner within the Department's appraisal hierarchy. We conclude that a more systematic approach to the treatment of induced traffic is required. In particular, much more emphasis needs to be placed on the strategic assessment of trunk routes within a corridor or regional or urban context. Such appraisal must include adequate representation of the behavioural mechanisms by which induced traffic can be estimated.
- 12.50 The most serious deficiency in current practice, however, is that when variations in the trip matrix are an acknowledged probability, the effects are not taken through into the
appraisal procedures in anything other than a cursory and ad hoc way. With two possible exceptions (see paragraph 8.35), trip matrices that vary have not, to our knowledge, formed the cornerstone of the appraisal of a Department of Transport trunk road scheme. In certain circumstances, we see this as fundamentally wrong, for the reasons we have tried to spell out in this chapter.
REFERENCES
Department of Transport (1989). National Road Traffic Forecasts (Great Britain) 1989. HMSO.
Department of Transport. Traffic Appraisal Manual. Revisions up to 1991. Highways Economics and Traffic Appraisal Division.
SACTRA (1992). Assessing the Environmental Impact of Road Schemes. HMSO.
CHAPTER 13: OUR RECOMMENDATIONS FOR CHANGE
INTRODUCTION
13.01 In the previous chapter, we set out our perceptions of the need to change current traffic forecasting and evaluation methodology used for the appraisal of trunk road schemes. In this chapter, we consider, in outline, what those changes should be in order that proper account is taken of induced traffic. In the next chapter, we set out our suggestions for changes to current practice for the interim, pending full development of the revised methods.
BASIC RESEARCH
- 13.02 In Chapters 4 and 5, we have pointed to the dearth of hard information about (a) the magnitude of the extra traffic induced by new road capacity and, (b) the contribution made by each of the components of induced traffic (described in Chapters 2 and 3) to the total. In paragraph 5.09 et seq, we discussed at length the Department's 'before and after' monitoring of its schemes. We suggest that this monitoring work is enhanced so as to be more useful in the assessment of the magnitude of induced traffic. In paragraph 5.81, we summarised the Department's planned programme of surveys aimed at providing some guidance as to the composition of induced traffic and we fully support this research.
- 13.03 We recommend that the Department enhances its scheme 'before and after' monitoring studies, so as to provide more information on induced traffic. We recommend that the Department's currently proposed programme of research, designed to investigate the responses of travellers to road network improvements, is given a high priority. We recommend that consideration be given to expanding the current research to include indepth analysis of a range ofschemes. We also recommend that the scope of the research should be expanded to include the effects on land uses resulting from responses by households, businesses and other organisations to road network improvements.
OUR RECOMMENDED APPROACH
- 13.04 In the last chapter, we stated that trunk road appraisal needs to be conducted at national, strategic and scheme levels. Accordingly, appraisal methodology should operate systematically in a hierarchical fashion. However, we see little merit in starting with a blank piece of paper and designing the perfect hierarchical modelling system from scratch. Not only would the costs be prohibitive, but the very considerable investment which has been made already in developing models at the national, regional, interurban corridor, urban area and conurbation levels, and in developing modelling techniques suitable for the scheme level, would be unnecessarily wasted.
- 13.05 We recommend that the current hierarchical approach to trunk road traffic forecasting should be retained, and strengthened so as to include all important demand responses to road improvements.
NATIONAL ROAD TRAFFIC FORECASTS
- 13.06 We strongly believe that, at the national level, there is a need to take better and more explicit account of the effects of the capacity of the road system on forecasts of traffic. Evidence has been submitted to us showing how this can be done by modifying the current procedures used to produce the National Road Traffic Forecasts, rather than completely redesigning the way in which these national forecasts are produced. Genuinely more policy-responsive NRTFs are needed. This would make possible strategic studies of the effects on future traffic volumes of alternative mixes or road user charges, road investment levels, and other policy instruments.
- 13.07 Another fundamental question about the national forecasts also needs to be addressed. We have drawn attention in Chapter 12 to the problems of trying to control road traffic vehicle-kilometres in urban areas to overall national forecasts of vehicle-kilometres, because traffic levels in urban areas can be affected by demand management and public transport policies which are not, at present, reflected in the national forecasts. We recognise that such harmonisation of national and urban area road traffic forecasts has vexed transportation planners for many years and may be intractable. Nevertheless, we believe that a more credible stance on this issue has to be developed.
- 13.08 We welcome the review ofthe National Road Traffic Forecasts which the Department has recently announced. We recommend that this review should ensure that proper account is taken not only ofthe influence ofnational road supply on road traffic demand but also the effects of other policies which concern the provision of public transport and the management of demand.
REGIONAL AND INTERURBAN CORRIDOR TRAFFIC FORECASTS
- 13.09 Following our arguments in Chapter 12, we believe that strategic appraisal is the most natural level of appraisal at which to take induced traffic into account. The Department currently undertakes strategic studies at the Route Identification Stage. We commend such studies as essential elements of the road planning process wherever strategic route choices exist. However, we have concluded that these studies need to be developed further so as to provide the overall economic and environmental context within which scheme appraisal can take place.
- 13.10 However desirable this principle might be, its practical effect could be to create a coalition of opponents to strategic developments, resulting in delay or even abandonment of trunk road schemes which have clearly passed the standard economic and environmental tests. Nevertheless, the Department needs to be able to describe to the public, and to public inquiry inspectors, the unambiguous strategic context within which particular proposals are to be appraised.
- 13.11 This approach is not revolutionary. Both the 1986 and 1992 SACTRA Reports called for a more strategic approach to trunk road appraisal. In their 1986 Report, SACTRA said:
"13.30 A series of small schemes which may have a large impact in total should be assessed together initially so that their wider implications are fully understood. "
In its response, the Government said:
"Recommendation 30 is accepted for all trunk road schemes and accords with current practice. "
In their 1992 Report, SACTRA said:
"16.11 An appraisal structure must be devised which will be adequate in geographical extent and timescale, and in its consideration of the combined and cumulative impacts ofseveral schemes and policies. "
In its response, the Government said:
"The Department accepts that in some cases appraisal needs to cover the combined and cumulative impacts of several schemes. Consideration of longer routes or a number of related schemes together may also allow a better choice of alignment and design, in both environmental and traffic terms. Increasingly, the Department is trying to ensure that this 'strategic' approach is followed, where appropriate. However, since schemes in the programme have been initiated and progressed over different timescales, this is not always possible in practice. "
- 13.12 Moreover, what we are proposing is no more than the implementation of the advice in Section 3.4 of the COBA 9 Manual on the evaluation of competing and complementary schemes. This argues for the evaluation of complete strategies, in appropriate cases, and concludes by stating that "the capital and user costs of wrong decisions can far outweigh the costs incurred in extra analysis" (COBA 9 Manual, paragraph 3.4.8). We consider that to be sound advice.
- 13.13 We recommend that scheme appraisal must be supplemented by economic and environmental appraisals at the strategic level which take account ofinduced traffic.
- 13.14 The Department has built a considerable number of regional traffic assignment models covering much of the country, although some are now based on data which are quite old. In general, these models can only show rerouteing effects. Our understanding is that they are generally used at the Route Identification Stage but relatively rarely for the appraisal of individual schemes. Most operate for tinle periods of 12 or 16 hours, and few include any mechanism for reflecting the effects of congestion. However, some have been constructed, or are being developed, for peak and interpeak hours and these do include capacity restraint procedures. These models can be used to give estimates of the effects of schemes or combinations of schemes on the routeing of longer-distance traffic, with the changes being fed down to local scheme models. Consideration will also need to be given to the way in which demand responses other than rerouteing can be assessed at the regional or interurban corridor level. It seems particularly important to us that
the wide-area effects of motorway widening schemes are estimated using models of this kind.
13.15 We recommend that, where trunk road improvements are planned, action should be put in hand to keep existing regional traffic models up-to-date. We recommend that new regional traffic models be developed for areas of the country for which no adequate model exists and where trunk road improvements are planned. We recommend that mechanisms are incorporated that reflect properly the effects of congestion in current and future regional traffic models. We recommend that consideration should be given to ways in which demand responses other than rerouteing can be included in these models. We recommend that the use ofthese models to estimate the effects on the routeing oflonger-distance traffic should he considered in scheme appraisal as a matter of course, including schemes to widen motorways.
URBAN AREA OR CONURBATION TRAFFIC FORECASTS
- 13.16 A number of traffic forecasting methods are in current use in urban areas and the conurbations, including the following:
- three-stage (generation, distribution and assignment) urban road traffic models, based on a congested assignment model suite or programs;
- four-stage (generation, distribution, modal split and assignment) multimodal models; and
- strategic transport demand models.
Congested road traffic assignment models have been constructed during the 1980s for many urban areas in this country. These models will generally have been produced for the peak periods and, in some cases, for an interpeak period as well. They are generally very suitable for the appraisal of the reassignment effects of road schemes in their areas. However, these models usually include, at most, only a trip generation stage for forecasting demand, and a distribution stage. This limits their facility for estimating the other changes in demand which could follow from improved road conditions. In the small and medium-sized urban areas, it is unlikely that the expense of creating more complex conventional four-stage or strategic transport demand models can be justified. Simpler approaches will therefore be needed, as a more pragmatic way forward.
- 13.17 We recommend that, where trunk road improvements are planned in urban areas of all sizes, existing congested assignment models be updated as necessary, or new models he developed where none already exist, and used for the appraisal ofthe trunk road schemes. We also recommend that standard ways of estimating the demand responses to road schemes in the small or medium-sized areas, where more complex modelling procedures would prove too costly, are investigated and relevant advice issued.
13.18 Four-stage multimodal models, with fine zoning systems and detailed networks, were used extensively in the 1970s. In the 1980s, very little effort was devoted to their maintenance or development outside London. Now, in the 1990s, there appears to be (once again) a growing interest in this kind of model. Certainly, these models do provide
a means of estimatjng the redistribution and modal transfer effects of road schemes, which can then be fed down to local scheme assignment models.
13.19 We understand that the Department makes some use of the LTS model in the preparation of forecasts for schemes in London. The main use to date seems to have been in providing forecasts of traffic growth. Little use, however, seems to have been made of the ability of the LTS model to predict changes in distribution, modal share, or the rerouteing of longer-distance traffic.
13.20 Strategic transport demand models have been developed in recent years to fill the hole left by the abandonment of the 1970s' four-stage models. In contrast with the four-stage models, they are spatially aggregate, use coarse zone systems and have very simplified representations of the transport networks. They deal with many different types of traveller, for a range of trip purposes, and they are able to estimate changes in trip frequency, distribution, mode, and time of travel. However, like the land-use/transport interaction models, they embody many suppositions about travel behaviour which are not always easy to validate in each local application.
13.21 Strategic transport demand models exist for a number of urban areas, including Avon, Luton/Dunstable, London and Merseyside. The Avon model has been used to provide growth rates for motorway and trunk road scheme appraisal. These growth rates took account of the constraints to growth in traffic in urban Bristol and were applied to a strategic traffic assignment model. Although the Avon model has not been used to date to estimate the travel demand changes in response to the Department's road schemes, it has been employed to assess the effects of applying tolls to motorways (as outlined in Chapter 10).
13.22 We believe that sensible traffic forecasts in the larger urban areas and conurbations cannot be undertaken without some form of multimodal demand forecasting model. Where such models exist, then we consider that full use should be made of their abilities to reflect the effects of demand management and public transport policies on road traffic demands and, where appropriate, to estimate the changes in demand which would be brought about by the scheme in question. Practical difficulties will arise in cases where road schemes are planned for urban areas where no multimodal demand model exists.
13.23 We recommend that the Department issues general advice on good practice in developing conventional four-stage transportation models. We recommend that, where these models exist, in areas where trunk road schemes are planned, the calibration and validation of these models is scrutinised by the Department and, ifproved satisfactory, they are used in the appraisal of those schemes. Where necessary, existing models should be enhanced, so that they are able to estimate all the important demand responses to road provision, including trip frequency and choice of time of travel.
13.24 We recommend that the strategic transport demand models available should be audited, in order to establish the credibility of their modelling of demand responses to trunk road schemes. For those strategic demand models whose audit is regarded as satisfactory, then we recommend that advice should be issued on the way in which these models should be used for trunk road scheme appraisal.
13.25 Where trunk road improvements in urban areas and conurbations are planned, then suitable multimodal transport models should be developed if they do not already exist. We recommend that these models be used to estimate all the more important demand responses to trunk road schemes, as a matter of course.
PERI-URBAN SCHEME APPRAISAL
- 13.26 As we noted in Chapter 12, schemes on the periphery of large urban areas and conurbations pose special problems because of the use of such schemes both for urban trips and long-distance trips. The appropriate modelling approach will depend on the circumstances and on the types of model which already exist.
- 13.27 We recommend that the special problems posed by the forecasting oftraffic which will use peri-urban trunk road schemes be addressed and advice issued. We recommend that the appraisal of each of the trunk road schemes on the periphery of large urban areas and conurbations is reviewed to ensure that methods exist whereby all potential travel demand and reassignment responses to the schemes can be estimated.
SCHEME APPRAISAL
- 13.28 As we have argued in the previous chapter, we firmly believe that the assessment of strategies for trunk road improvements is necessary if the full traffic and environmental effects are to be understood. This means that the travel demand changes and longdistance rerouteing effects should be estimated at the strategic tier in the modelling hierarchy and fed down to the local scheme appraisal models. Hence, it is possible, in many instances, that these latter models can, in general, continue to be based on assignment procedures. There may be an increasing need to use short period (typically one hour) models in congested areas, so that the effects of congestion can be properly taken into account.
- 13.29 Increasingly, we believe, there may be a need to modify demands in the local models in response to the amount of road capacity available. A variety of techniques has been developed in recent years for constraining demand to the road supply available. These can be used to suppress excess demand in a congested do-minimum case, and some can also be used to model induced traffic in the less congested do-something case.
- 13.30 We recommend that methods of modelling constrained demand are reviewed and advice issued on the most appropriate to use. Where demand exceeds supply in the do-minimum case, we recommend that a suitable procedure is used to estimate suppressed demand in the do-minimum case. We recommend that, whether or not it is necessary to suppress demand in the do-minimum case, estimates should be made of the traffic induced by the do-something network. We consider that procedures which can estimate the extra traffic likely to be induced by the do-something case, over and above that which is suppressed by the do-minimum case, are to be preferred.
- 13.31 We recognise that this approach of appraising strategies first and schemes second may not be practical, for several years, in those instances where suitable regional or strategic models are not yet available. In our view, steps should be taken to remedy deficiencies in strategic modelling as a matter of some urgency. However, we consider that the fact
that considerable time may be required for the development of the necessary strategic models should be taken to mean that the current fixed matrix procedures can continue to be used. In our view, some account needs to be taken of the effects of induced traffic in the appraisal of individual schemes, including the rerouteing of longer-distance traffic, whether or not a strategic-level appraisal has been carried out.
13.32 We recommend that the Department issues advice on ways in which the effects ofinduced traffic and the re-routeing of longer-distance traffic should be taken into account in the appraisal of individual schemes, for those cases where strategic models are not (for the time being) available.
LAND-USE DATA AND LAND-USE/TRANSPORT INTERACTION MODELS
- 13.33 The appropriate representation of land-use within trunk road appraisal is a particularly difficult issue and raises a number of questions. These concern the quality of the data inputs, which form the basis of the travel demand forecasts, and also the treatment of interactions between the transport network and the pattern of land development.
- 13.34 We believe that the land-use data, which would form the basis of regional, interurban corridor, urban area and conurbation studies, and which are fed into the Department's forecasts of trip ends at the local authority District level, may be seriously in error in some cases. These errors arise from the time-lag between preparing the land-use forecasts and the use of the trip end forecasts, which are based on the land-use forecasts, in scheme appraisal. We do not know to what extent these errors have material effects on the traffic forecasts. We suggest that the Department undertakes some sensitivity tests in order to gauge the importance of keeping the District-level data up-to-date. For reasons of credibility alone, however, closer linkages between these forecasts and the current thinking of the local planning authorities seem desirable to us.
- 13.35 We recommend that the procedures for assembling the national planning data be reviewed, with a view to ensuring greater consistency between the District-level trip end forecasts and the current approvals and aspirations of the local planning authorities.
- 13.36 In addition to the question of whether or not the land-use data which underpin the Department's traffic forecasts represent current local policies, there is the more fundamental question of the extent to which the land-use pattern will be itself shaped by the Road Programme. Land-use/ transport interaction models have been developed which can, in theory, be used to predict the changes in the land-use pattern which would come about following major improvement of the road network. While these models involve many hypotheses about travel behaviour which are difficult to validate, they do provide one way of making some estimate of the effects of major new roads on landuses. If these are judged reasonably reliable, the resultant changes in land use could be fed into the various other models: namely, conventional four-stage models, strategic transport demand models, regional traffic models, and ultimately the local scheme appraisal models.
13.37 We recommend that the readily-available land-use/ transport interaction models be reviewed and their applicability to the appraisal of trunk road improvements be assessed.
13.38 We believe that land-use changes can, in certain circumstances, be stimulated by individual road schemes. Simply the announcement of a proposal to improve a road may encourage land-use developments prior to, and in anticipation of, the proposed improvement. The completed road scheme may provide improvements in local accessibility which may encourage land-use development to take place after the road is opened to traffic which otherwise would not have occurred. The line of a proposed new road may result in land being parcelled in a way which makes development more likely than would have been the case without the new road. A new or improved road may also stimulate the development of proposals related directly to the road itself, such as service areas and motels. We believe that the traffic generated by all these kinds of development, which could occur in the vicinity of a new or improved road, need to be taken into account in the scheme design and appraisal.
13.39 We recommend that existing procedures for taking account of likely new land-use developments in the vicinity of new or improved roads be reviewed, and revised as necessary, so as to ensure that full account is taken in the scheme design and appraisal process of the traffic produced by and attracted to such developments.
APPRAISAL STRATEGY
- 13.40 We have suggested that economic evaluations are undertaken at the regional, interurban corridor, urban area, or conurbation level of collections of related trunk road improvement schemes. We also suggest that the economic worth of individual schemes should also be tested as part of the scheme appraisal. However, these simple principles are far from straightforward to put into practice.
- 13.41 The complications arise because the economic worth of any individual trunk road scheme depends on the level of traffic demand, on what other transport system changes are assumed to occur before the scheme concerned is completed, and on the resultant level of congestion. Trunk road schemes are of two kinds: those which lie in rural areas, whose worth is affected only by the presence or absence of other trunk road and local authority road schemes in the vicinity; and those that are an integral part of an urban transport system, whose worth is therefore affected by local authority strategies and proposals, including local road schemes, traffic management schemes, public transport proposals, and demand management policies (including parking policies), as well as by other trunk road schemes.
- 13.42 We recommend that the Department revisits and revises its advice on appraisal strategies, especially in urban areas. We recommend that the existing advice is revised as necessary and reissued, so that each individual trunk road scheme is appraised under a range of scenarios.
APPRAISAL METHODOLOGY
13.43 The question of appropriate appraisal methodologies arises at the national level in only a limited sense. Operational and economic appraisals at the national level, of the whole Road Programme as a single entity, would require a national road network model. This was attempted, unsuccessfully and at huge cost, in the late 1970s, in the Regional Highway Traffic Model (RHTM) Project. We do not feel that sufficient advances have
been made since the 1970s for us to recommend, with any confidence, that such an approach should be adopted now. The appraisal of the environmental effects of individual roads also requires a network model. However, a key issue at national level, which can be assessed using an appropriate national forecasting procedure, is the global vehicle emissions arising from the Road Programme.
- 13.44 At the level of regions, interurban corridors, urban areas and conurbations, and periurban areas, where changes in demand in response to road improvements are (or can be) modelled, variable matrix economic evaluation will be essential. The question then arises as to how such evaluations should best be carried out.
- 13.45 The Department's current economic evaluation programs, COBA and URECA, perform link-based calculations. While these programs have the advantage of showing the geographical incidence of benefits and disbenefits, they have the disadvantage that to perform link-based calculations for large or complex areas can be a complicated process. COBA and URECA currently rely on the assumption that the same fixed trip matrix applies to the do-minimum and do-something cases. They can, in theory, be used to undertake variable matrix evaluations, but only by means of extra model runs and evaluations. A much more suitable approach, in our opinion, is to use matrix-based methods, which are equally able to deal with either fixed or variable trip matrices.
- 13.46 We recommend that variable matrix economic evaluations are undertaken at the level of regions, interurban corridors, urban areas and conurbations, and peri-urban areas as the cornerstone of the economic appraisal in every case. We recommend that standard techniques are developed for undertaking variable matrix economic evaluations using matrix-based methods of computation, for use in regional, interurban corridor, urban, conurbation and peri-urban studies.
- 13.47 At the scheme level, we have acknowledged that the main focus of modelling work will continue to be on local assignment modelling. In those cases where it has been shown that, at the scheme level, the trip matrix would not change as a result of the scheme being appraised, then the fixed trip matrix assumption could continue to hold, and COBA and URECA could continue, in theory, to be applied. However, where demand responses are expected at the individual scheme level, in circumstances such as those defined in paragraph 11.23, then variable matrix evaluations will be required. As we noted above, these may be possible using COBA and URECA, but it is likely that matrix-based methods will be more efficient. If this were shown to be the case, then the question of compatibility between matrix-based, COBA and URECA evaluations would arIse.
- 13.48 In any case, we envisage that there will continue to be a requirement within scheme appraisal for economic evaluation, environmental appraisal and operational appraisal. The latter will generate a continued requirement to display the assigned traffic flows and travel times on the road network so that the operational performance of the scheme can be properly assessed.
- 13.49 We recommend that variable matrix economic evaluations are undertaken for schemes as the cornerstone ofthe economic appraisal in every case, except where it can tbe shown that the trip matrix will not vary as a result of the scheme being appraised. We recommend
that the various methods of undertaking variable matrix economic evaluations at scheme level be investigated and a preferred method identified. If this does not involve the use of COBA and URECA in their current specifications, then we recommend that the role of these two programs in fixed trip matrix evaluations should be reconsidered, with a view to developing a method which can be applied equally well to both fixed and variable trip matrix situations.
13.50 We recognise that our proposals, if implemented, would represent the most radical change in trunk road appraisal since the development of COBA in the early 1970s. We have not reached our judgment lightly, nor do we under-estimate the magnitude of what we are proposing. But we do not think that continuing to appraise solely at the scheme level using the fixed trip matrix approach is, either intellectually or in practical terms, acceptable. It is this central conclusion which has led us to make the recommendations in this Report.
CHAPTER 14: INTERIM PROCEDURES
INTRODUCTION
14.01 The revision of the National Road Traffic Forecasts and the development of the strategic approach, which we recommended in Chapter 13, will clearly take some considerable time to achieve. Interim procedures will be needed to take as much account of variations in the trip matrices as possible, pending the full development of the proper procedures. We offer the following advice which may assist the Department about how to proceed in the short term.
14.02 We recommend that the Department should:
- • develop a research and development programme to address our recommendations for revised modelling and evaluation techniques, allocate appropriate funds and human resources to undertake the programme within as short a timetable as possible, and set the programme in motion at the earliest possible date;
- • invite SACTRA to advise the Department on the conduct of this research and development programme and on the implementation of both interim and fullydeveloped appraisal methods;
- • develop some interim techniques for estimating the amounts ofinduced traffic and taking account of the effects ofinduced traffic in the evaluation ofschemes; and
- • whilst continuing with the Road Programme, the Department should adopt the interim measures, to ensure that induced traffic is allowed for as fully as possible with the procedures available.
NATIONAL ROAD TRAFFIC FORECASTS
14.03 We accept that the Department will continue to use the 1989 National Road Traffic Forecasts, pending the outcome of the current fundamental review.
REGIONAL, INTERURBAN CORRIDOR, URBAN AREA, CONURBATION AND PERI-URBAN TRAFFIC FORECASTS
- 14.04 Attention was drawn in SACTRA's 1992 Report to the need to consider the environmental effects of collections of related schemes, whether they form a series of improvements to a route as a whole or to related parts of a regional or urban network. In this Report, we have again pointed to the need to prepare traffic forecasts for collections of related schemes so that their combined effect on traffic demand can be estimated.
- 14.05 For many parts of the country where trunk road improvements are planned, models currently exist which are capable of assessing the impacts of collections of schemes over regions, or in particular interurban corridors, or in urban areas and conurbations and on their peripheries. These models could be used, in their current state, to make best estimates of the induced traffic which would arise from collections of related, but
individual, schemes. In presenting the results from these model runs, it will be important to state quite clearly the limitations of the models in being able to represent the full range of demand responses.
- 14.06 As part of our recommendations in this chapter, we recommend that existing area-wide models are used, in their current forms, to assess the cumulative effects of collections of related trunk road schemes. We recommend that, in reporting the results, the limitations of the models and the resulting forecasts are made clear.
- 14.07 The models which are likely to contain mechanisms for dealing with a reasonably full range of demand responses are the new breed of strategic transport demand models. To our knowledge, these currently exist for only a few urban areas and conurbations and no rural areas. Conventional four-stage models contain fewer demand response mechanisms, and again these models currently exist for only a few urban areas and conurbations and no rural areas. In the case of regions, or interurban corridors, the existing models are likely to be able to represent changes in route, and little else. In a few cases, it may be possible to represent redistribution effects and, in even fewer cases (we are aware of only one - the Trans-Pennine Model), it may be possible to reflect modal transfer effects. Given that most of the Road Programme lies outside the main urban areas and conurbatio~, where the most responsive models are likely to exist, the use of existing models is likely to indicate only the effects on rerouteing for the majority of the Road Programme. While the effects on longer-distance rerouteing are important, we consider that it is also important to make some estimate of the other demand responses which trunk road improvements could induce.
- 14.08 We suggest that an estimate can be made of the amount of extra traffic likely to be induced by a collection of trunk road improvements using, in the obverse sense, one of the methods currently used by practitioners for constraining demand to the network capacity available. In general, theie methods have been designed to estimate the suppressed demand on over-congested networks. However, some of the methods can also be run in reverse to provide estimates of the amount of traffic which might be induced by the provision of additional road capacity. We have recommended that the Department reviews the available methods of modelling suppressed demand and issues advice on the most appropriate method for use in trunk road appraisal, both to estimate suppressed and induced demand.
14.09 In the interim, pending the outcome of the Department's research into such methods, the Committee's view is that a simple elasticity model can be used. This approach has the merit of having a reasonable behavioural basis, in that trips are suppressed or induced in direct relation to either increases or decreases, respectively, in travel times, modified by a value of the elasticity of change in trips with respect to change in travel time. The process works for each zone-to-zone movement individually. An advantage of the method in our view is that it can be used to estimate the amount of induced traffic arising from the do-something network whether or not it is found necessary to assume a suppression of demand on the do-minimum network. In other words, the amount of induced traffic on the do-something is not unrealisti~ally constrained to the amount of traffic suppressed on the do-minimum. The difficulty with this approach is knowing with certainty what value of elasticity should be applied.
14.10 For collections ofschemes in rural regions or interurban corridors where area-wide traffic assignment models exist, we recommend that estimates of induced traffic are made using these existing traffic assignment models coupled with a simple elasticity model. We recommend that these estimates are made in addition to the recommendations ofparagraph 14.06.
14.11 We recommend that the Department undertakes research to determine the most appropriate values ofelasticity which should be adopted, but in the interim, we suggest that a range ofrealistic values, drawn from published work, is used.
14.12 We acknowledge that these aggregate elasticities are broad brush in nature, but we consider that they are a practical interim way of testing the robustness of schemes to the presence of induced traffic. We expect that many schemes will prove to be robust, and the Department should scrutinise carefully those which are not.
14.13 There is the question of what the elasticities represent. In general, trips will increase in response to decreases in travel times and vice versa, but where there are no changes in travel times there will be no change in trips. Thus, it can argued that they represent transfers from other modes, transfer from other times of day (if they are being applied to a model of only a part of the day) and trip frequency changes.
14.14 We recommend that research is conducted as a matter ofsome urgency into the fractions of the total response represented by an elasticity model which correspond with the known components ofinduced traffic.
14.15 Different components of the traffic induced by an individual scheme have different consequences for economic evaluation. For example, the benefits accruing to longerdistance traffic which diverts to use the scheme would be the same as those accruing to the locally reassigned traffic - they would be assumed to receive a benefit equivalent to their full time saving. Entirely new trips would, by convention, receive a benefit equivalent to half the reduction in generalised cost per trip between the do-minimum and the do-something. Redistributed trips would cause benefits in the corridor from which they switched and may cause disbenefits in the corridor to which they redistributed.
14.16 We recommend that research is carried out as a matter ofsome urgency to investigate the various consequences for economic evaluation ofthe different forms ofinduced traffic and, in particular, those forms which can be said to be represented by an elasticity model.
14.17 The recommendation in paragraph 14.10 applies specifically to those areas covered by existing large-area road traffic assignment models - mainly regions or interurban corridors. There are four other circumstances to consider.
14.18 The first case is of urban, conurbation and peri-urban areas, where either a strategic transport demand model and detailed road traffic assignment model, or a conventional four-stage model which includes a road traffic assignment model, already exist. We have recommended that these existing models be used to make an estimate of travel demand changes in response to collections of trunk road improvements. However, we recognise that, in most cases, the full range of responses will be only partially represented by these
models. For comparability with the appraisals for the regional areas and interurban corridors, we suggest that an estimate of the total induced traffic is made using the same elasticity approach.
14.19 The second case is of urban areas where no demand modelling facilities exist but where an assignment model is available. In these instances, the same elasticity approach suggested for the regional areas and interurban corridors can be used.
14.20 The third case is where demand modelling facilities exist, for example, in the form of a strategic transport demand model, but where a detailed road traffic assignment model does not exist. In these instances, the elasticity approach cannot be applied, and the strategic transport demand model will give the best, and possibly the only, estimate of the induced traffic effects of trunk road schemes in the area concerned. In these instances, it seems important to us that urgent action is taken to develop an area-wide assignment model.
14.21 The fourth case is where no modelling facilities, other than at the level of individual schemes, exist. In these instances, no estimates of the cumulative effects of individual schemes on travel demand levels can be made. Here again, it seems important to us that urgent action is taken to develop at least an area-wide assignment rhodel.
14.22 For collections of schemes in urban, conurbation and peri-urban areas where traffic assignment models exist, we recommend that estimates of induced traffic are made using these existing traffic assignment models coupled with a simple elasticity model. We recommend that the Department specifies a suitable range ofelasticities and that sensitivity analysis is applied to all appraisals based upon the lower and upper bounds ofthe specified range. These estimates should be produced in addition to using whatever more sophisticated models are available, for comparability with elasticity-based estimates of induced traffic for regional and interurban corridor schemes. Where no suitable area-wide traffic assignment models exist in areas where groups ofrelated trunk road schemes are proposed, we recommend that the Department constructs an area-wide road traffic assignment model at the earliest opportunity, and then carries out elasticity-based assessments to allow for induced traffic.
INDIVIDUAL SCHEMES
- 14.23 In all instances where area-wide models of some kind exist, we suggest that these be used to demonstrate the effects of each individual trunk road scheme. In the case of the regional or interurban corridor road traffic assignment models, this would show the effects on longer-distance rerouteing of the individual schemes. In the case of some of the urban models, other responses to individual schemes can be shown.
- 14.24 We recommend making best use of existing models to show the effects of individual schemes on traffic demands, including the rerouteing oflonger-distance traffic.
- 14.25 For the vast majority of trunk road improvement schemes, a local traffic assignment model will be created. These can be used, in conjunction with the simple elasticity model, to make a general estimate of the traffic which may be induced by each individual scheme.
14.26 We recommend that elasticity-based estimates of induced traffic are made for each individual scheme for which a local road traffic assignment model exists or is to be developed. As with the area-wide estimates ofinduced traffic, we recommend that a range of elasticity values is used.
ECONOMIC EVALUATION
- 14.27 As a matter of course in the assessment recommended above, we consider that the demand should be allowed to vary in both the do-minimum and do-something cases, and not necessarily in the same way or to the same extent. Thus, in any given case, trips may be suppressed on the do-minimum network and extra trips may be induced on the do-something network.
- 14.28 As a matter of course, whatever mechanism is being used to estimate changes in demand, we recommend that both traffic suppression on the do-minimum network and traffic induction on the do-something network should be allowed for.
- 14.29 Most of the interim procedures we have recommended in this chapter may, or may not, lead to significant variations in the trip matrices, either as a result of congestion on the do-minimum network or relief of congestion on the do-something network. In the cases where variations in the trip matrices do result, then variable matrix economic evaluations will be required. The theory of variable matrix economic evaluation is wellestablished and is clearly set out in the COBA 9 Manual. However, we consider that it will be necessary for the Department to issue advice, which is possibly interim pending further research and software development, to elaborate the advice currently given in the COBA 9 Manual, with a view to ensuring that the variable matrix evaluations are done in the most consistent manner possible.
- 14.30 Our preference is for the variable matrix economic evaluations to be carried out using matrix-based methods of computation, because these are more feasible at the area-wide level than using COBA or URECA. No special software is required for this kind of evaluation, but special advice should be issued by the Department to ensure that these evaluations are carried out in a standard manner. It will also be useful for comparisons to be made between matrix-based evaluations using a fixed trip matrix and COBA and URECA, in order that the matrix-based results can be interpreted in the light of the Department's long experience of COBA results.
- 14.31 We recommend that the Department issues advice, labelled interim as necessary, which elaborates the advice given in the COBA 9 Manual, about how variable matrix economic evaluations should be undertaken. Variable matrix economic evaluations should be undertaken for collections of schemes at the area-wide level, and for individual schemes, as a matter of course. We recommend that the use of COBA and URECA for variable matrix evaluations should be explored.
- 14.32 There is an unavoidable and urgent need to address the question of appraisal strategies. In particular, we see the need to review the contexts within which schemes are appraised. In rural areas, we suggest these could be the do-minimum case and the do-minimum plus all other proposed road schemes in the area. In urban areas, we suggest that. the contexts for appraisal could include the do-minimum case, the do-minimum plus all
other trunk road schemes proposed, and the do-minimum plus the implementation of the full transport strategy for the area. Consideration should also be given to the extent to which networks and demand management policies should vary over the period between the appraisals conducted for the year of scheme opening and the design year. Care will have to exercised to prevent the appraisal process becoming too complex, with excessive information causing difficulties for the decision-takers.
- 14.33 We recommend that advice is issued as a matter of urgency about the approach which should be adopted for appraisal. This advice should naturally address issues such as low and high economic growth scenarios, but also deal with trip suppression and induction with low and high elasticities. In the case ofindividual schemes, the transport contexts, within which the scheme should be appraised, should be defined. We recommend that the Department issues advice which ensures that the extent ofthe various tests suggested does not over-burden the appraisal process, but that the sensitivity of all ranges are properly tested.
- 14.34 The advice'contained in this chapter needs further elaboration before fully operational procedures can be defined. We suggest that case studies are the best way of developing these operational procedures.
- 14.35 We recommend that the Department selects a number of typical schemes at the planning stage, prior to public inquiry, and undertakes pilot studies of these schemes in order to demonstrate how the interim procedures suggested in this chapter could operate.
- 14.36 By adopting our recommended interim procedures, we believe that the Department will be able to achieve the following:
- demonstrate the cumulative effects of related trunk road schemes and take account of these effects in the appraisal of the constituent individual schemes; and then either
- demonstrate that individual schemes will not cause any extra traffic to be induced, in which case the fixed matrix approach to economic evaluation can still be applied; or
- demonstrate that individual schemes will cause extra traffic to be induced, in which case all methods available to estimate the extra traffic should be used, and the variable matrix method of economic evaluation should be applied.
REFERENCES
SACTRA (1992). Assessing the Environmental Impact of Road Schemes. HMSO.
Department of Transport. COBA 9 Manual. Revisions up to 15 November 1993. Highways Economics and Traffic Appraisal Division.
Department of Transport. URECA Manual. 1990 version. Highways Economics and Traffic Appraisal Division.
PART VI
MAIN CONCLUSIONS AND SUMMARY OF RECOMMENDATIONS
Chapter 15
This chapter summarises our main conclusions and all our recommendations.
CHAPTER 15: MAIN CONCLUSIONS AND SUMMARY OF RECOMMENDATIONS
INTRODUCTION
- 15.01 At the end of Chapter 2, we posed four main questions which our Terms of Reference required us to answer. These are:
- does the provision of new or improved trunk roads and motorways give rise to induced traffic - is it a real phenomenon?
- if so, are the consequences in terms of the planning, design and evaluation of such road schemes significant - does it matter?
- if so, for which types and categories of major highway improvement is induced traffic likely to be significant - where and when does it matter most?
- how should the current forecasting and appraisal methods be amended to allow for induced traffic - what needs to be done?
- 15.02 In Chapter 11, we gave our answers to the first three of these questions, based on the evidence and arguments presented in Chapters 4 to 10. As a prelude to a summary of our answer to the fourth question, we recapitulate briefly our answers to the first three. We then present all our recommendations from Chapters 13 and 14 together in the final part of this chapter. We have given cross-references to the relevant paragraph numbers in Chapters 13 and 14, so that the reader may appreciate more of the context of our recommendations if so desired.
OUR ANSWERS TO THE FIRST THREE QUESTIONS
- 15.03 Is induced traffic a real phenomenon? Considering all the sources of evidence, our answer is that induced traffic can and does occur, probably quite extensively, though its size and significance are likely to vary widely in different circumstances.
- 15.04 Does induced traffic matter? Based on the evidence, we are convinced that there are circumstances where induced traffic can seriously affect the design, environmental appraisal and economic evaluation of schemes.
- 15.05 When and where does induced traffic matter most? The evidence suggests that induced traffic will be of greatest importance in the following circumstances:
- where the network is operating or is expected to operate close to capacity;
- where the elasticity of demand with respect to travel costs is high;
- where the implementation of a scheme causes large changes in travel costs.
OUR ANSWER TO THE FOURTH QUESTION
OUf Recommendations for Change
- 15.06 Based on the evidence and implications in Chapters 4 to 10, our conclusions in Chapter 11, and our analysis of the need for change in Chapter 12, we set out our recommendations for change in Chapter 13. These recommendations are reproduced below.
- 15.07 We recommend that the Department enhances its scheme 'before and after' monitoring studies so as to provide more information on induced traffic. We recommend that the Department's currently proposed programme of research, designed to investigate the responses of travellers to road network improvements, is given a high priority. We recommend that Go,nsideration be given to expanding the current research to include indepth analysis of a range of schemes. We also recommend that the scope of the research should be expanded to include the effects on land uses resulting from responses by households, businesses and other organisations to road network improvements in the longer term (paragraph 13.03).
- 15.08 We recommend that the current hierarchical approach to trunk road traffic forecasting should be retained, and strengthened so as to include all important demand responses to road improvements (paragraph 13.05).
- 15.09 We welcome the review of the National Road Traffic Forecasts which the Department has recently announced. We recommend that this review should ensure that proper account is taken not only of the influence of national road supply on road traffic demand but also the effects of other policies which concern the provision of public transport and the management of demand (paragraph 13.08).
- 15.10 We recommend that scheme appraisal must be supplemented by economic and environmental appraisals at the strategic level which take account of induced traffic (paragraph 13.13).
- 15.11 We recommend that, where trunk road improvements are planned, action should be put in hand to keep existing regional traffic models up-to-date. We recommend that new regional traffic models be developed for areas of the country for which no adequate model exists and where trunk road improvements are planned. We recommend that mechanisms are incorporated that reflect properly the effects of congestion in current and future regional traffic models. We recommend that consideration should be given to ways in which demand responses other than rerouteing can be included in these models. We recommend that the use of these models to estimate the effects on the routeing of longer-distance traffic should be considered in scheme appraisal as a matter of course, including schemes to widen motorways (paragraph 13.15).
15.12 We recommend that, where trunk road improvements are planned in urban areas of all sizes, existing congested assignmel1t models be updated as necessary, or new models be developed where none already exist, and used for the appraisal of the trunk road schemes. We also recommend that standard ways of estimating the demand responses to road schemes in the small or medium-sized areas, where more complex modelling procedures would prove too costly, are investigated and relevant advice issued (paragraph 13.17).
15.13 We recommend that the Department issues general advice on good practice in developing conventional four-stage transportation models. We recommend that, where these models exist, in areas where trunk road schemes are planned, the calibration and validation of these models is scrutinised by the Department and, if proved satisfactory, they are used in the appraisal of those schemes. Where necessary, existing models should be enhanced, so that they are able to estimate all the important demand responses to road provision, including trip frequency and choice of time of travel (paragraph 13.23).
15.14 We recommend that the strategic transport demand models available should be audited, in order to establish the credibility of their modelling of demand responses to trunk road schemes. For those strategic demand models whose audit is regarded as satisfactory, then we recommend that advice should be issued on the way in which these models should be used for trunk road scheme appraisal (paragraph 13.24).
15.15 Where trunk road improvements in urban areas and conurbations are planned, then suitable multimodal transport models should be developed if they do not already exist. We recommend that these models be used to estimate all the more important demand responses to trunk road schemes, as a matter of course (paragraph 13.25).
15.16 We recommend that the special problems posed by the forecasting of traffic which will use peri-urban trunk road schemes be addressed and advice issued. We recommend that the appraisal of each of the trunk road schemes on the periphery of large urban areas and conurbations is reviewed to ensure that methods exist whereby all potential travel demand and reassignment responses to the schemes can be estimated (paragraph 13.27).
15.17 We recommend that methods of modelling constrained demand are reviewed and advice issued on the most appropriate to use. Where demand exceeds supply in the dominimum case, we recommend that a suitable procedure is used to estimate suppressed demand in the do-minimum case. We recommend that, whether or not it is necessary to suppress demand in the do-minimum case, estimates should be made of the traffic induced by the do-something network. We consider that procedures which can estimate the extra traffic likely to be induced by the do-something case, over and above that which is suppressed by the do-minimum case, are to be preferred (paragraph 13.30).
15.18 We recommend that the Department issues advice on ways in which the effects of induced traffic and the re-routeing of longer-distance traffic should be taken into account in the appraisal of individual schemes, for those cases where strategic models are not (for the time being) available (paragraph 13.32).
15.19 We recommend that the procedures for assembling the national planning data be reviewed, with a view to ensuring greater consistency between the District-level trip end forecasts and the current approvals and aspirations of the local planning authorities (paragraph 13.35).
15.20 We recommend that the readily-available land-use/transport interaction models be reviewed and their applicability to the appraisal of trunk road improvements be assessed (paragraph 13.37).
15.21 We recommend that eXIstIng procedures for taking account of likely new land-use developments in the vicinity of new or improved roads be reviewed, and revised as
necessary, so as to ensure that full account is taken in the scheme design and appraisal process of the traffic produced by and attracted to such developments (paragraph 13.39).
15.22 We recommend that the Department revisits and revises its advice on appraisal strategies, especially in urban areas. We recommend that the existing advice is revised as necessary and reissued, so that each individual trunk road scheme is appraised under a range of scenarios (paragraph 13.42).
15.23 We recommend that variable matrix economic evaluations are undertaken at the level of regions, interurban corridors, urban areas and conurbations, and peri-urban areas as the cornerstone of the economic appraisal in every case. We recommend that standard techniques are developed for undertaking variable matrix economic evaluations using matrix-based methods of computation, for use in regional, interurban corridor, urban, conurbation and peri-urban studies (paragraph 13.46).
15.24 We recommend that variable matrix economic evaluations are undertaken for schemes as the cornerstone of the economic appraisal in every case, except where it can be shown that the trip matrix will not vary as a result of the scheme being appraised. We recommend that the various methods of undertaking variable matrix economic evaluations at scheme level be investigated and a preferred method identified. If this does not involve the use of COBA and URECA in their current specifications, then we recommend that the role of these two programs in fixed trip matrix evaluations should be reconsidered, with a view to developing a method which can be applied equally well to both fixed and variable trip matrix situations (paragraph 13.49).
15.25 We recognise that our proposals, if implemented, would represent the most radical change in trunk road appraisal since the development of COBA in the early 1970s. We have not reached our judgement lightly, nor do we under-estimate the magnitude of what we are proposing. But we do not think that continuing to appraise solely at the scheme level using the fixed trip matrix approach is, either intellectually or in practical terms, acceptable. It is this central conclusion which has led us to make the recommendations in this report.
Interim Procedures
- 15.26 The revision of the National Road Traffic Forecasts and the development of the strategic approach will clearly take some considerable time to achieve. Interim procedures will be needed to take as much account of variations in the trip matrices as possible, pending the full development of the proper procedures. We offer the following advice (reproduced from Chapter 14) which may assist the Department about how to proceed in the short term.
15.27 We recommend that the Department should:
- develop a research and development programme to address our recommendations for revised modelling and evaluation techniques, allocate appropriate funds and human resources to undertake the programme within as short a timetable as possible, and set the programme in motion at the earliest possible date;
- invite SACTRA to advise the Department on the conduct of this research and development programme and on the implementation of both interim and fullydeveloped appraisal methods;
develop some interim techniques for estimating the amounts of induced traffic and taking account of the effects of induced traffic in the evaluation of schemes; and
whilst continuing with the Road Programme, the Department should adopt the interim measures, to ensure that induced traffic is allowed for as fully as possible with the procedures available. (Paragraph 14.02.)
15.28 We accept that the Department will continue to use the 1989 National Road Traffic Forecasts, pending the outcome of the current fundamental review (paragraph 14.03).
15.29 As part of our recommendations for interim procedures, we recommend that existing area-wide models are used, in their current forms, to assess the cumulative effects of collections of related trunk road schemes. We recommend that, in reporting the results, the limitations of the models and the resulting forecasts are made clear (paragraph 14.06).
15.30 For collections of schemes in rural regions or interurban corridors where area-wide traffic assignment models exist, we recommend that estimates of induced traffic are made using these existing traffic assignment models coupled with a simple elasticity model. We recommend that these estimates are made in addition to the recommendations of paragraph 15.28 (paragraph 14.10).
15.31 We recommend that the Department undertakes research to determine the most appropriate values of elasticity which should be adopted, but in the interim, we suggest that a range of realistic values, drawn from published work, is used (paragraph 14.11).
15.32 We recommend that research is conducted as a matter of some urgency into the fractions of the total response represented by an elasticity model which correspond with the known components of induced traffic (paragraph 14.14).
15.33 We recommend that research is carried out as a matter of some urgency to investigate the various consequences for economic evaluation of the different forms of induced traffic and, in particular, those forms which can be said to be represented by an elasticity model (paragraph 14.16).
15.34 For collections of schemes in urban, conurbation and peri-urban areas where traffic assignment models exist, we recommend that estimates of induced traffic are made using these existing traffic assignment models coupled with a simple elasticity model. We recommend that the Department specifies a suitable range of elasticities and that sensitivity analysis is applied to all appraisals based upon the lower and upper bounds of the specified range. These estimates should be produced in addition to using whatever more sophisticated models are available, for comparability with elasticity-based estimates of induced traffic for regional and interurban corridor schemes. Where no suitable area-wide traffic assignment models exist in areas where groups of related trunk road schemes are proposed, we recommend that the Department constructs an areawide road traffic assignment model at the earliest opportunity, and then carries out elasticity-based assessments to allow for induced traffic (paragraph 14.22).
15.35 We recommend making best use of existing models to show the effects of individual schemes on traffic demands, including the rerouteing of longer-distance traffic (paragraph 14.24).
15.36 We recommend that elasticity-based estimates of induced traffic are made for each individual scheme for which a local road traffic assignment model exists or is to be developed. As with the area-wide estimates of induced traffic, we recommend that a range of elasticity values is used (paragraph 14.26).
15.37 Asa matter of course, whatever mechanism is being used to estimate changes in demand, we recommend that both traffic suppression on the do-minimum network and traffic induction on the do-something network should be allowed for (paragraph 14.28).
15.38 We recommend that the Department issues advice, labelled interim as necessary, which elaborates the advice given in the COBA 9 Manual, about how variable matrix economic evaluations should be undertaken. Variable matrix economic evaluations should be undertaken for collections of schemes at the area-wide level, and for individual schemes, as a matter of course. We recommend that the use of COBA and URECA for variable matrix evaluations should be explored (paragraph 14.31).
15.39 We recommend that advice is issued as a matter of urgency about the approach which should be adopted for appraisal. This advice should naturally address issues such as low and high economic growth scenarios, but also deal with trip suppression and induction with low and high elasticities. In the case of individual schemes, the transport contexts, within which the scheme should be appraised, should be defined. We recommend that the Department issues advice which ensures that the extent of the various tests suggested does not over-burden the appraisal process, but that the sensitivity of all ranges are properly tested (paragraph 14.33).
15.40 We recommend that the Department selects a number of typical schemes at the planning stage, prior to public inquiry, and undertakes pilot studies of these schemes in order to demonstrate how the interim procedures suggested in this chapter could operate (paragraph 14.35).
15.41 By adopting our recommended interim procedures, we believe that the Department will be able to achieve the following:
- • demonstrate the cumulative effects ofrelated trunk road schemes and take account of these effects in the appraisal of the constituent individual schemes; and then either
- • demonstrate that individual schemes will not cause any extra traffic to be induced, in which case the fixed matrix approach to economic evaluation can still be applied; or
- • demonstrate that individual schemes will cause extra traffic to be induced, in which case all methods available to estimate the extra traffic should be used, and the variable matrix method of economic evaluation should be applied.


ANNEX I: MEMBERSHIP OF THE STANDING ADVISORY COMMITTEE ON TRUNK ROAD ASSESSMENT
CHAIRMAN
Mr D Wood QC
Principal of St Hugh's College, Oxford
VICE CHAIRMAN
Mr R H Stewart
Independent Planning Consultant
MEMBERS
Dr D Coombe
Director, The MVA Consultancy
Dr P B Goodwin
Director of the Transport Studies Unit, University of Oxford
Professor P J Hills
Director of the Transport Operations Research Group, University of Newcastle upon Tyne
Mr D A Hutchinson
County Surveyor, Dorset County Council
Mr P J Mackie
Senior Lecturer in Economics, University of Leeds
Miss A M Lees
Environmental Adviser
Formerly Controller of Transportation and Development for the Greater London Council
Mr MEG Taylor
Chairman of Eric R. Taylor (Services) Ltd.
ANNEX II: LETTER TO CONSULTEES (JUNE 1992)
Dear Sir/Madam
STANDING ADVISORY COMMITTEE ON TRUNK ROAD ASSESSMENT (SACTRA)
- 1 You may already know that the Department of Transport has asked SACTRA to examine the way in which current assessment methods deal with the complex responses of road users to changes in the provision of roadspace. The Committee wishes to review all current evidence and opinion on the subject of induced/suppressed traffic and to enable this a consultation exercise is being undertaken. SACTRA's terms of reference for this commission, along with background information on the consultation, are set out at Annex A.
- 2 The consultation has four themes, one addressing the general scope and nature of the topic; and three focused on aspects which the Committee feels warrant particular attention:
the existence and reliability of empirical evidence of induced traffic;
modelling and evaluation issues raised by the existence of induced traffic; and
interaction between land use development and road provision.
The Committee's present perception of these themes is explored in greater detail, as a series of questions, at Annexes B to D.
- 3 We would be very interested to learn your views on the issues raised by these questions. We would also be interested to learn your views on any aspects of induced/suppressed traffic not mentioned, but which you feel to be germane.
- 4 SACTRA recognises that preparing your response could require considerable effort. Photocopies of excerpts from existing reports, suitably annotated and referenced would be perfectly acceptable if this reduces workload. However, if tha respondents wish to prepare a brief report drawing together their experience and knowledge relevant to the above questions, then SACTRA would welcome this. Based on the information received, SACTRA may wish to commission small pieces of work to provide details.
- 5 It may be desirable for SACTRA's report to quote from the submissions made, and it would thus be helpful if permission to use any of the material contained in the submission could be given. Material which should be kept confidential will not be referred to specifically, providing that such material is clearly marked.
- 6 SACTRA will be continuing its investigation throughout the summer and aims to complete its information gathering by 1 September 1992. The Committee cannot, therefore, guarantee to consider submissions received after this date. It would also be extremely helpful if summary or initial information could be provided much sooner than this, to allow the Committee time to follow up the issues raised in greater depth, if it is felt to be necessary_
7 If you are willing to let us have the benefit of your views on this topic, could you please write to our secretary, Ms J Keirl, Room S4/18, 2 Marsham Street, London SWIP 3EB.
Yours sincerely
DEREK WOOD QC Chairman, SACTRA
ANNEX A TO LETTER OF JUNE 1992
SACTRA's Terms of Reference
The particular terms of reference of the remit on this subject are:
"to advise the Department on the evidence on the circumstances, nature and magnitude of traffic redistribution, mode choice and generation, especially on inter-urban roads and trunk roads close to conurbations, and to recommend whether and how the Department's methods should be amended, and what, if any, further research or studies could be undertaken."
The Consultation Exercise
In order to carry out its new remit, the Committee is undertaking a consultation exercise, the aims of which are:
to provide an opportunity for a wide range of people connected in some way with the road appraisal process to express their views on induced traffic to the Committee; and
to provide a means by which the Committee can benefit from the knowledge and experience of acknowledged experts in particular aspects of induced traffic and road scheme appraisal.
"Induced traffic" implies an increase in trips and/or traffic through these mechanisms. The converse of the above mechanisms implies a reduction in trips and/or traffic, and is often termed "traffic or trip suppression". In what follows, the terms "induced traffic" and "suppressed traffic" are used for simplicity to describe all or any combination of the above effects. Both induced traffic and suppressed traffic are of interest of SACTRA.
The term "induced traffic" is used to embrace a number of possible responses to new roads and road improvements, including the following:
rescheduling of existing vehicle trips to take advantage of improved conditions as peak periods;
increasing the frequency of eXIstIng vehicle trips between any gIven orIgIn and destination for any given trip purpose;
decreases in vehicle occupancy, with former passengers using their own private vehicle for their currently made trips;
switching from public transport, cycling and walking to private vehicle for existing trips;
encouraging increased private vehicle ownership and therefore increased use of private vehicle for existing trips;
travelling to new destinations for the same purpose as existing trips; and entirely new vehicle trips.
New roads and road improvements may also encourage changes in the patterns of land use, which in turn lead to changes in the pattern of trips and traffic. In particular, development may increase in the vicinity of the new road or road improvement, thereby leading to additional trips and traffic on the new or improved road.
These considerations suggest that the Committee's Report must address the following general questions, on which we wish to consult widely:
General Questions
Is induced/suppressed traffic a serious issue?
If so what is its importance in terms of:
traffic forecasting; economic evaluation; environmental impact; design standards; politics; and decision making in the road sector.
How well does present assessment and modelling practice deal with induced/suppressed traffic?
What are the factors which have a major effect and in what priority should they be addressed?
Is induced/suppressed traffic to be welcomed or regretted?
What are the future consequences if the issue is not successfully resolved?
In this context what changes, if any, should the Department of Transport make to its current traffic forecasting and economic evaluation and procedures for trunk roads?
ANNEX B TO LETTER OF JUNE 1992
QUESTIONS ON EMPIRICAL EVIDENCE
Outline arguments on the actual evidence concerning traffic have been based on the following types of study:
differential traffic growth rates for different classes of road, locations or times of day, which are more or less close to capacity constraints;
qualitative and quantitative interviews with travellers about their actual or hypothetical responses to changes in the levels of congestion;
statistical evidence on demand elasticities with respect to one or more components of generalised costs;
before-and-after studies, using
- a) traffic counts
- b) travel diaries
- c) various different sorts of models;
studies of time and money travel budgets;
inferences from trends in land-use patterns.
We are interested in collecting and assessing the evidence from these and other studies. In particular we are concerned with:
how strong in the evidence for or against the proposition that the volume and temporal and spatial pattern of traffic is independent of the level of road capacity, distinguishing between the short and longer run effects?
are there sources of actual research work or other evidence (using these or other methods) which should be brought to the Committee's attention?
are there proposals for specific studies which should be carried out to strengthen the available evidence, preferably with recommended suitable contexts?
is there evidence from authorities' own traffic monitoring programme that the provision of new road capacity (or the withdrawal of existing capacity) has any effect on the volume or origin-destinations or temporal pattern of traffic in the network.
ANNEX C TO LETTER OF JUNE 1992
QUESTIONS ON MODELLING AND EVALUATION ISSUES
The Scope of the Consultation on Modelling and Evaluation Issues
There are three aspects on which information is sought at this stage:
what evidence is there from models of the likely magnitudes and importance of the possible effects of road improvements?
what modelling procedures are available for representing the various forms of induced traffic and suppressed traffic?
what are the implications of induced suppressed traffic for evaluation procedures?
Likely Magnitudes of the Responses to New Roads and Road Improvements
The traffic-inducing effects of new roads or road improvements are likely to vary with the level of congestion. The responses in congested areas are thought to be different from those in uncongested areas. What evidence is there about the level of congestion at which induced traffic becomes material?
The magnitude of the induced traffic effects will vary' with the scale of new road or road improvement. What evidence is there about the scale of the additional road capacity at which the responses of travellers start to become important?
Different parts of the modelling process could contribute to varying extents to the total induced traffic caused by a new road or road improvement. What evidence is there of the likely scale of contributions made by each of the submodels in the overall modelling process?
In answering questions such as these, there may well be a need to differentiate between the effects on various outputs from the model, such as traffic flows, traffic delays, vehicle-hours and vehicle-kilometres.
In responding to the above questions, it will be important to establish the quality of the model validation. More credence would normally be placed on well-validated models rather than on those models which replicated existing conditions only poorly.
Likely Responses to the Underprovision of Capacity
When forecasting future year traffic conditions on a do-nothing or do-minimum network, it may be the case that the capacity of the network is insufficient to accommodate the demands in a realistic fashion - future year congestion levels may be so high as to judge unrealistic in comparison with experience today in more congested areas. What evidence is there about the extent to which traffic might be suppressed under these circumstances?
Evaluation Implications
Have you or your organisation been involved in appraisals which allow for different trip levels in the do-minimum and do-something scenarios (ie variable matrices)? Please give brief details of schemes and indicate how the evaluation was conducted.
In these cases, was a fixed matrix evaluation carried out as a "benchmark" test? Do you have any comments on the comparative results?
In these cases, did the use of the variable demand methods make it more difficult to assess the credibility of the model forecasts (link flows, link travel times, etc).
Have you or your organisation ever conducted any studies which sought to validate, ex post, the forecast traffic flows and speeds on an improved network? Please give brief details.
Modelling Mechanisms for Representing Induced Traffic
What models have been developed which relate private vehicle ownership to accessibility by road, such that an improved road system would lead to increased vehicle ownership, and therefore increased levels of trip-making by private vehicle, being forecast?
What models have been developed which relate the levels of trip-making to road accessibility, through either increased private vehicle ownership (as above) or increased trip rates or both, such that an improved road system would lead to increases in the numbers of vehicle trips being forecast?
What methods are available for modelling the redistribution of trips in response to improved road conditions? .
What methods are available for modelling the modal transfer of trips to private vehicle In response to improved road conditions?
What mechanisms have been developed for representing the contraction of peak periods?
What mechanisms have been developed to model the generation of entirely new trips In response to road system improvements?
What mechanisms have been developed to represent the interaction between land use development and transport accessibility, such that the effects of road system improvements on land development could be estimated?
In all these cases, it will be important to establish the theoretical basis for the model, the ease with which it can be calibrated satisfactory, and the reliability of any forecasts produced using the model.
Modelling Mechanisms for Representing Suppressed Traffic
What methods have been developed for estimating the degree to which trips and traffic will be suppressed in response to an inadequate supply of road capacity? Again, the theoretical basis, ease of calibration and reliability in forecasting will be important considerations.
Where cut-offs or matrix capping methods have been applied, what criteria have been used to determine the point at which the matrix is capped?
ANNEX D TO LETTER OF JUNE 1992
QUESTIONS ON THE INTERACTION BETWEEN LAND USE DEVELOPMENT AND ROAD PROVISION
Scope of the Consultation
The relationship between land use and good road access is probably a symbiotic one; without traffic-generating land uses to serve, a road would have no purpose - without good access, development could not thrive. What is open to question and to be tested is whether the relationship is an active one or passive; ie. whether improved road access produces more development, the hence induces more traffic, than would otherwise be the case. If the relationship is a passive one, good access would be beneficial but not a sufficiently strong factor to be the case of the development, or of the traffic generated by it.
Conditions which may demonstrate induced traffic could vary. For a new major stretch of trunk road, presumably a large amount of traffic-generating land use would be needed located so as to feed into its junctions before it could have a measurable impact on traffic flows on the road. On the other hand, a village bypass engulfed by quite modest residential estates could readily show increased flows.
Traffic generated from new development (such as an industrial or residential estate) is subject to planning controls and may be anticipated in local or strategic plans. It is less easy to anticipate significant changes in the use of land or buildings which, although subject to planning controls, may considerably increase traffic generation. Changes in the management of land and buildings within a use class, and thus outside planning control, can likewise have a significant effect on the amount and timing of induced traffic.
Evidence Required
Is there evidence that new roads or road improvements stimulate new development? Does it occur at or near junctions, or also at some remove along feeder roads?
What kind of development is stimulated?
superstores, shopping malls, shopping centres, industry, industrial parks, conversion of old estates, hotels, conference centres, leisure centres, residential, other?
Is there evidence that the new roads or road improvements stimulated development; eg what was the change in the number of planning applications before and after the road scheme was announced or opened?
Is there evidence (measurements of the increased traffic flows resulting from new development, either on its own or with other development?
Are there examples of integrated land use/transportation plans which have been carried out involving major new road or road improvements? If so, what has been the effect of the scheme on development and has the effect been monitored?
Is there evidence that major new roads or road improvements stimulate a change in the use or management of land and. buildings? Has there been any regenerating effect on existing development? Has an access point to a major road caused any knock-on effects in surrounding areas? Has any change caused congestion where is was not anticipated?
Have major new roads or road improvements produced any other effect on development? Have any side-effects been observed, either beneficial or otherwise? Are any measurements available to demonstrate changes?
Can examples of the interactions between new roads or road improvements and land use developments be recommended for detailed study?

ANNEX III: LIST OF THOSE WHO PROVIDED EVIDENCE
A. WRITTEN EVIDENCE
Government Departments
The Department of the Environment The Department of the Environment Northern Ireland The Department of Transport
Highways Economics and Traffic Appraisal Division Regional Office Construction Programme Divisions Regional Office Network Management Divisions
The Industry Department,The Scottish Office
Local Authorities
County of Avon Derbyshire County Council Devon County Council Dover District Council Lancashire County Council London Borough of Hillingdon Greater Manchester Transportation Unit
Interested Organisations
Association of Chief Technical Officers Association of County Councils Association of Metropolitan Authorities British Road Federation Colin Buchanan and Partners Colquhoun Transportation Planning Council for the Protection of Rural England Countryside Commission County Planning Officers Society County Surveyors' Society Cyclists Touring Group English Nature Environmental Transport Association Frank Graham Consulting Engineers Freight Transport Association Friends of the Earth G Maunsell & Partners Hague Consulting Group Halcrow Fox and Associates Institution of Civil Engineers Institution of Highways and Transportation JMP Consultants Ltd Kennedy Henderson Consulting Engineers
LG Mouchel and Partners
London Boroughs Association
London Forum of Amenity and Civic Societies
Marcial Echenique & Partners
Metropolitan Transport Research Unit
Noise Abatement Society
P&O Sterling Security Services Ltd
Putnam, Hayes and Bartlett
RAC Motoring Services
Royal Institute of British Architects
Royal Institution of Chartered Surveyors
Royal Town Planning Institute
Scott Wilson Kirkpatrick Consulting Engineers
The MVA Consultancy
Town and Country Planning Association
Transport & Environment Studies (TEST)
Transport Research Laboratory
Transport 2000
Travers Morgan Transport
University of Aston
University of Southampton
Wootton Jeffrey Consultants
W S Atkins Planning Consultants
Individuals
Dr J J Bates
Mr P Bonsall, University of Leeds
Mr J Brattle
Mr G Crow
Mr J S Dodgson, University of Liverpool
Professor P Jones, University of Westminster
Dr W H K Lam, Hong Kong Polytechnic
Dr R Mackett, University College London
Dr M Mogridge
Mr S Plowden
Dr D Simmonds
Dr H Williams, University of Wales
Dr B Younes
Highway Planning Inquiry Inspectors (six)
B. ATTENDEES AT THE WORKSHOP
Mr P Bonsall
Mr G Crow
Mr J Elliott
Mr H Gunn
Mr P Headicar
Mr I Williams
C. BODIES CONSULTED THROUGH MEETINGS AND/OR ADDITIONAL CORRESPONDENCE
County Planning Officers Association
District Planning Officers Association
East Midlands Regional Office, Department of Transport
Planning Inspectorate (Executive Agency of the Department of the Environment and the Welsh Office)
The Industry Department, The Scottish Office

ANNEX IV: CONSULTANTS' STUDIES
The Work of Huw Williams Mr R Evans
Halcrow Fox and Associates
Land Use/Transport Interactions
Dr R Mackett
University College London
The Application of MEPLAN to
Mr I Williams
Trunk Road Appraisal
Marcial Echenique & Partners
The Application of the START Strategic Transport Model Trunk Road Appraisal
The MVA Consultancy
Regional Highway Traffic Models
The Department of Transport
Matrix Capping Methods
Halcrow Fox and Associates
Elastic Assignment Methods
W S Atkins
Rochester Way Relief Road
Mr G Crow

ANNEX V: THE MAIN STAGES IN THE PLANNING AND CONSTRUCTION OF A TRUNK ROAD
The following is a chronological list of the main events in a trunk road project with a brief description of each.
The Need
The trigger for consideration of a new road may be pressure from public, MPs, Local Authorities etc; monitoring of traffic flows by the Regional Operating Units; prediction of problems in the future; or national policy formulation (White Paper objectives). The perceived need may be to meet environmental concerns (eg reducing local noise and pollution), improve safety, or shorten journey times and reduce congestion.
Route Identification Study
Occasionally there will be a study to examine if there is a strategic or corridor need with a feasible solution. Public transport solutions may be examined, and intermodal surveys may be included. Current and future demands are examined. Possible route corridors will be very approximate. Environmental assessment is likely to concentrate on current problems and identification of sensitive areas rather than detailed estimates of effects of new roads. Studies vary significantly in scope, content and style, but there is a tendency to greater scope than detail.
Scheme Identification Study (Stage 1 Assessment)
Where a need for a new road or improvemel1t to an existing one is identified a more detailed Scheme Identification Study is undertaken.
A Stage 1 assessment will identify the environmental, engineering, economic and traffic advantages, disadvantages and constraints associated with broadly defined improvement strategies.
Programme Entry
Announcements of Ministers' decisions that new schemes should enter the roads programme are normally made in periodic White Papers or Road Reports. The criteria for these reviews reflect policy aims. Entry to the programme implies the Government's intention to progress towards building, providing further work shows scheme is economically and environmentally justified and that it eventually can be afforded; it is not a commitment to build.
Consulting Engineers Appointed
Design and appraisal begins after programme entry with the issue of a brief to the design agent. This sets terminal points and objectives and notes specific problems, environmental constraints, types of solution to be examined and types of traffic, economic and environmental assessments to be carried out. The first major decision stage is the choice of options to be put to Public Consultation.
Alternative Routes Investigated (Stage 2 Assessment)
The aim is for the Secretary of State to be satisfied that he would be prepared to build any of the options to be put to consultation.
A Stage 2 assessment will identify the factors to be taken into account in choosing alternative routes or improvement schemes and thus identify the environmental, engineering, economic and traffic advantages, disadvantages and constraints associated with those routes or schemes. Consultation takes place with local authorities and statutory environmental organisations.
Public Consultation
Public Consultation serves to inform people in the area that a road scheme is being considered to address particular traffic or environmental problems; indicate alternative solutions and their likely consequences; and invite the public to submit views and put forward alternative options. Stage 1 and 2 Assessment Reports are made available to the public.
Scheme Assessment Report
This report inputs the outcome of the public consultation to the other Stage 2 assessment work. The report makes a clear recommendation of a preferred route with reasons.
Preferred Route Announced
The preferred route is determined by the Secretary of State in the light of the Scheme Assessment Report. The line is protected, the statutory blight rules come into play and detailed design work begins.
Detailed Design
This will reflect the need for greater precision in the draft line orders.
Pre Order Publication (Stage 3 Assessment)
This stage identifies clearly the advantages and disadvantages, in environmental, engineering, economic and traffic terms, of the preferred route or scheme option. A particular requirement is an assessment of the significant environmental effects of the project, in accordance with the requirements of section 105A of the Highways Act 1980 (England and Wales), sections 20A and 55A of the Roads (Scotland) Act 1984, or article 39B of the Roads (Northern Ireland) Order 1980, implementing EC Directive 85/337/EEC on Environmental Assessment.
-- -Order Publication Report
This sets out the final scheme details and is the clearance document on all appraisal and design procedures, to ensure all the Department's requirements have been properly met and give approval for continued preparation.
Order Publication (Line Order, Side Roads Order and Compulsory Purchase Order)
If an Environmental Statement is necessary, it will be published with the draft Orders in accordance with national legislation implementing Directive 85/337/EEC. Objections may lead to a Public Inquiry.
Public Inquiry
A public inquiry is held unless, following negotiations, there are no significant objections to the draft Orders. It is a statutory proceeding held before an independent Inspector. Detailed revision of economic and environmental appraisal may continue right up to Public Inquiry. The independent Inspector has available to him all the relevant assessment reports and design drawings, written submissions and proofs of evidence from all parties. Additional papers may be called for during the inquiry and the Department may be called upon to do additional appraisals.
Inspector's Report(s) and Secretaries of State's Decisions
Following the inquiry, the Inspector reports his conclusions and recommendations to the Secretary of State for Transport. The Secretaries of State for Transport and the Environment will issue a joint decision taking account of the Inspector's report, the Environmental Statement and all other factors.
Making of Orders
A decision by the Secretaries of State to proceed with the scheme enables the Orders to be made. This clears the way for the preparation of contract documents.
:=
STAGES IN THE EVOLUTION OF TRUNK ROAD SCHEMES
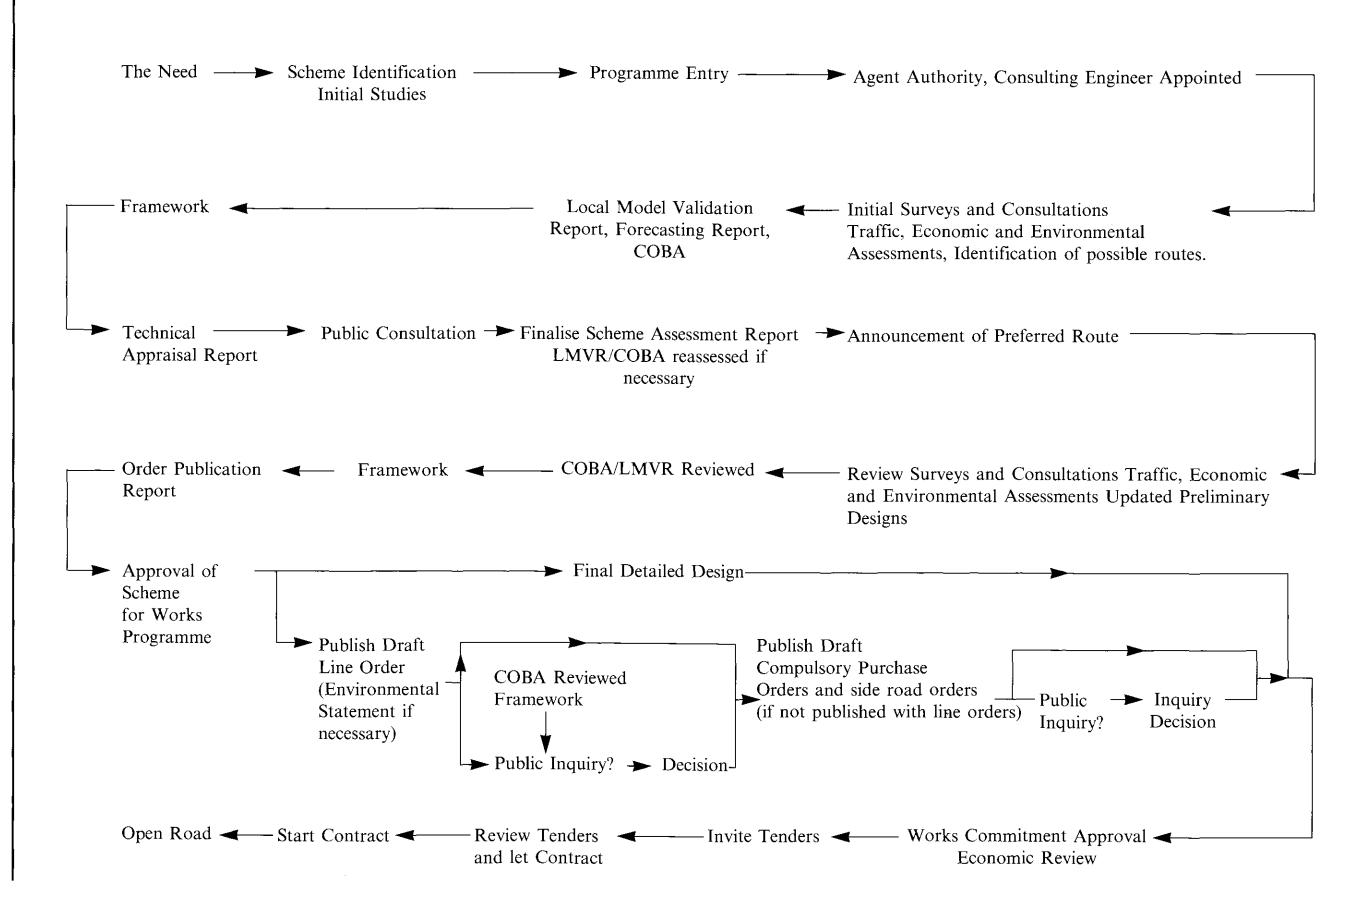

THE STANDING ADVISORY COMMITTEE ON TRUNK ROAD ASSESSMENT 2 MARSHAM STREET LONDON SWIP 3EB
CHAIRMAN: MR DEREK WOOD QC
My Ref:
Rt Hon Dr Brian Mawhinney MP Secretary of State for Transport Your Ref:
September 8th 1994
Sir
I am writing to explain why I do not feel able to sign the SACTRA Report "Trunk Roads and the Generation of Traffic".
I am concerned that as a Committee we have not fully addressed the totality of our Terms of Reference, and particularly not those elements which are now most urgently in need of attention. Instead, the Report has focused on the question of whether traffic is induced by the presence of new trunk road schemes with, in my view, an undue emphasis on the methodology of economic assessment and modelling as a means of improving techniques of traffic forecasting.
I am not in any way critical of the technical competence of the report; I believe that what it contains will command wide acceptance in the professions concerned. What I am concerned about is that if the Report's recommendations are accepted, and particularly those which advocate further work by your Department, it will swing attention and resources further away from those aspects of practice and research which I believe are within our terms of reference and which, in my view, would be more directly in support of the Government's Sustainable Development Strategy.
The objectives of this Strategy which relate to Trunk roads have given added weight to the inter-relationship of transport and land use planning and this is reflected in "Trunk Roads in England 1994 Review" and also Planning Policy Guidance 13 which states "The location and nature of development affect the amount and method of travel; and the pattern of development is itself influenced by transport infrastructure and transport policies". It is this element, the planning of trunk roads taking full account of the inter-action of land use and transport, which requires further consideration.
At present, the essence of the test of the need for a trunk road improvement is one of mobility, that is, how many vehicles the road is expected to carry, and so determine its economic justification and also the land take, the number of carriageways, the design of junctions and so on. So long as there was little congestion, significant pollution, or adverse impact on communities - and no government policies requiring a modified approach, the present system for assessing the need for roads has served. However, as traffic problems have increased, it is necessary also to bring in other tests and this point is made in one way or another as a significant part of the evidence we received, some of which is highlighted in the Report. Perhaps a test more suited to present circumstances would be "how well will the new road serve the needs for accessibility to land uses by road vehicles without unduly damaging the environment or the communities which it is designed to serve." As the Sustainable Development Report states "Serving economic development is an important objective of transport policy. One aim of the Government's framework must be to enable people to enjoy the desired end of access to goods, services and other people (the reason for travel) while substantially reducing the amount of movement needed to acheive that aim."
In my opinion, the methodology used in support of these aims should be, reviewed as a matter of urgency to cover more adequately the interaction of land use and transport. Perhaps the most urgent subject for review is the aim of "access to goods" which in my view is poorly served by the methodology presently used for assessing freight traffic on trunk roads.
I give in a separate commentary, a more detailed description of my concern about the Report, and the basis for the further work which I believe is required and which is supported by the evidence submitted.
I would like to associate myself with the appreciation expressed by Mr Wood of all the help which we have received from your Department.
Yours faithfully
Audrey M Lees
BArch DepTCP ARIBA FRTPI FCIT
TRUNK ROADS AND THE GENERATION OF TRAFFIC Report of the Standing Advisory Committee on Trunk Road Assessment
Minority Commentary by A M Lees
The Report selects for its subject the problem of whether traffic is induced by a new or improved trunk road. Its conclusion is that such traffic probably exists and the report identifies the circumstances in which it is thought to matter, and matter most. Because of the intrinsic difficulties of the subject it has not proved possible to demonstrate conclusively the relative importance of its various components, although there seems little doubt that it exists, and that this has important implications for traffic forecasting and evaluation. It is uncertain how much more accurate forecasting will be if the recommendations are accepted although there is no reason to doubt that it would be improved.
Traffic modelling is expensive by any standards; if the recommendations are accepted, it will inevitably impact on the Department's budget, drawing spending into an increasingly sophisticated and expensive field. While there is no reason to doubt the technical competence of the Report's appraisal and recommendations, it remains to be considered whether that is the direction which future work should follow. An alternative view is that fI there are other more urgent tasks which should be undertaken in meeting a different interpretation of the Terms of Reference of the Committee and these are set out in the following paragraphs. If this view is accepted, there would be a need to ask the Committee to consider their terms of reference urgently, and more comprehensively, while the Department would reserve budget capability to enable further recommendations to be implemented.
Terms of Reference
The Committee's first taks was UTo advise the Department of Transport on the evidence of the cirucmstances nature and magnitude of traffic re-distribution, mode choice and generation (resulting from new road schemes), especially on inter-urban roads and trunk roads close to conurbations; and to recommend whether and how the Department's methods should be amended, and what if any research or studies could be undertakenu . It is this task which is the subject of the Committee's Report and of this Minority Commentary.
A further task, concerning assessing environmental costs and benefits, was discharged by our 1992 report, uAssessing the Environmental Impact of Road Schemes". It dealt in some detai1 with environmental effects in terms of pollutants; very much the ground covered by environmental impact analysis, and now accepted as an increasingly important part of road planning practice. What it did not address, and it was not required that it should, was an assessment of the effect of new road space on communities and human activity, much of which involves land uses. It is an oddity that if the work now being advocated by this commentary is not undertaken, plants and animals may well receive more comprehensive treatment concerning habitat than human beings, in the methodology and procedures for planning turnk roads.
Evidence about the inter-action of land use and road planning
Despite being invited to comment only on the specific issue of induced traffic, a significant number of respondents produced a body of evidence which was concerned with the broader issue of how the need for new road space should be assessed in terms of the inter-action of transport and land use. The Report has highlighted some of this evidence, but only within the context of its adopted subject matter.
The Royal Institution of Chartered Surveyors (RICS) advocated a specially commissioned research project to allow the extensive range of evidence produced at Local Plan Enquiries and Planning Appeals to be comprehensively brought together .... The RICS would welcome the opportunity to contribute to such a research project Finally, the RICS has for a long time recognised and emphasised the importance of the inter-action between land use and transportation planning. The Town and Country Planning Association, also pointed to the close relationship between land use and transport and underlined the need for their integration at both national and local levels. The Countryside Commission calls for clear national and local transport strategies, which flow from integrated land use/transport planning at each levI. The Council for the Protection of Rural England call for land use/transport planning inter-action and integration. Marcial Echenique & Partners from a study of the growth of traffic on motorways and other trunk roads concluded that land use effects make as important a contribution to growth as transport effects Williams and Lawlor say that traffic counts will continue to be important-as will traffic forecasting-but it should be much less concerned with justifying the road by the size of the flows and the speed which can be achieved and much more to do with anticipating and managing the flows to best effect. In other words it is accessibility which should be far more important than mobility.
The Scottish Office, Industry Department drew attention to a national policy UTo provide good accessibility to all parts of Scotland where significant economic activity, including tourism, is carried on or could be expected to develop. U In contrast, the London Boroughs Association and others maintain that there is little evidence to prove a link betwen road investment and economic development. The differing views probably reflect the difficulty of proving the economic benefits of new road space in relation to particular parts of the network.
There was no view expressed that there was no connection between road space and land use development. The Council for the Protection of Rural England consider accessibility to land uses as a critical influene in relation to new trunk road space; the effect is iterative. Increased road space is provided, and there is an immediate improvement in accessibility for the area it serves, but it may impede accessibility in surrounding areas suffering from increased traffic loads. Over time, the benefits can be negated by the development stimulated by the improved accessibility, so that there is a demand for more road space, and conditions at some distance away can deteriorate affecting land uses adversely. (Ref. CPRE Concrete and Tyres). There were other examples, not least reagarding the decentralising effect on development of increased road space leading population and employment to disperse and a consequent increase in the length and number of journeys.
Capacity Planning
Beardwood and Elliott advance an argument for capacity planning, taking account of environmental and land-use factors as well as traffic. Capacity planning is probably most immediately relevant in relation to the edge of urban areas, but also increasingly to large parts of the inter-urban network. Like the human body, the system of traffic arteries is vitally important in serving the main organic activities, but the blood circulation must deiver the optimum supply possible having regard to the interests of the whole body. Congestion in an artery can be inefficient and dangerous, so the supply must be maintained in the proper relationship to the capacity of the system to deliver. Without stretching the analogy too far, overall highway planning and wide area traffic management (possibly together with other less well tried techniques) should provide a traffic load which is in balance with the available space in the circulation system. Particularly on the edge of urban areas, but also increasingly in inter-urban situations, it is the constraint on capacity whether from physical, environmental, economic or social reasons which will dictate the upper limits of the acceptability of traffic flows, not how much traffic can be forced down a section of road and at what speed. Transport 2000 say that policy makers must increasingly choose between letting demand suppress itself naturally through congestion or manage demand through a variety of means.
Procedures
Road are as integral as land and buildings in serving the needs of human activities and it is perhaps not therefore surprising that so much concern was expressed in the evidence at the separation of the planning procedures for changes in trunk roads and land use.
The Royal Town Planning Institute says that the legal and administrative climate required for integrated land use and transport planning is deficient and resources are needed to develop the technical basis in a number of areas. Trunk Road planning occurs almost in isolation of Local Development Planning and strategic Structure Planning. The improvement of roads should be consisent with local environmental and land use policies The need for new trunk roads is decided independently of development planning procedures .... present assessment procedures do not cover it. The Environmental Transport Association considers that the Department of Transport should change its evaluation procedures for trunk roads by phasing out altogether the consideration of user benefits. This seems an extreme point of view but it does have support from others who question whether COBA is not ripe for review. Advocating a review of COBA is well beyond the scope of this note, but the research work and changed procedures being called for through the evidence might provide a groundwork from which such advice could be followed.
In relation to Trunk Roads, the Department of Transport is in effect the developer and the planning authority. Any other type of major lldevelopmentll would be appraised by the local planning authority, and it would have to conform to the requirements of adopted plans, with the decision on it being subject to oversight by the Department of the Environment. Any responsible developer of a major project would undertake a careful analysis of the likely effects of the proposed development not only as to the commercial success of the project and its ability to be serviced by road and other transport modes, but also in terms of an impact analysis of its effect on the environment. When it becomes the subject of a planning application, there would be a thorough assessment on the same lines by the local planning authority, which would in addition assess the development in terms of the economic and social well-being of the communities affected. It seems that the methodology used for other forms of development is not fully employed in the early planning stages of new trunk roads; in my view there could be real benefit in the careful and progressive introduction of such methodology throughout the procedures, ensuring a closer relationship of road and land-use planning. The issues to be addressed by this means are well documented in the Planning Policy Guidance series produced by the Department of the Environment.
Freight
It is to be regretted that so little evidence regarding freight traffic was submitted.
Scottish evidence pointed to the absurdity of counting numbers of vehicles as a measure of economic value where the roads were not carrying trade between the country's major population centres and European countries. Scotland's economy is reliant on exports to the
South, and is underpinned by that traffic which is fundamentally important so people can live and prosper in their communities. Scotland's trade with Europe could be carried on a hundred or so vehicles a day, which pointed to the absurdity of COBA/NESA, in which its economic value can be equated by marginal time savings to a few hundred cars going to B & Q!
Clearly, on the evidence, freight requires further attention, if only to balance the emphasis which present methodology gives to the private car.
Government policy
Obviously it is beyond the scope of this note to comment on policy, only that current procedures and technical support do not appear to be fully behind the full thrust of present policy concerned with trunk roads.
The White Paper ilThis Common Inheritance", recognised the interaction of road space with land use and traffic movement and identified it as a major factor in the achievement of a balanced strategy. This was followed by the Planning Policy Guidance Note 12, which provided more detail about how the planning system would respond to trunk road improvements promoted by Government. Strategic transport and highway facilities were to be included in the land-use policies of Local Plans, taking full account of their economic, social and environmental effects. While provision is made for trunk road policy to be given effect in the Plans, for instance via Regional Planning Guidance, there is little or no indication of how the reverse effects are to be dealt with, that is land use changes and their iterative effect on trunk road planning, yet this is clearly within the adopted policy.
In the Departments of Transport and Environment Joint Memorandum to the Royal Commission on Environmental Pollution (1992) there is a useful summary:
- ill. There are important interactions between transport and landuse. Just as different patterns of development generate particular travel patterns, so transport infrastructure (existing and proposed) can influence the pattern of new development. The location and nature of new development can affect the amount and method of travel.
- 2. It is therefore sensible to consider the provision of new roads, for example, together with other forms of development. The creation of new road capacity has implications for where development might take place. Conversely, new development has implications for existing road capacity.
- It is important that land use planning and the planning of transport infrastructure,are integrated and co-ordinated. The two must therefore be planned together, both within government and at local level." (my italics).
In the more recent Planning Policy Guidance Note 13, the interaction of land use and transportation is the lynch pin of advice to Local Planning Authorities, including a very useful reference to Regional Planning Guidance.
llRegional planning guidance, structure plans and local plans should provide the means for:
- * examining the relationships between transport and land use planning at the difference levels;
- * promoting their integration and co-ordination; and
- * promoting strategies to reduce the need to travel".
It includes a statement that llDecisions on the trunk road programme will take into account the overall strategy set out in regional and strategic guidance."
It is very desirable that the procedures and the technical methods necessary to support these clear policy objectives should be reviewed, perhaps by SACTRA, so that necessary improvements to those systems would yield the benefits of a more direct relationship between government policy and its implementation.
Audrey M Lees
Printed in the United Kingdom for HMSO. Dd.0300076, C15, 12/94, 3400, 5673, 304498.


HMSO publications are available from:
HMSO Publications Centre
(Mail, fax and telephone orders only) PO Box 276, London, SW8 5DT Telephone orders 0171-873 9090 General enquiries '0171-873 0011 (queuing system in operation for both numbers) Fax orders 0171-873 8200
HMSO Bookshops
49 High Holborn, London, WC1V 6HB (counter service only) 0171-873 0011 Fax 0171-831 1326 258 Broad Street, Birmingham, B1 2HE 0121-643 3740 Fax 0121-643 6510 33 Wine Street, Bristol, BS1 2BQ 0117 9264306 Fax 0117 9294515 9-21 Princess Street, Manchester, M60 8AS 0161-834 7201 Fax 0161-833 0634 16 Arthur Street, Belfast, BTl 4GD 0232 238451 Fax 0232 235401 71 Lothian Road, Edinburgh, EH3 9AZ 0131-228 4181 Fax 0131-229 2734
HMSO's Accredited Agents
(see Yellow Pages)
and through good booksellers