roadsafetyannualreport2016.md 1.3 MB
category: literaturenote citekey: roadsafetyannualreport2016 title: Road Safety Annual Report authors: "" year: 2016 date: 2016-00-00 2016 url: "http://www.oecd-ilibrary.org/content/serial/23124571" zotero_key: I9D8K8IH zotero_storage: IM6HS74G collections: statistika folder: 001_artiklid
status: converted

Road Safety Annual Report 2016


Road Safety Annual Report 2016

This work is published under the responsibility of the Secretary-General of the OECD. The opinions expressed and arguments employed herein do not necessarily reflect the official views of OECD member countries.
This document and any map included herein are without prejudice to the status of or sovereignty over any territory, to the delimitation of international frontiers and boundaries and to the name of any territory, city or area.
Please cite this publication as:
OECD/ITF (2016), Road Safety Annual Report 2016, OECD Publishing, Paris. http://dx.doi.org/10.1787/irtad-2016-en
ISBN 978-92-82-10797-3 (print) ISBN 978-92-82-10798-0 (PDF)
Periodical : Road Safety Annual Report ISSN 2312-4563 (print) ISSN 2312-4571 (online)
The statistical data for Israel are supplied by and under the responsibility of the relevant Israeli authorities. The use of such data by the OECD is without prejudice to the status of the Golan Heights, East Jerusalem and Israeli settlements in the West Bank under the terms of international law.
Photo credits: © stock.adobe.com/connel_design.
Corrigenda to OECD publications may be found on line at: www.oecd.org/publishing/corrigenda.htm. © OECD/ITF 2016
You can copy, download or print OECD content for your own use, and you can include excerpts from OECD publications, databases and multimedia products in your own documents, presentations, blogs, websites and teaching materials, provided that suitable acknowledgement of OECD as source and copyright owner is given. All requests for public or commercial use and translation rights should be submitted to rights@oecd.org. Requests for permission to photocopy portions of this material for public or commercial use shall be addressed directly to the Copyright Clearance Center (CCC) at info@copyright.com or the Centre français d'exploitation du droit de copie (CFC) at contact@cfcopies.com.
IRTAD
An International Expert Network and Database on Road Safety Data
The International Traffic Safety Data and Analysis Group (IRTAD) is a permanent working group of the Joint Transport Research Centre of the OECD and the International Transport Forum. It is composed of road safety experts and statisticians from renowned safety research institutes, national road and transport administrations, international organisations, universities, automobile associations, the automobile industry, and others from OECD and non-OECD countries.
Its main objectives are to contribute to international co-operation on safety data and its analysis. Its key outputs are the IRTAD Database that currently publishes safety data from 32 countries and its annual report on road safety performance. It also conducts regular research and analysis on topics related to safety data analysis (e.g. forecasting, relationship between speed and crash risks, road safety and economic developments).
Currently, more than 70 organisations from 40 countries are members or observers of IRTAD – representing a wide range of public and private bodies with a direct interest in road safety (see list of members at the end of the report).
The ambition of IRTAD is to include new countries and to build and maintain a highquality database on road safety information. IRTAD offers a mechanism for the integration of prospective member countries while assisting with improvement of road safety data collection systems, where needed.
The most visible product of the IRTAD Group is the International Road Traffic and Accident Database. The database includes aggregated data on injury accidents, road fatalities, injured and hospitalised road users, as well as relevant exposure data, in relation to factors such as population, motor vehicle fleet, road network length, vehicle-kilometres and seatbelt wearing rates from 32 countries, covering every year since 1970. Key road safety indicators are compiled on a monthly basis. Data on serious injuries based on MAIS3+definitions are being progressively included.
ROAD SAFETY ANNUAL REPORT 2016 © OECD/ITF 2016 3
Foreword
It is with great pleasure that I present the 2016 edition of the Annual Report of the International Traffic Safety Data and Analysis Group (IRTAD) which contains the most recent road safety data and up-to-date information on road safety measures and strategies for 40 countries.
The year 2015 showed, for many countries, an upward trend in the number of road deaths. While good progress was made at the beginning of the decade, this development merits careful monitoring to establish whether this is an incidental, one-off "bad year" or the start of a negative trend. This will be a major task of the IRTAD Group in the coming months.
Throughout 2015 and the first half of 2016, the IRTAD Group continued its expansion in both membership and coverage. This year's report contains information from two additional countries, Mexico and South Africa. The Instituto Mexicano del Transporte (IMT) joined the IRTAD Group in 2016, and the Road Traffic Management Corporation of South Africa is now an observer. Several other countries have expressed interest in joining the Group, highlighting the need and importance of sound road safety data and the value of the IRTAD Group as a global forum of exchange and debate on traffic and road safety data issues.
The expansion of the IRTAD Group is a positive step and the intention is to continue this growth, without compromising the quality of the data. This report therefore makes a distinction between "validated" data and data and information that is "under review". One of the missions of the IRTAD Group is to assist accession countries in improving their national road safety data system. The IRTAD Group offers to undertake a review of the data or, in the case of countries needing more sustained support in establishing a national crash data system, to institute twinning programmes. Successful twinning programmes have already been conducted with tangible positive outcomes.
While this report focuses mainly on fatality data, as the process of collecting and harmonising these data is now routine in many IRTAD countries, we are well aware that this alone is insufficient to understand complex road safety issues. The IRTAD Group made a recommendation several years ago to include serious injury data analysis in the development of road safety strategy and to define a serious injury based on medical diagnosis. They also advocated linking police and health data to assess the real number of traffic casualties. These recommendations were also supported by the European Commission, and several countries have now put in place mechanisms to determine the number of people injured in traffic crashes based on the maximum abbreviated injury score (MAIS). When available, information on serious injury data are presented in the individual country reports and we hope to present comparative information on trends in serious injuries in traffic in future editions of the annual report.
The IRTAD Group has a full and ambitious programme of work. In 2015, the IRTAD Group published two important research reports. The first, Why Does Road Safety Improve When Economic Times Are Hard? examines the relationship between economic performance and road safety and demonstrates that the economic downturn that hit many OECD countries in the 2007-08 period has had a significant impact on the reduction in the number of road fatalities. The second report, Road Infrastructure Safety Management, describes several consolidated Road Infrastructure Safety Management (RISM) procedures, analyses their use worldwide, and identifies possible weaknesses and barriers to their implementation. Two other important reports will be published in 2016: Alcohol-Related Road Casualties in Official Crash Statistics and The Relationship Between Speed and Crash Risks.
In 2015, with the support of the Fédération Internationale de l'Automobile (FIA), IRTAD launched a major project to benchmark the road safety performance of ten Latin American countries. The objective of the project is to offer policy makers in Latin America a tool to assess the weaknesses and strengths of each country in the field of road safety and identify areas deserving policy attention and where the experience of other countries may be usefully applied. Two workshops were held in 2015 and 2016, and a final report is expected later this year.
Finally, IRTAD, also with the support of the FIA, has embarked on the development of a network and safety database at city level. By the end of 2016, the database will be populated with traffic, mobility and safety data from 25 large cities in the world. The network and database will then progressively be expanded to include additional cities. This project will be a major contribution to current Sustainable Development Goals and I expect that this new tool will also be of great value to road safety managers and policy makers responsible for urban development in the 21st century.
Fred Wegman Chairman of IRTAD
| Reader's guide | 9 |
|---|---|
| Executive summary | 13 |
| Chapter 1. Road safety performance in 2014 and 2015 | 17 |
| Chapter 2. Argentina | 39 |
| Chapter 3. Australia | 51 |
| Chapter 4. Austria | 67 |
| Chapter 5. Belgium | 81 |
| Chapter 6. Cambodia | 97 |
| Chapter 7. Canada | 107 |
| Chapter 8. Chile | 121 |
| Chapter 9. Czech Republic | 133 |
| Chapter 10. Denmark | 145 |
| Chapter 11. Finland | 157 |
| Chapter 12. France | 171 |
| Chapter 13. Germany | 189 |
| Chapter 14. Greece | 203 |
| Chapter 15. Hungary | 215 |
| Chapter 16. Iceland | 225 |
| Chapter 17. Ireland | 235 |
| Chapter 18. Israel | 251 |
| Chapter 19. Italy | 263 |
| Chapter 20. Jamaica | 277 |
| Chapter 21. Japan | 287 |
| Chapter 22. Korea | 297 |
| Chapter 23. Lithuania | 311 |
| Chapter 24. Luxembourg | 321 |
| Chapter 25. Malaysia | 329 |
| Chapter 26. Morocco | 341 |
|---|---|
| Chapter 27. Mexico | 351 |
| Chapter 28. The Netherlands | 363 |
| Chapter 29. New Zealand | 379 |
| Chapter 30. Nigeria | 393 |
| Chapter 31. Norway | 401 |
| Chapter 32. Poland | 411 |
| Chapter 33. Portugal | 423 |
| Chapter 34. Serbia | 433 |
| Chapter 35. Slovenia | 445 |
| Chapter 36. South Africa | 457 |
| Chapter 37. Spain | 467 |
| Chapter 38. Sweden | 481 |
| Chapter 39. Switzerland | 495 |
| Chapter 40. United Kingdom | 507 |
| Chapter 41. United States | 521 |
| List of members and observers | 535 |
Follow OECD Publications on:



http://www.facebook.com/OECDPublications

http://www.linkedin.com/groups/OECD-Publications-4645871

http://www.youtube.com/oecdilibrary

http://www.oecd.org/oecddirect/OECD
This book has...

Look for the StatLinks2at the bottom of the tables or graphs in this book. To download the matching Excel® spreadsheet, just type the link into your Internet browser, starting with the http://dx.doi.org prefix, or click on the link from the e-book edition.
Reader's guide
The 2016 Annual Report on Road Safety has been prepared by the International Traffic Safety Data and Analysis Group (IRTAD) and is based on data included in the IRTAD Database.
The IRTAD Group and the IRTAD Database
The International Traffic Safety Data and Analysis Group (IRTAD) is a permanent working group of the Joint Transport Research Centre of the OECD and the International Transport Forum. It is composed of road safety experts and statisticians from renowned safety research institutes, national road and transport administrations, international organisations, universities, automobile associations, the automobile industry, etc.
Currently, more than 70 organisations from 40 OECD and non-OECD countries are members of IRTAD (see list of members and observers at the end of the report).
IRTAD's main objectives are to contribute to international co-operation on safety data and its analysis. Its key outputs are the IRTAD Database and its annual report on road safety performance. It also conducts regular research and analysis on topics related to safety data analysis (e.g. forecasting, relationship between speed and crash risks, road safety and economic developments).
The IRTAD Database includes aggregated data on injury accidents, road fatalities, injured and hospitalised road users, as well as relevant exposure data, in relation to factors such as population, motor vehicle fleet, road network length, vehicle-kilometres and seatbelt wearing rates covering every year since 1970.
The ambition of IRTAD is to include new countries and to build and maintain a high-quality database on road safety information. IRTAD offers a mechanism for the integration of prospective member countries while assisting with improvement of road safety data collection systems, where needed. The IRTAD Group co-operates with a number of partners such as the World Bank's Global Road Safety Facility, the Interamerican Development Bank, the FIA and the FIA Foundation for the Automobile and Society, to involve low and middle-income countries in the work of the Group.
The IRTAD Database currently includes "validated" data from 32 countries. Eight additional countries also provide data and the validation process by the IRTAD Group is on-going.
Summary tables and figures of Chapter 1 only include "validated" data.
Data on serious injuries
Data on serious injuries are being progressively included in the IRTAD Database and are presented in this report when available. The section on "Data collection process" in Chapters 2 to 41 pays particular attention on how countries collect and compile information on serious injuries and about the linking process between police and heath data.
Injury severity should be defined based on medical diagnosis (and not solely on police reports). The IRTAD Group recommends to assess injury severity on the basis of the Abbreviated Injury Scale (AIS) and a serious injury should be defined as one with a Maximum AIS score of 3 or more (MAIS 3+).
The International Classification of Diseases and related Health Problems (ICD)
The ICD is published by the World Health Organization. It provides codes to classify diseases as well as signs, symptoms and external causes of injury or disease. Every health condition can be assigned to a unique category and given a code, of up to six characters. In addition to enabling the storage and retrieval of diagnostic information for clinical, epidemiological and quality purposes, these records also provide the basis for the compilation of national mortality and morbidity statistics by WHO member states. The ICD is revised periodically and is currently in its tenth edition (ICD-10). The 9th edition is still widely used (ICD-9).
Causes of accidents are classified. Traffic injuries have a specific code in the section "external cause", as well as codes to describe the injury.
Abbreviated Injury Scale (AIS)
The AIS – published by the Association for the Advancement of Automotive Medicine – is an internationally agreed tool to describe the severity of injury for each of nine regions of the body: 1 Minor, 2 Moderate, 3 Serious, 4 Severe, 5 Critical, 6 Unsurvivable.
It is possible to convert ICD-9 or -10 codes into AIS.
Maximum Abbreviated Injury Scale (MAIS)
MAIS is the maximum of the AIS scores for each region of the body. It is used to assess the overall severity of various injuries.
Measuring risk and comparing countries
To measure road safety performance and compare safety level across countries, three indicators are commonly used:
- the number of fatalities per head of population (mortality rate)
- the number of fatalities per distance travelled by motorised vehicles (vehicle–kilometres) (fatality risk)
- the number of fatalities per registered motorised vehicles.
Each indicator has pros and cons and in all cases, country comparisons should be interpreted with greatest care, especially between countries with different level of motorisation.
Fatalities per 100 000 inhabitants
The number of inhabitants is the denominator most often used, as the figure is readily available in most countries. This rate expresses the mortality rate, or an overall risk of being killed in traffic, for the average citizen. It can be compared with other causes of death, like heart disease, HIV/Aids, etc. It is useful to compare risk in countries with comparable levels of motorisation. It is, however, not very meaningful to compare safety levels between high-motorised countries and countries where the level of motorisation is low.
10 ROAD SAFETY ANNUAL REPORT 2016 © OECD/ITF 2016
Fatalities per billion vehicle–kilometres
This indicator describes the safety quality of road traffic and theoretically is the best indicator to assess the level of risk of the road network. This indicator does not take into account non-motorised vehicles (such as bicycles), which can in some countries represent a large part of the vehicle fleet and of the fatality figures. Only a limited number of countries collect data on distance travelled.
Fatalities per 10 000 registered (motorised) vehicles
This rate can be seen as an alternative to the previous indicator, although it differs in that the annual distance travelled is unknown. This indicator can therefore only be used to compare the safety performance between countries with similar traffic and car-use characteristics. It requires reliable statistics on the number of vehicles. In some countries, scrapped vehicles are not systematically removed from the registration database, thereby undermining accuracy. This indicator does not take into account non-motorised vehicles (such as bicycles), which can in some countries represent a large part of the vehicle fleet and of the fatality figures.
Content of the report
This report contains 41 chapters.
Chapter 1 presents a synthesis of main road safety trends in IRTAD countries in 2014 and 2015. It also lists the current national road safety strategies and legislation in place regarding drinking and driving, speed limits and the use of seat belt and helmet.
Chapters 2 to 41 present detailed country reports for the 40 IRTAD member and observer countries, focusing on data collection process, most recent safety data, road safety performance by user group, age group and road type and recent trends in road safety behaviour. It also describes national road safety strategies and targets and progress towards these targets.
ROAD SAFETY ANNUAL REPORT 2016 © OECD/ITF 2016 11
Executive summary
Background
Each year, about 1.2 million people die in crashes on the world's roads and many millions are seriously injured. Taking effective action to cut this unacceptable toll begins with reliable data, on the scale of the problem, exposure to crash risks and the effectiveness of policies. Transport ministries, road safety agencies, research institutes, industry and non-governmental organisations co-operate in the International Traffic Safety Data and Analysis Group (IRTAD) to improve collection and analysis of data, understand trends in the rates of death and serious injury and improve the empirical basis for designing more effective road safety policies. Common reporting standards allow benchmarking of performance across the membership of the IRTAD. The group's 2016 Road Safety Annual Report provides the most recent road safety data for member countries, including provisional data for 2015 and an overview of road safety strategies in each country.
At the mid-point of the UN Decade of Action for Road Safety 2011-20, the inclusion of road safety targets in the UN Sustainable Development Goals (SDGs) enhances the visibility, urgency and ambition of global road safety policy. Most countries have national road safety strategies with ambitious targets in place and many of these are aligned with the objectives of the Decade of Action. In April 2016, the UN General Assembly in resolution 70/260 confirmed the SDG road safety targets. SDG 3.2 aspires to reduce global road traffic deaths and injuries by 50% by the year 2020, compared to their 2010 levels, while SDG 11.2 calls to "provide access to safe, affordable, accessible and sustainable transport systems for all, improving road safety, notably by expanding public transport, with special attention to the needs of those in vulnerable situations, women, children, persons with disabilities and older persons" by 2030. The aspiration set by the SDGs now requires countries to intensify their efforts in co-ordinated road safety actions. Part of that effort will be strengthening capacity to collect and analyse road safety data.
Findings
While the 32 IRTAD member countries for which data are consistently available made good progress in reducing road deaths in the first half of the UN Decade of Action – the number of road fatalities fell by 8.8% between 2010 and 2014 – this positive trend faltered in 2015 when the number of road deaths increased in at least 19 countries. Based on the still provisional 2015 data, only nine countries managed to reduce or stabilise their road death toll in 2015.
Looking at the longer-term trend, the number of road fatalities in IRTAD countries decreased by 42% between 2000 and 2014. Many countries saw reductions of over 50%, and some up to 70%. The implementation of more systematic road safety strategies, improvements in road infrastructure and vehicles as well as better road trauma management all contributed. However, the economic downturn that started in 2008 also contributed through its impact on mobility patterns, accounting for up to two thirds of reductions in the number of road deaths according to analysis undertaken by the IRTAD Group.
Five countries achieved fatality rates of three or less deaths per 100 000 inhabitants in 2014: Iceland, Sweden, the United Kingdom, Norway and Switzerland. At the other end of the scale, the rate was 12.3 in the worst performing IRTAD member and 26 per 100 000 among IRTAD observer countries.
Data disaggregated by category of road user shows progress in reducing traffic deaths has been very uneven. The number of car occupants killed decreased in virtually all countries between 2010 and 2014. The number of cyclists killed, however, has increased in 17 of the 32 countries. The number of pedestrians killed in traffic increased in ten countries. In Argentina, Sweden, New Zealand, the United States and the United Kingdom pedestrian fatalities increased by more than 10 %.
Deaths among riders of powered two-wheelers (PTWs) decreased by 20-35% in 20 countries between 2010 and 2014. But three countries – Argentina, Chile and Ireland – saw an increase of more than 40%. Smaller increases between 2% to 10% were recorded in Hungary, Austria and the United States.
Trends in fatalities also differ by age group. In almost all countries, there has been a reduction in the number of young people between 15 and 24 years killed in road crashes. But the number of fatalities among senior citizens aged 65 years and over increased in 16 out of the 32 countries. In many countries seniors now represent the biggest proportion of pedestrian traffic fatalities.
Policy insights
Focus road safety policy on vulnerable road users
While fatalities among car occupants continue to fall everywhere, there is less progress – and in some cases regression – for fatalities among pedestrians, cyclists and notably seniors above 65 years of age. Policy makers should ensure these groups are also made safer. Moreover, measures to protect vulnerable road users improve road safety for everyone.
Enforce drink driving laws, speed limits and the wearing of seat belts and motorcycle helmets
Drink driving, speeding and the non-wearing of seat belts in cars and helmets on motorcycles are leading contributors to crashes resulting in serious and fatal injuries. They represent common safety challenges in all countries and can be tackled through established international best practices even in very different contexts.
Analyse the reasons behind the relatively poor road safety performance in 2015 and adapt policies
The most recent data suggest an interruption in the reduction in the number of road fatalities in IRTAD countries. This development merits careful investigation and monitoring to establish whether what is being observed is an incidental, one-off poor year or the start of a negative trend. Reversal in a single year, especially in countries where the
14 ROAD SAFETY ANNUAL REPORT 2016 © OECD/ITF 2016
number of fatalities is small, can simply reflect statistical variation but the number of countries reporting an increase in deaths is disquieting. Policy makers should therefore seek a thorough understanding of the factors behind this plateauing, in order to adapt road safety policies to continue to deliver progress in the second half of the Decade of Action. Systematic review of existing policies becomes even more pertinent in light of the possibility that up to two thirds of the reduction in road fatalities in the recession following the 2007 financial crisis was the result of changes in mobility behaviour and traffic patterns caused by reduced incomes rather than road safety policies.
Chapter 1
Road safety performance in 2014 and 2015
This chapter presents an overview of road safety data in 2014 for 32 countries, as well as provisional data for 2015. It looks at progress with respect to developments, strategies and targets related to the UN Decade of Action for Road Safety, as well as current national road safety strategies and legislation regarding speed limits, drinking and driving, and the use of seat belts and helmets.
Overall, between 2010 and 2014, the number of road fatalities declined by 8.8% in the 32 member countries of the International Road Traffic and Accident Database (IRTAD) for which data are consistently available. However, in 2015, the number of road deaths increased in at least 19 countries.
Road safety in 2014-15
Most recent fatality data for 2014 and 2015
In 2014, the 32 IRTAD member countries for which data are consistently available1 noted a 1.3% decrease in road fatalities from 2013 and an 8.8% decrease from 2010 (Table 1.1). The decrease in 2014 was however much less than the 2.3% average annual reduction seen over the last five years (2010-2014).
For the same period, based on data from 20 countries, mobility in terms of vehicle kilometres has increased by 1.7% from 2013 and 3% from 2010.
Provisional fatality data for 2015, available for 28 countries, show an upward trend for a large number of countries. The number of fatalities increased in 19 countries, while only nine countries managed to reduce or stabilise their road death toll (Table 1.2). The positive trend on road fatalities over the last few years did not continue in 2015. This development merits careful investigation and monitoring to establish whether what is being observed is an incidental, one-off "bad year" or the start of a negative trend.
Looking at the trend over a longer time span, from 2000 until 2014, the number of road fatalities in IRTAD countries decreased by 42% – which is an impressive achievement for a relatively short period. Many countries saw reductions of over 50%, and some achieved reductions of up to 70%. Contributing elements to this overall good performance include the implementation of systematic road safety strategies, programmes that address the main risk factors (such as speeding and drink driving), improvement in the safety level of road infrastructure and vehicles as well as better road trauma management. In addition, there are strong indications that the economic downturn, which hit many countries from 2008 onward, had a marked effect on decreasing road deaths through its impact on mobility patterns as a result of unemployment and uncertain incomes. According to an IRTAD report (IRTAD, 2015) two-thirds of the reduction in fatalities from 2008-10 can be attributed to the economic recession.
Death rates in 2014
Fatalities per capita
Road mortality in terms of fatalities per 100 000 inhabitants differs substantially between regions. The IRTAD countries with the lowest road fatality rates are located in Europe. In 2014, five countries: Iceland, Sweden, the United Kingdom, Norway and Switzerland recorded less than three fatalities per 100 000 inhabitants. In other regions some countries have fatality rates above 10 (Figure 1.1).
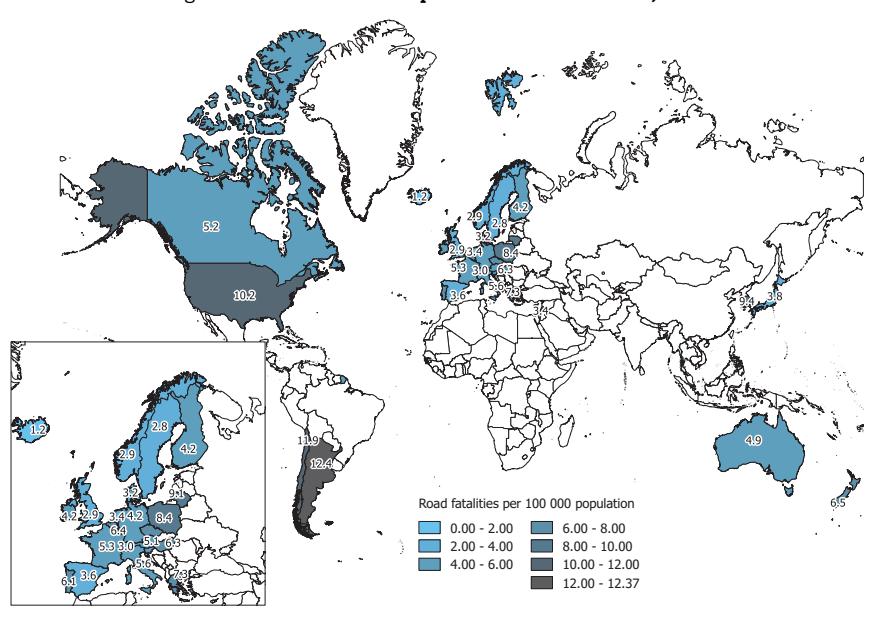
Figure 1.1. Road fatalities per 100 000 inhabitants, 2014
Sixteen countries constitute the league of relatively well-performing countries with fatality rates per 100 000 inhabitants of five or less (Figure 1.2).
Data for some IRTAD accession and observer countries, which have not been reviewed and validated, but are presented in the country reports, indicate much higher rates, up to 26 deaths per 100 000 inhabitants in South Africa for example.
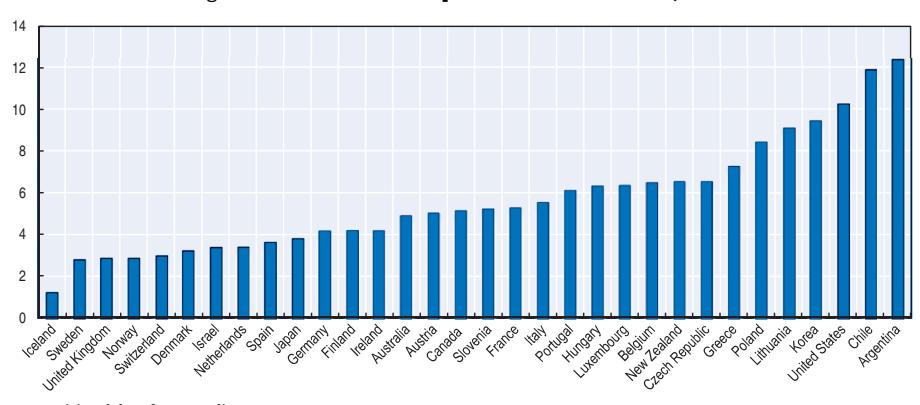
Figure 1.2. Road fatalities per 100 000 inhabitants, 2014
Note: Provisional data for Australia.
1 2 http://dx.doi.org/10.1787/888933385210
While the fatality rate per capita is useful for comparing the performance of countries with similar levels of development and motorisation, its usefulness as a universal tool to rank all countries is limited.
Fatalities per vehicle-kilometres
Analysis in terms of fatalities by distance travelled is a useful indicator for assessing the risk of travelling on the road network. However, only 22 IRTAD countries regularly collect data on vehicle-kilometres travelled (VKT). Data on risks expressed in terms of deaths per billion vehicle kilometres are summarised for these countries in Figure 1.3. In 2014, seven countries – Iceland, Norway, Sweden, the United Kingdom, Denmark, Switzerland and the Netherlands – recorded less than four deaths per billion VKT.
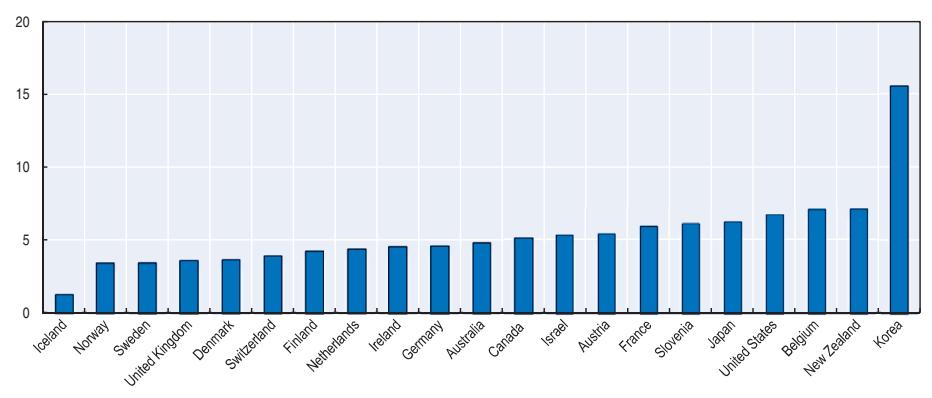
Figure 1.3. Road fatalities per billion vehicle-kilometres, 2014
Note: Provisional data for Australia; estimate for the United Kingdom; 2013 data for Belgium.
1 2 http://dx.doi.org/10.1787/888933385226
Fatalities per registered vehicles
In the absence of data on vehicle kilometres, the fatality rate per registered motor vehicle may be used as an approximation of exposure to risk. Figure 1.4 illustrates risk exposure expressed as the number of deaths per 10 000 registered vehicles.
Based on this indicator, the situation has improved substantially for all countries for which data are available. In 2014, the best-performing countries were Iceland, Norway, Switzerland, Sweden, Finland, the United Kingdom, Spain and Japan with fatality rates below or equal to 0.5 deaths per 10 000 registered vehicles.
Reducing the number of serious injuries
Several IRTAD countries have shown remarkable reductions in road fatalities over the recent decades. However, the numbers of serious injuries are decreasing at a slower pace. Severe injury not only entails grave consequences with regard to quality of life and household income but also has a significantly negative impact on the economy.
Police records alone are usually insufficient to carry out analysis on the nature and consequences of serious injuries, due mainly to underreporting and/or the misreporting of
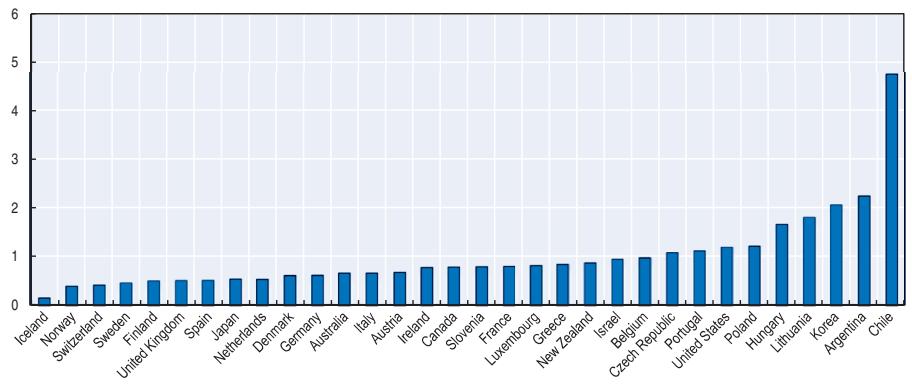
Figure 1.4. Road fatalities per 10 000 registered vehicles, 2014
Note: Total registered motor vehicles do not include mopeds for Belgium, Denmark and 1 2 Hungary; provisional data for Australia. http://dx.doi.org/10.1787/888933385230
the situation. Moreover, international comparisons are not currently feasible, as definitions of a "serious injury" and data collection methods vary widely between countries. The IRTAD report, Reporting on Serious Road Traffic Casualties (ITF, 2011), outlines options for combined analysis of police and hospital data and proposes a common definition of serious injuries on the basis of the Abbreviated Injury Scale (AIS). It also recommends that a serious injury should be defined as one with a Maximum AIS score of 3 or more (MAIS3+).
IRTAD encourages its members to set up adequate mechanisms for such combined and comparative analysis and will gradually enlarge the database to include data on serious injuries based on the MAIS3+ definition. Likewise, European Union (EU) member states have agreed to report MAIS3+ data to the European Commission (EC) for inclusion in the Community Database on Accidents on the Roads in Europe (CARE).
Up to now, only a few countries have been able to provide serious injury data based on the MAIS3+ definition. At this stage, it is too early to make a general analysis of MAIS3+ data trends. However, MAIS3+ data are discussed, when available, in the respective country reports.
Mid-term review of the decade
The UN Decade of Action for Road Safety 2011-2020
While many IRTAD countries have made good progress in recent years, the number of traffic casualties even in the best performing countries is still high and the encouraging results achieved in IRTAD countries only represent a small share (6%) of global road deaths. Every year 1.3 million people are killed and tens of millions injured on the roads. Ninety percent of casualties occur in low and middle-income countries.
In 2011, the United Nations General Assembly proclaimed the UN Decade of Action for Road Safety 2011-2020 in a landmark resolution agreed by 100 countries. In April 2016, the UN General Assembly adopted a resolution on "improving global road safety" (United Nations, 2016). The resolution confirmed the adoption of the Sustainable Development Goal (SDG) targets on road safety outlined in the 2030 Agenda for Sustainable Development. There
Table 1.1. Road fatality trends, 2010-14
| Road fatalities | 2014 % change from | Annual average change1 |
||||||
|---|---|---|---|---|---|---|---|---|
| Country | 2014 | 2013 | 2012 | 2011 | 2010 | 2013 | 2010 | 2014-10 % |
| Argentina | 5 279 | 5 209 | 5 074 | 5 040 | 5 094 | 1.3 | 3.6 | 0.9 |
| Australiap | 1 155 | 1 185 | 1 301 | 1 278 | 1 352 | -2.5 | -14.6 | -3.9 |
| Austria | 430 | 455 | 531 | 523 | 552 | -5.5 | -22.1 | -6.1 |
| Belgium | 727 | 724 | 770 | 861 | 840 | 0.4 | -13.5 | -3.5 |
| Canadap | 1 834 | 1 951 | 2 065 | 2 023 | 2 238 | -6.0 | -18.1 | -4.9 |
| Chile | 2 119 | 2 110 | 1 980 | 2 045 | 2 074 | 0.4 | 2.2 | 0.5 |
| Czech Republic | 688 | 654 | 742 | 773 | 802 | 5.2 | -14.2 | -3.8 |
| Denmark | 182 | 191 | 167 | 220 | 255 | -4.7 | -28.6 | -8.1 |
| Finland | 229 | 258 | 255 | 292 | 272 | -11.2 | -15.8 | -4.2 |
| France | 3 384 | 3 268 | 3 653 | 3 963 | 3 992 | 3.5 | -15.2 | -4.0 |
| Germany | 3 377 | 3 339 | 3 600 | 4 009 | 3 648 | 1.1 | -7.4 | -1.9 |
| Greece | 795 | 879 | 988 | 1141 | 1 258 | -9.6 | -36.8 | -10.8 |
| Hungary | 626 | 591 | 605 | 638 | 740 | 5.9 | -15.4 | -4.1 |
| Iceland | 4 | 15 | 9 | 12 | 8 | -73.3 | -50.0 | -15.9 |
| Ireland | 193 | 188 | 162 | 186 | 212 | 2.7 | -9.0 | -2.3 |
| Israel | 279 | 277 | 261 | 341 | 352 | 0.7 | -20.7 | -5.6 |
| Italy | 3 381 | 3 401 | 3 753 | 3 860 | 4 114 | -0.6 | -17.8 | -4.8 |
| Japan | 4 838 | 5 165 | 5 261 | 5 535 | 5 828 | -6.3 | -17.0 | -4.5 |
| Korea | 4 762 | 5 092 | 5 392 | 5 229 | 5 505 | -6.5 | -13.5 | -3.6 |
| Lithuania | 267 | 258 | 301 | 296 | 299 | 3.5 | -10.7 | -2.8 |
| Luxembourg | 35 | 45 | 34 | 33 | 32 | -22.2 | 9.4 | 2.3 |
| Netherlands | 570 | 570 | 562 | 546 | 640 | 0.0 | -10.9 | -2.9 |
| New Zealand | 295 | 253 | 308 | 284 | 375 | 16.6 | -21.3 | -5.8 |
| Norway | 147 | 187 | 145 | 168 | 208 | -21.4 | -29.3 | -8.3 |
| Poland | 3 202 | 3 357 | 3 571 | 4 189 | 3 908 | -4.6 | -18.1 | -4.9 |
| Portugal | 638 | 637 | 718 | 891 | 937 | 0.2 | -31.9 | -9.2 |
| Slovenia | 108 | 125 | 130 | 141 | 138 | -13.6 | -21.7 | -5.9 |
| Spain | 1 688 | 1 680 | 1 903 | 2 060 | 2 478 | 0.5 | -31.9 | -9.2 |
| Sweden | 270 | 260 | 285 | 319 | 266 | 3.8 | 1.5 | 0.4 |
| Switzerland | 243 | 269 | 339 | 320 | 327 | -9.7 | -25.7 | -7.2 |
| United Kingdom | 1 854 | 1 770 | 1 802 | 1 960 | 1 905 | 4.7 | -2.7 | -0.7 |
| United States | 32 675 | 32 894 | 33 782 | 32 479 | 32 999 | -0.7 | -1.0 | -0.2 |
p = provisional data for 2014.
Source: IRTAD.
1 2 http://dx.doi.org/10.1787/888933385315
are two road safety targets in the SDGs. SDG 3.6 aims to reduce global road traffic deaths and injuries by 50% by 2020 compared to 2010 level and SDG 11.2 for cities aims to provide access to safe, affordable, accessible and sustainable transport systems for all by 2030.
At the mid-point of the UN Decade of Action for road safety, the section below reviews progress made in IRTAD countries since the beginning of the Decade.
Monitoring the progress
Evolution of road deaths
Since 2010, the number of deaths decreased in all countries, except Chile (+2.2% between 2010 and 2015), Argentina (+3.6% between 2010 and 2014) and Luxembourg (3 fatalities more, equivalent to an increase of 12% between 2010 and 2015).
1. Geometric mean: 1-(FatalitiesEndYear/FatalitiesStartYear) 1/n ; n – Number of years.
Note: Police-recorded fatalities (except the Netherlands for 2000 onwards: real data, see country report). Death within 30 days.
Table 1.2. Road fatality data for 2015 compared to 2014
| Country | 2015 Road deaths | Data status | 2014 Road deaths | % change (provisional) |
|---|---|---|---|---|
| Argentina | No estimate available | |||
| Australia | 1 207 | Provisional | 1 155 | 4.5 |
| Austria | 475 | Provisional | 430 | 10.5 |
| Belgium | 755 | Estimate | 727 | 3.9 |
| Canada | No estimate available | |||
| Chile | 2 140 | Provisional | 2 119 | 1.0 |
| Czech Republic | 738 | Final | 688 | 6.4 |
| Denmark | 180 | Provisional | 182 | -1.1 |
| Finland | 260 | Provisional | 229 | 13.5 |
| France | 3 461 | Final | 3 384 | 2.3 |
| Germany | 3 475 | Provisional | 3 377 | 2.9 |
| Greece | 805 | Estimate | 795 | 1.3 |
| Hungary | 647 | Final | 626 | 3.4 |
| Iceland | 16 | Final | 4 | 12 fatalities more |
| Ireland | 166 | Provisional | 193 | -14.0 |
| Israel | 322 | Final | 279 | 15.4 |
| Italy | na | No estimate available | ||
| Japan | 4 859 | Final | 4 838 | 0.4 |
| Korea | 4 621 | Provisional | 4 762 | -3.0 |
| Lithuania | 241 | Provisional | 267 | -9.7 |
| Luxembourg | 36 | Final | 35 | 1 fatality more |
| Netherlands | 621 | Final | 570 | 8.9 |
| New Zealand | 320 | Provisional | 295 | 8.5 |
| Norway | 118 | Final | 147 | -19.7 |
| Poland | 2 938 | Final | 3 202 | -8.2 |
| Portugal | No estimate available | |||
| Slovenia | 120 | Final | 108 | 11.1 |
| Spain | 1 688 | Provisional | 1 688 | |
| Sweden | 259 | Final | 270 | -4.1 |
| Switzerland | 253 | Final | 243 | 4.1 |
| United Kingdom | 1315 (Jan-Sept) | Estimate based on statistical projection for January to September |
1322 (Jan –Sept) | -0.5 |
| United States | 26 000 (Jan-Sept) | Estimate based on statistical projection for January to September |
23 796 (Jan-Sept) | 9.3 |
Note: Police-recorded fatalities (except for the Netherlands).
The large percentage change for Luxembourg illustrates the limits to the usefulness of this statistic in countries with statistically small numbers of deaths due to their size and relatively strong performance. Norway similarly stands with out with a large percentage improvement.
The strongest decreases were observed in Norway (-43.3% between 2010 and 2015), Greece (-36% up to 2015), Portugal (-32% up to 2014) and Spain (-32% up to 2014).
The reduction has been particularly marked in IRTAD countries which were the most affected by the economic downturn. As explained in a recently published IRTAD report (ITF, 2015), the economic downturn from 2008-10 had general negative repercussions on the unemployment rate and contributed to the reduction of the number of road deaths in IRTAD countries. Several factors explain this relationship: a reduction in distance travelled, especially by young men and by heavy goods vehicles, a reduction in speeding and in drink driving and a reduction in the driving licence acquisition rate. Overall the economic
ROAD SAFETY ANNUAL REPORT 2016 © OECD/ITF 2016 23
Table 1.3. Road fatalities per 100 000 inhabitants, per billion vehicle-km and per 10 000 registered motor vehicles
| Killed per 100 000 inhabitants | Killed per billion v-km | Killed per 10 000 registered vehicles | ||||||||||
|---|---|---|---|---|---|---|---|---|---|---|---|---|
| Country | 1990 | 2000 | 2010 | 2014 | 1990 | 2000 | 2010 | 2014 | 1990 | 2000 | 2010 | 2014 |
| Argentina | - | - | 12.6 | 12.4 | - | - | - | - | 2.9 | 2.2 | ||
| Australia | 13.7 | 9.5 | 6.1 | 4.9p | 14.4 | 9.1 | 5.9 | 4.8 | 2.3 | 0.8 | 0.7 | |
| Austria | 20.4 | 12.2 | 6.6 | 5.1 | 32.0 | 15.0 | 7.3 | 5.4 | 3.7 | 1.8 | 0.9 | 0.7 |
| Belgium | 19.9 | 14.4 | 7.7 | 6.4 | 28.1 | 16.3 | 8.5 | 7.1a | 4.3 | 2.6 | 1.3 | 1.0 |
| Canada | 14.3 | 9.5 | 6.6 | 5.2 | - | 9.4 | 6.7 | 5.1 | 2.3 | 1.6 | 1.0 | 0.8 |
| Chile | 15.7 | 14.3 | 12.1 | 11.9 | - | - | - | - | 6.3 | 4.7 | ||
| Czech Republic | 12.5 | 14.5 | 7.7 | 6.5 | 48.3 | 36.7 | 16.2 | 3.3 | 3.2 | 1.3 | 1.1 | |
| Denmark | 12.3 | 9.3 | 4.6 | 3.2 | 17.3 | 10.7 | 5.6 | 3.6 | 2.9 | 2.0 | 0.9 | 0.6 |
| Finland | 13.0 | 7.7 | 5.1 | 4.2 | 16.3 | 8.5 | 5.1 | 4.2 | 2.8 | 1.5 | 0.7 | 0.5 |
| France | 19.4 | 13.9 | 6.4 | 5.3 | 26.2 | 15.8 | 7.1 | 5.9 | 3.6 | 2.3 | 1.0 | 0.8 |
| Germany | 14.2b | 9.1 | 4.5 | 4.2 | 19.7b | 11.3 | 5.2 | 4.6 | 2.5b | 1.4 | 0.7 | 0.6 |
| Greece | 20.3 | 18.7 | 11.2 | 7.3 | - | - | - | - | 7.4 | 3.1 | 1.3 | 0.8 |
| Hungary | 23.4 | 11.7 | 7.4 | 6.3 | - | - | - | - | 11.2 | 4.4 | 2.0 | 1.7 |
| Iceland | 9.5 | 11.5 | 2.5 | 1.2 | 14.9 | 13.8 | 2.5 | 1.2 | 1.7 | 1.8 | 0.3 | 0.1 |
| Ireland | 13.6 | 11.0 | 4.7 | 4.2 | 19.2 | 13.6 | 5.0 | 4.5 | 4.5 | 2.5 | 0.9 | 0.8 |
| Israel | 8.7 | 7.1 | 4.6 | 3.4 | 22.4 | 12.4 | 7.1 | 5.3 | 4.1 | 2.4 | 1.4 | 0.9 |
| Italy | 12.6 | 12.4 | 7.0 | 5.6 | - | - | - | - | 2.1 | 1.6 | 0.8 | 0.7 |
| Japan | 11.8 | 8.2 | 4.6 | 3.8 | 23.2 | 13.4 | 8.0 | 6.2 | 1.9 | 1.2 | 0.6 | 0.5 |
| Korea | 33.1 | 21.8 | 11.3 | 9.4 | - | 49.5 | 18.7 | 15.5 | 28.9 | 6.9 | 2.6 | 2.1 |
| Lithuania | 26.9 | 18.2 | 9.5 | 9.1 | - | - | - | - | 11.8 | 5.0 | 1.4 | 1.8 |
| Luxembourg | 18.7 | 17.5 | 6.4 | 6.4 | - | - | - | - | 3.3 | 2.4 | 0.8 | 0.8 |
| Netherlandsc | 9.2 | 7.3 | 3.9 | 3.4 | 14.2 | 10.0 | 4.8 | 4.3 | 2.2 | 1.4 | 0.6 | 0.5 |
| New Zealand | 21.4 | 12.0 | 8.6 | 6.5 | - | 13.6 | 9.4 | 7.1 | 3.3 | 1.8 | 1.2 | 0.9 |
| Norway | 7.8 | 7.6 | 4.3 | 2.9 | 12.0 | 10.5 | 4.9 | 3.4 | 1.4 | 1.2 | 0.6 | 0.4 |
| Poland | 19.3 | 16.4 | 10.2 | 8.4 | - | - | - | - | 8.1 | 4.4 | 1.7 | 1.2 |
| Portugal | 29.3 | 20.0 | 8.9 | 6.1 | - | - | - | - | 13.4 | 3.9 | 1.6 | 1.1 |
| Slovenia | 25.9 | 15.8 | 6.7 | 5.2 | 65.1 | 26.7 | 7.7 | 6.1 | 6.9 | 3.2 | 1.0 | 0.8 |
| Spain | 23.3 | 14.4 | 5.3 | 3.6 | - | - | - | - | 5.1 | 2.2 | 0.7 | 0.5 |
| Sweden | 9.1 | 6.7 | 2.8 | 2.8 | 12.0 | 8.5 | 3.5 | 3.4 | 1.7 | 1.2 | 0.5 | 0.5 |
| Switzerland | 13.9 | 8.3 | 4.2 | 3.0 | 18.6 | 10.6 | 5.2 | 3.9 | 2.2 | 1.2 | 0.6 | 0.4 |
| United Kingdom | 9.4 | 6.1 | 3.0 | 2.9 | 12.8 | 7.4 | 3.8 | 3.6e | 2.1 | 1.2 | 0.5 | 0.5 |
| United States | 17.9 | 14.9 | 10.7 | 10.2 | 12.9 | 9.5 | 6.9 | 6.7 | 2.4 | 1.9 | 1.3 | 1.2 |
Death within 30 days. Police recorded data (except for the Netherlands for 2000 onwards, see country report)
1 2 http://dx.doi.org/10.1787/888933385323
downturn may well have contributed to about two-thirds of the decrease in fatalities between 2008 and 2010. Over more recent years, though, traffic levels have risen again, nearing or exceeding the pre-recession levels in the affected countries. This might explain the generally poor performance in 2015 and suggests that the number of road deaths could start increasing again unless strong measures are taken.
The reduction in roads deaths since 2010 has been modest in traditional "best" performing countries such as Sweden, the United Kingdom and the Netherlands. While these countries achieved notable success during the previous decades and have among the lowest fatality rates, these modest reductions may also reveal the limit of current safety measures and the need for further innovation in road safety policies.
a = 2013.
b = 1991. c = "real" data for the Netherlands for 2000 onwards.
-50% -40% -30% -20% -10% 0% 10% 2010-2014 2010-2015
Figure 1.5. Percentage change in the number of road deaths, 2010-15 (or 2010-14 where 2015 provisional data are not available)
Note: Iceland and Luxembourg not included due to wide yearly fluctuations.
1 2 http://dx.doi.org/10.1787/888933385247
Cyclists
Against the background of the general improvement between 2010 and 2014, there are wide variations in progress in reducing deaths between road user categories. While the number of car occupants killed has decreased in virtually all countries since 2010, the number of cyclists killed has increased in 17 countries out of the 32 countries for which data are available and validated (Figure 1.6).
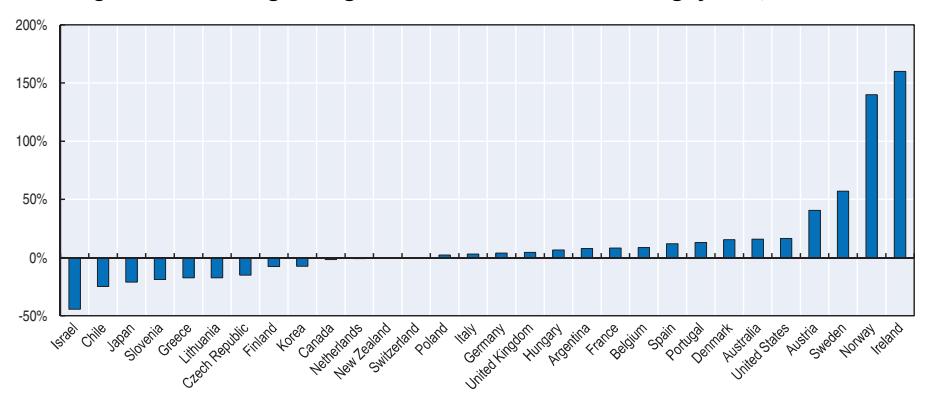
Figure 1.6. Percentage change in the number of deaths among cyclists, 2010-14
Note: Luxembourg and Iceland: no cyclist fatalities in 2014. Ireland reached its lowest level of cyclist fatalities in 2010, which explains the substantial increase seen between 2010 and 2014.
1 2 http://dx.doi.org/10.1787/888933385258
The increase in the number of cyclist fatalities is in part related to the growing popularity of cycling in many IRTAD countries, in the context of wide promotion of active mobility, without always seeing parallel development of the necessary cycling infrastructure. A mild
ROAD SAFETY ANNUAL REPORT 2016 © OECD/ITF 2016 25
winter and a warm and early spring in 2014 in many European countries are also cited among the contributing factors resulting in more cyclists on the roads. In several countries, the increasing use of the E-bikes, considered by some countries to be more hazardous than traditional pedal bicycles, clearly needs further attention.
Pedestrians
Between 2010 and 2014, the number of pedestrians killed in traffic increased in ten countries (see Figure 1.7). In Argentina, Sweden, New Zealand, the United States and the United Kingdom pedestrian fatalities increased by more than 10%, with a significant increase seen in Argentina and Sweden (however 2015 figures are back to the 2010 level in Sweden and New Zealand). In many countries the biggest proportion of pedestrian fatalities was among the group of those aged 65 and above.
-60% -40% -20% 20% 40% 60% 80%
Figure 1.7. Percentage change in the number of deaths among pedestrians, 2010-14
Note: Iceland and Luxembourg not included in the graph, due to wide yearly fluctuations, as ab 1 2 solute numbers are very low. http://dx.doi.org/10.1787/888933385266
Powered two-wheelers (PTW)
While the safety of riders of powered two-wheelers (motorcycles and mopeds) deteriorated in many countries up to 2010, significant improvement has been recorded since then in 26 out of 32 countries. In 20 of them, PTW fatalities decreased by 20-35% between 2010 and 2014. At the same time, Argentina, Chile and Ireland saw an increase in fatalities for this road user group of more than 40%. Smaller increases, within the range of 2-10% have been recorded in Hungary, Austria and the United States.
Car occupants
Car occupants are the user category that has benefited the most from road safety improvements. All countries have recorded significant improvements, except Chile. The improvement in car occupant safety was greatest in Israel, Greece, Spain and Portugal where the number of deaths among car occupants decreased between 39-50% from 2010 to 2014. Seventeen more countries recorded a decrease in car occupant fatalities in the range of 20-30% (Figure 1.9). IRTAD does not have disaggregated crash data but several studies (e.g. Kahane, 2015) showed that the penetration of safer cars (for example equipped with
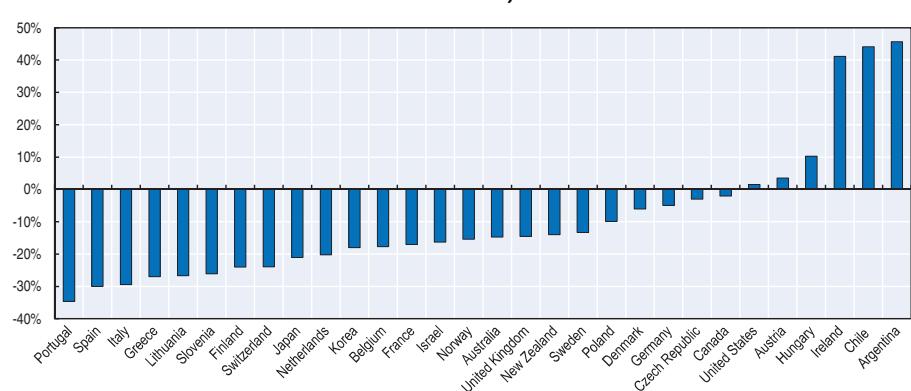
Figure 1.8. Percentage change in the number of deaths among powered two-wheeler users, 2010-14
Note: Iceland and Luxembourg not included in the graph, due to wide yearly fluctuations, as absolute numbers are very low. Ireland had a particularly low level of PTW fatalities in 2010.
1 2 http://dx.doi.org/10.1787/888933385278
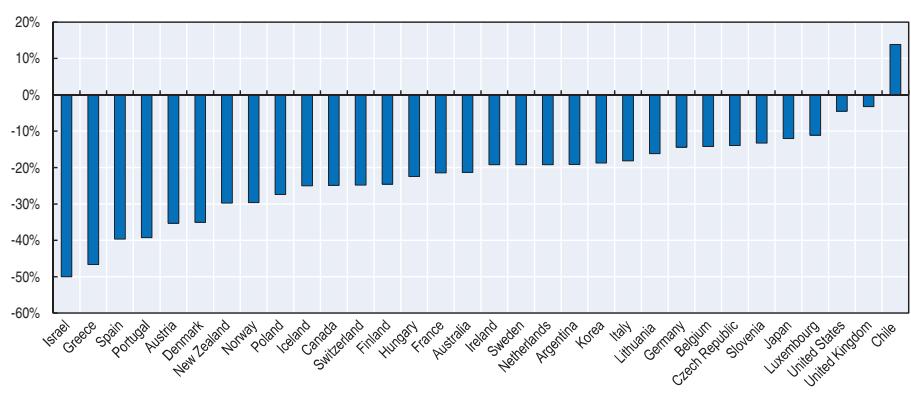
Figure 1.9. Percentage change in the number of deaths among car occupants, 2010-14
Note: Iceland not included in the graph, due to wide yearly fluctuations, as absolute numbers are very low. 1 2 http://dx.doi.org/10.1787/888933385288
electronic stability control, anti-lock braking, etc.) and the replacement of older models have certainly contributed to this progress.
Young people and senior citizens
For most countries there is wide variation in fatality reductions for different age categories. While the number of young people killed between 15 and 24 years of age decreased in almost all countries (except Argentina and Chile), the number of fatalities among senior citizens aged 65 years and over increased in 16 out of the 32 countries for which data are available and validated (Figures 1.10 and 1.11).
ROAD SAFETY ANNUAL REPORT 2016 © OECD/ITF 2016 27
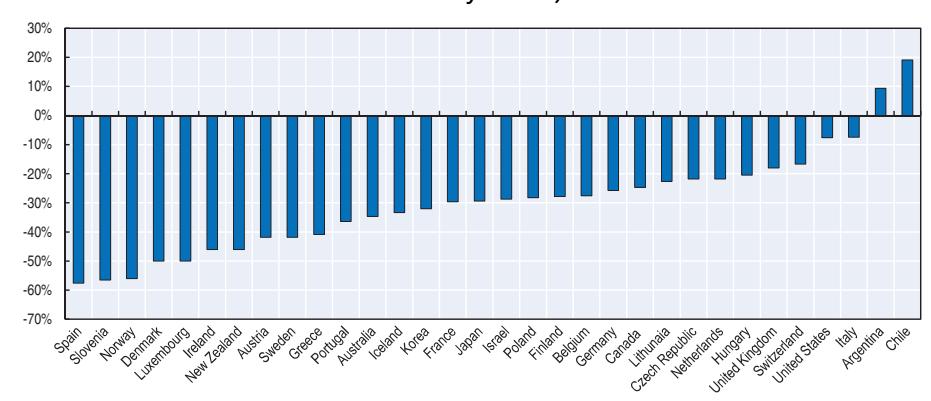
Figure 1.10. Percentage change in the number of deaths among young road users 15-24 years old, 2010-14
Note: Iceland not included in the graph, due to wide yearly fluctuations, as absolute numbers are very low. 1 2 http://dx.doi.org/10.1787/888933385291
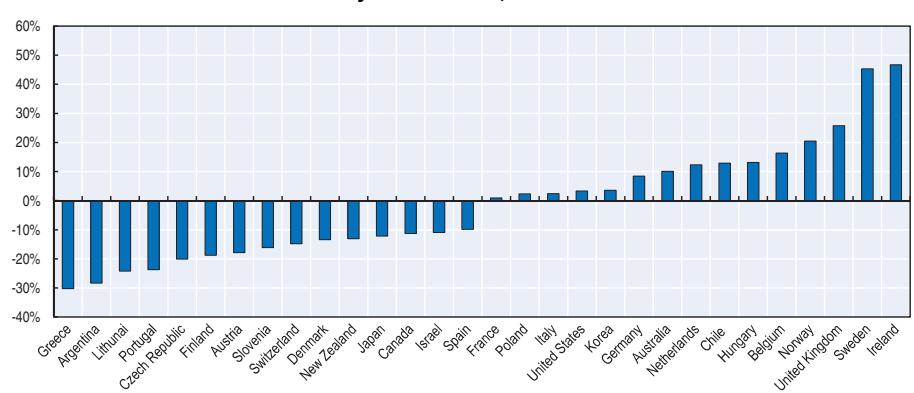
Figure 1.11. Percentage change in the number of deaths among population 65 years and over, 2010-14
Note: Provisional data for Australia. Iceland and Luxembourg not included in the graph due to wide yearly fluctuations, as absolute numbers are very low.
1 2 http://dx.doi.org/10.1787/888933385307
All countries report the general ageing of the population and their increased use of the transport system. In IRTAD countries, between 2010 and 2014, the number of people aged 65 and over increased by more than 10%, with the proportion in the total population growing from 16% to 18%.
National Road Safety Strategies
This section summarises the strategies and targets followed by IRTAD member and observer countries. More information can be found in the individual country reports that follow.
28 ROAD SAFETY ANNUAL REPORT 2016 © OECD/ITF 2016
Table 1.4. National road safety strategies and targets
| International strategies | Vision | Targets |
|---|---|---|
| United Nations Decade of Action for Road Safety 2011-20 Global Plan for the Decade of Action |
Stabilise and then reduce the forecasted level of road traffic fatalities around the world by increasing activities conducted at the national, regional and global levels |
|
| United Nations Sustainable Development Goals |
SDG targets to halve road deaths by 2020 and to improve road safety in cities Goal 3.6 (health): By 2020, halve the number of global deaths and injuries from road traffic accidents Goal 11.2 (cities) : By 2030, provide access to safe, affordable, accessible and sustainable transport systems for all, improving road safety, notably by expanding public transport, with special attention to the needs of those in vulnerable situations, women, children, persons with disabilities and older persons |
|
| European Union Policy Orientations on Road Safety 2011-20 |
Towards Zero | -50% fatalities by 2020 (base year: 2010) |
| Country/Strategy/timeframe | Vision | Targets |
| Argentina National Road Safety Strategy |
Based on the UN Road Safety Plan for the Decade of Action for Road Safety |
-50% fatalities by 2014, base year 2009 Specific targets for 2020 are being developed |
| Australia National Road Safety Strategy (NRSS) 2011-20 |
Safe System No-one should be killed or seriously injured on Australia's roads |
-30% (at least) fatalities by 2020 -30% (at least) severely injured by 2020 Base year average 2008-2010 |
| Austria Austrian Road Safety Programme 2011-20 |
Safe system Become one of the five safest countries in Europe |
-50% fatalities by 2020, based on the average for the years 2008-10 (Interim target: -25% by 2015) -40% serious injuries by 2020, based on the average for the years 2008-10 (Interim target: -20% by 2015) -20% injury accidents by 2020, based on the average for the years 2008-10 (Interim targets: -10% by 2015) |
| Belgium Recommendations for 15 priority measures for a period of 2015-20 |
EU Road Safety Target adopted | -50% fatalities in 2020 in comparison to 2010 (420 road deaths in 2020) |
| Cambodia National Plan for Road Safety 2011-20 (approved by the Council of Ministers in 2014) |
Based on the UN Road Safety Plan for the Decade of Action for Road Safety |
Reduce by 50% the forecasted number of fatalities by 2020 Several sub-targets on helmet wearing rates, speed, drink-driving |
| Canada Road Safety Strategy (RSS) 2025 (introduced in January 2016) |
Towards Zero | No hard numerical targets Continual downward trend in fatalities and serious injuries averaged over 3 years compared to the baseline period |
| Chile Road Safety Plan 2011-14 A new National Road Safety Strategy in preparation |
-20% road deaths by 2014 in comparison with 2011 level | |
| Czech Republic The National Strategic Road Safety Plan 2011-20 |
Vision Zero | Reduce fatality rate to EU 27 average No more than 360 fatalities in 2020 (-60%) No more than 2 100 seriously injured in 2020 (-40%) Base year 2009 |
| Denmark Danish Road Safety Commission National Action Plan, 2013-20 |
Based on Vision Zero | Fewer than 120 killed in 2020, equivalent to 53 % fatalities compared to 2010 (based on EU Road Safety target) 52% serious and slightly injured road users |
| Finland National Road Safety Strategy 2012-14 ended. A new programme is under preparation. |
Based on EU Road Safety Target | Fewer than 137 fatalities (or 24 fatalities per million inhabitants) by 2020 Fewer than 5 750 injuries by 2020 (based on EU Road Safety target) Long term target: fewer than 100 fatalities by 2025 |
| France Action Plan for Road Safety, including 26 measures announced by Minister of Interior in January 2015 55 measures announced during the Inter-ministerial Road Safety Committee (October 2015) |
Based on EU Road Safety target | -50% fatalities by 2020 (fewer than 2 000 fatalities) |
| Germany Road Safety Programme 2011-20 |
-40% fatalities by 2020 (base year: 2010) |
Table 1.4. National road safety strategies and targets (cont.)
| Country/Strategy/timeframe | Vision | Targets |
|---|---|---|
| Greece National Strategic Road Safety Plan 2011-20 |
Developing a road safety culture | -50 % fatalities by 2020 (based on EU Road Safety target); base year: 2010 Interim targets: reduction by 80 road fatalities per year between 2010-2015 and 50 road fatalities per year between 2016-2020 |
| Hungary Road Safety Action Programme 2014-16 National Transport Strategy under preparation Iceland |
2016 target is 518 fatalities -50 % fatalities by 2020 compared to 2010 (based on EU Road Safety target); Rate per 100 000 inhabitants should not be higher than in the |
|
| Traffic Safety Plan 2011-22 | best countries by 2022 Average annual reduction in killed and seriously injured of 5%. 11 sub-targets defined |
|
| Ireland Road Safety Strategy 2013-20 |
Reduction of road collision fatalities on Irish roads to 25 per million inhabitants or less by 2020. Provisional target for the reduction of serious injuries by 30% from 472 (2011), or fewer, to 330 by 2020 or 61 per million population. Specific targets for reducing speed and to increase restraint use. |
|
| Israel National Road Safety Plan 2020 |
Fewer than 240 fatalities per year by 2020. | |
| Italy National Road Safety Plan Horizon 2020 (final approval by an inter-ministerial board expected) |
No child should die on the road. | -50% fatalities by 2020 (under consideration) (based on EU Road Safety target) Mid-term target (under consideration) an average annual reduction rate of fatalities of 7%, corresponding to a reduction of 38% in 2017 (with reference to 2010 fatalities). |
| Jamaica | Fewer than 240 deaths by 2016. | |
| National Road Safety Policy 2012-15 Japan 10th Traffic Safety Programme 2016-20 |
Make Japan the safest country for road traffic |
Fewer than 2 500 deaths (deaths within 24 hours) by 2020 Fewer than 500 000 casualties by 2020 |
| Korea 7th National Transport Safety Plan 2013-17 (new target for 2020 under discussion) |
Reach the average safety level of OECD countries |
Less than 1.64 fatalities per 10 000 vehicles by 2017 This represents a 40% reduction in fatalities compared to 2012 level Fewer than 4 000 fatalities by 2017 |
| Lithuania Road Safety Strategy 2011-17 |
No one should be killed or seriously injured on Lithuania's roads |
To be ranked among the 10 best performing countries in the EU (or less than 60 fatalities per million inhabitants) |
| Luxembourg Road Safety Action Plan 2014-18 adopted on 8 December 2014 |
Vision Zero | -50 % fatalities by 2020 compared to 2010 (based on EU Road Safety target); |
| Malaysia Road Safety Plan 2014-2020 |
Based on the UN Road Safety Plan for the Decade of Action for Road Safety |
Reduce by 50% the forecasted number of fatalities by 2020 (this corresponds to a 22% reduction compared to 2010) |
| Mexico Estrategia Nacional de Seguridad Vial 2011-20 |
Based on the UN Road Safety Plan for the Decade of Action for Road Safety |
-50% fatalities by 2020 |
| Morocco National Road Safety Strategy 2004-2013; Strategic Orientations for 2014-15 Road Safety Strategy 2016-25 in preparation |
-25% fatalities by 2020 compared to 2016 (or less than 2 800 fatalities by 2020) - 50% fatalities by 2025 compared to 2016 (or less than 1 900 fatalities by 2025) |
|
| Netherlands Road Safety Strategic Plan 2008-20 |
Sustainable Safety | Fewer than 500 fatalities by 2020 Fewer than 10 600 serious road injuries (MAIS2+) by 2020 |
| New Zealand Safer Journeys: Road Safety Strategy 2010-20 3rd Action Plan for 2016-2020 under preparation |
Safe System A safe road system increasingly free of death and serious injury |
No overall targets Several sub targets |
| Nigeria Road Safety Strategy 2014-18 |
Having one of the 20 safest road networks in the world by 2020 Based on the UN Road Safety Plan for the Decade of Action for Road Safety. Becoming a country where road traffic crashes result in no death |
-50% fatalities by 2015 compared to 2007 level - 50% fatalities by 2020 in comparison with 2010 level (based on UN Decade of Action Plan) |
| Norway Road Safety Strategy 2014-24 National Plan of Action for Road Traffic Safety 2014-17 |
Vision Zero | Fewer than 500 fatalities and serious injuries by 2024. |
Table 1.4. National road safety strategies and targets (cont.)
| Country/Strategy/timeframe | Vision | Targets |
|---|---|---|
| Poland National Road Safety Programme 2013-20 Portugal |
Vision Zero | -50% fatalities by 2020 (based on EU Road Safety target) -40% severely injured by 2020 Base year 2010 62 fatalities per million inhabitants in 2015 |
| National Road Safety Strategy 2008-15 2013-15 plan approved |
||
| Serbia National Strategy for Road Traffic Safety for the period 2015-2020 (adopted in June 2015) |
No child killed in traffic by 2020 -50% fatalities and serious injuries by 2020 compared to 2011 Halving by 2020 the total annual social-economic costs of traffic crashes compared to 2011 level Several sub-targets on seatbelt wearing rates, child restraint usage, helmet wearing rates, speed and drink-driving |
|
| Slovenia National Road Safety Programme 2013-22 |
Vision Zero No fatalities and no one seriously injured on Slovenian roads |
-50 % fatalities by 2022 or less than 35 fatalities per million inhabitants -50 % seriously injured by 2022 or less than 230 seriously injured per million inhabitants |
| Spain Road Safety Strategy 2011-20 |
Safe system/Vision Zero. Citizens have the right to a Safe Mobility System in which everyone involved has a responsibility |
Less than 3.7 killed per 100 000 population aligned with the European 2020 target -35% seriously injured compared to 2009 Several targets for various performance indicators (restraint systems, speed, drink-driving, etc.) |
| South Africa National Road Safety Strategy 2016-30 |
Aligned with the United Nations Decade of Action pillars |
Target under consideration: -50% fatalities by 2030 compared to 2010. |
| Sweden No safety plan in a traditional sense |
Vision Zero | -50% fatalities between 2007 and 2020 (the average for 2006-08 is used as the base figure), i.e. max. 220 deaths by 2020. -25% severely injured between 2007 and 2020. |
| Switzerland Via Sicura Adopted in June 2012 by Swiss Federal Council |
No hard numerical targets Range of targeted measures |
|
| United Kingdom (Great Britain) Road safety statement: "Working together to build a safer road system" |
Safe System approach. | Road safety statement provides a road safety strategy for the immediate future. The strategy sets out the context of road safety in Britain today and the overarching scope of road safety activity for the government. It will be followed by consultations on specific issues as options are developed. The statement covers road safety policy within Britain as governed by the Department for Transport (DfT). |
| United States | Dedicated to achieving the highest standards of excellence in motor vehicle safety and reducing deaths, injuries and economic losses resulting from motor vehicle crashes. |
Performance targets set to end 2016 Less than 1.02 fatalities per 100 million vehicle miles travelled in 2016 Performance targets for four sub measures: large trucks, passenger vehicles, non-occupants, and motorcycles |
Priority challenges for road safety
Drink driving, speeding, non-wearing of seat belts and motorcycle helmets represent common safety challenges in all countries. The sections below summarise existing regulations and practices regarding maximum authorised blood alcohol content, speed limits, seat belt and helmet use.
Drink driving
All IRTAD and observer countries have established maximum authorised blood alcohol content (BAC) for drivers as one of the primary measures to prevent crashes, injuries and fatalities caused by drink driving. General BAC levels in these countries vary from 0.0 g/l in Czech Republic and Hungary to 0.8 g/l in Canada, Jamaica, Malaysia, the United Kingdom and the United States. The most common maximum authorised BAC level is 0.5 g/l. Most of the countries also apply lower BAC levels for novice, young and professional drivers (see Table 1.5).
Table 1.5. Maximum authorised blood alcohol content, 2016
| Country | General BAC level | Differentiated BAC for novice drivers, professional drivers |
|---|---|---|
| Argentina | 0.5g/l | 0.0 g/l for professional drivers |
| Australia | 0.5 g/l | 0.0 g/l for novice drivers |
| 0.2 g/l for professional drivers | ||
| Austria | 0.5 g/l | 0.1 g/l for moped drivers younger than 20 years; novice drivers (less than 2 years), truck and bus drivers |
| Belgium | 0.5 g/l | 0.2 g/l for professional drivers (since January 2015) |
| Cambodia | 0.5 g/l | - |
| Canada | 0.8 g/l administrative maximum level of 0.4 g/l or 0.5 g/l. in most provinces |
0.0 g/l administrative maximum level for novice and young drivers in most provinces |
| Chile | 0.3 g/l | - |
| Czech Republic | 0.0 g/l | - |
| Denmark | 0.5 g/l | - |
| Finland | 0.5 g/l | - |
| France | 0.5 g/l | 0.2 g/l for bus/coach drivers, novice drivers |
| Germany | 0.5 g/l Drivers with a BAC between 0.3-0.5 g/l can have their licenses suspended if their driving ability is impaired |
0.0 g/l for drivers under 21 and novice drivers 0.0 g/l for professional drivers who transport passengers or hazardous goods |
| Greece | 0.5 g/l | 0.2 g/l for professional drivers, motorcycles and moped riders |
| Hungary | 0.0 g/l (sanctions when BAC > 0.2 g/l) | - |
| Iceland | 0.5 g/l | - |
| Ireland | 0.5 g/l | 0.2g/l for learner, novice and professional drivers |
| Israel | 0.5 g/l | 0.1 g/l for young, novice and professional drivers |
| Italy | 0.5 g/l | 0.0 g/l for young, novice and professional drivers. |
| Jamaica | 0.8 g/l | - |
| Japan | 0.3 g/l | - |
| Korea | 0.5 g/l | - |
| Lithuania | 0.4 g/l | 0.0 g/l for novice, professional, moped and motorcycle drivers since January 2015 |
| Luxembourg | 0.5 g/l | 0.2 g/l for novice and professional drivers |
| Malaysia | 0.8 g/l | - |
| Mexico | 0.8 g/ (may vary by state) | 0.3 g/l for professional drivers (may vary by state) |
| Morocco | 0.2 g/l | - |
| Netherlands | 0.5 g/l | 0.2 g/l for novice drivers |
| New Zealand | 0.5 g/l | 0.0 g/l for drivers under 20 years and for repeating offenders |
| Nigeria | 0.5 g/l | 0.2 g/l for novice and 0.0 g/l professional drivers under approval |
| Norway | 0.2 g/l | - |
| Poland | 0.2 g/l | - |
| Portugal | 0.5g/l | 0.2 g/l for novice (first three years) and professional drivers (since 1 January 2014) |
| Serbia | 0.3 g/l | 0.0 g/l for novice and professional drivers and for PTW operators |
| Slovenia | 0.5 g/l | 0.0 g/l for novice (first three years) and professional drivers |
| South Africa | 0.5 g/l | 0.2 g/l for professional drivers |
| Spain | 0.5 g/l | 0.3 g/l novice and professional drivers |
| Sweden | 0.2 g/l | - |
| Switzerland | 0.5 g/l | 0.0 g/l for novice (first three years) and professional drivers |
| United Kingdom | 0.8 g/l in England, Wales and Northern Ireland 0.5 g/l in Scotland Northern Ireland will lower the limit to 0.5 g/l from 2018 |
- |
| United States | 0.8 g/l | 0.4 g/l for professional drivers 0.0 to 0.2 g/l for drivers < 21 |
Speed limits
In urban areas, in most countries, the default speed limit for passenger cars is 50 km/h; lower speed limits (typically 30 km/h) are often enforced in residential areas or around schools. Higher default speed limits (60 km/h) are found in Poland (during the night), Chile and Korea.
Speed limits on roads outside built up areas typically vary between 80 and 100 km/h. The lowest speed limits among IRTAD member countries and observers are in Jamaica (50 km/h) and Japan (50-60 km/h). The highest speed limits – up to 120 km/h – are found in Chile and Poland. Several countries differentiate speed limits according to the type of road, weather or pavement.
On motorways speed limits vary between 90 to 140 km/h. In Germany, there is no general speed limit. Instead there is a recommended speed limit of 130 km/h and local speed limits apply on a large part of the motorway network.
Table 1.6. General speed limits for passenger cars, in 2016
| Country | Urban areas | Rural roads | Motorways |
|---|---|---|---|
| Argentina | 40 – 60 km/h Buenos Aires City has a range of 20 to 70 km/h |
110 km/h | 120-130 km/h |
| Australia | 50 km/h 60 to 80 km/h (arterial roads) Increasing use of 40 km/h limits in urban areas with high pedestrian activities |
100 or 110 km/h | 110 km/h |
| Austria | 50 km/h | 100 km/h | 130 km/h |
| Belgium | 30-50 km/h | 70-90 km/h | 120 km/h |
| Cambodia | 30-40 km/h | 80 km/h | |
| Canada | 40-70 km/h | 80-90 km/h | 100-110 km/h |
| Chile | 60 km/h | 100 km/h | 120 km/h |
| Czech Republic | 50 km/h | 90 km/h | 130 km/h |
| Denmark | 50 km/h | 80 km/h | 130 km/h (110 km/h for certain sections) |
| Finland | 30, 40, 50, 60 km/h | 100 km/h (summer) 80 km/h (winter) |
120 km/h 100 km/h (near cities) |
| France | 50 km/h | 90 km/h (80 km/h in wet weather or for novice drivers) |
130 km/h (110 km/h in wet weather/or novice drivers) |
| Germany | 50 km/h | 100 km/h | No limit, but 130 km/h is recommended |
| Greece | 50 km/h | 90 km/h | 130 km/h |
| Hungary | 50 km/h | 90 km/h | 130 km/h (110 km/h on "motor roads") |
| Iceland | 50 km/h | 90 km/h paved roads 80 km/h gravel roads |
|
| Ireland | 50 km/h | 80 km/h or 100 km/h | 120 km/h |
| Israel | 50-70 km/h | 80, 90, 100 km/h | 110 km/h |
| Italy | 50 km/h | 90 km/h | 130 km/h; 110 km/h in case of rain or snow 100 km/h for novice drivers the motorway operator may increase the limit up to 150 km/h if stringent requirements are met. |
| Jamaica | 50 km/h | 50 km/h | 70 km/h or 110 km/h |
| Japan | 40, 50, 60 km/h | 50, 60 km/h | 100 km/h |
| Korea | 60 km/h | 60-80 km/h | 110 km/h (100 km/h in urban areas), |
| Lithuania | 50 km/h | 90 km/h (70 km/h on gravel roads and for novice drivers) |
120 or 130 km/h (110 km/h in winter, 90 km/h for novice drivers) |
| Luxembourg | 50 km/h | 90 km/h | 130 km/h (110 km/h in rain) |
| Malaysia | 50 km/h | 90 km/h | 110 km/h |
| Mexico | 10-80 km/h | 100 km/h (high speed roads) | 110 km/h |
| Morocco | 60 km/h | 100 km/h | 120 km/h |
| Country | Urban areas | Rural roads | Motorways |
|---|---|---|---|
| Netherlands | 30-50-70 km/h | 60-80 km/h | 100-130 km/h |
| New Zealand | 50 km/h | 100 km/h | 100 km/h |
| Nigeria | 50 km/h | 80 km/h | 100 km/h |
| Norway | 50 km/h (30 km/h residential streets) | 80 km/h | 90,100,110 km/h |
| Poland | 50 km/h (60 km/h night-time) | 90, 100, 120 km/h | 140 km/h |
| Portugal | 50 km/h | 90 km/h | 120 km/h |
| Serbia | 50 km/h | 80, 100 km/h | 120 km/h |
| Slovenia | 50 km/h | 90 km/h (110 km/h for Expressways) | 130 km/h |
| South Africa | 60 km/h | 100 km/h | 120 km/h |
| Spain | 50 km/h | 90 or 100 km/h | 120 km/h |
| Sweden | 30-40-50 km/h | 60-70-80-90-100 km/h | 110 km/h or 120 km/h |
| Switzerland | 50 km/h | 80 km/h | 120 km/h |
| United Kingdom | 30 mph (48 km/h) | 60 or 70 mph (96 or 113 km/h) | 70 mph (113 km/h) |
| United States | Set by each state | Set by each state | 55-80 mph (88-129 km/h) |
Table 1.6. General speed limits for passenger cars, in 2016 (cont.)
Seat belt use
The use of seat belts is regarded as one of the most effective measures to save lives and reduce crash injury severity for passenger vehicle occupants. All IRTAD countries have mandatory front seat belt regulations. The use of seat belts on rear seats is still not mandatory on the whole road network in some countries.
Set by each state
Wearing rates vary widely in member countries, and they are usually higher in front seats. For front seats, values typically range between 80% and 100%, but can also be as low as 52% (Argentina). For rear seats the range is between 15% (Chile) and 98% (Germany) (Figures 1.12 and 1.13).
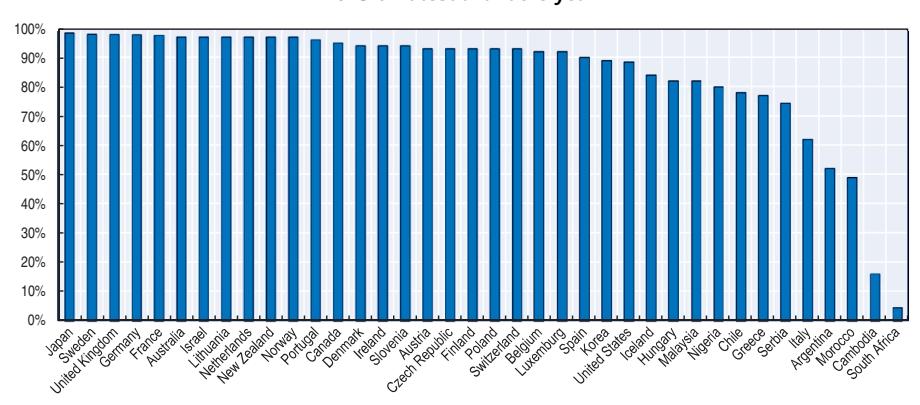
Figure 1.12. Seatbelt use by drivers or front seat passengers, 2015 or latest available year
Note: Data based on national surveys and not on a common international methodology.
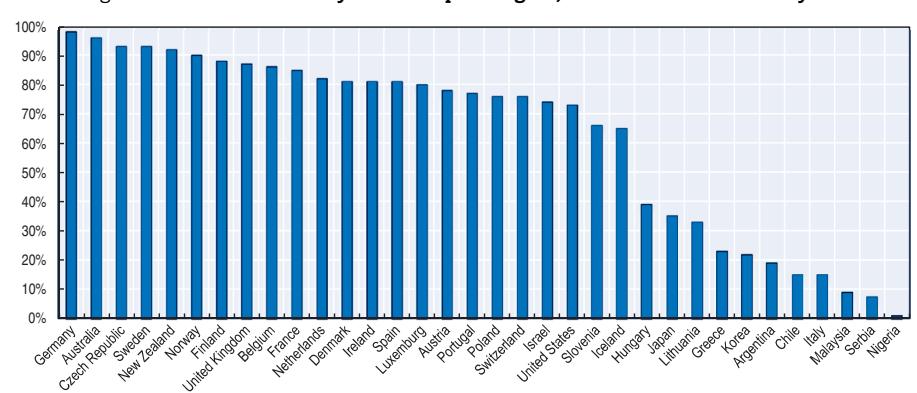
Figure 1.13. Seatbelt use by rear seat passengers, 2015 or latest available year
Note: Data based on national surveys and not on a common international methodology.
Table 1.7. Seatbelt wearing rates in front and rear seats, 2015 or the latest available year
| Country | Front seats | Rear seats | ||
|---|---|---|---|---|
| Date of application | Wearing rate | Date of application | Wearing rate | |
| Argentina | 1995 | 45% (average), 52% (driver) | 1995 | 19%, 45% for children |
| Australia | 1970s | 97% (2013 data) | 96% (2013 data) | |
| Austria | 1984 | 93% (driver), 94% (passengers) | 1990 | 78%, 97% for children |
| Belgium | 1975 | 92% (driver and passengers) | 1991 | 86% |
| Cambodia | 2007 | 16% (2012 data) | law under preparation | no data |
| Canada | 1976-1988 | 95% | 1976-1988 | 95% |
| Chile | 1985 | 78% (driver), 62% (passengers) | 2006 | 15% |
| Czech Republic | 1966 | 93% (2014 data) | 1975 | 93% (2014 data) |
| Denmark | 1970s | 94% (2012 data) | 1980s | 81% (2012 data) |
| Finland | 1975 | 93% (urban roads), 96% rural roads | 1987 | 88% (urban roads), |
| France | 1973 | 95.8% (urban roads) 98.6% (other roads) (2012 data) |
1990 | 71% (urban roads; 89% for children) 84% (motorways; 94% for children) (2012 data) |
| Germany | 1976 | 98% (2014 data) | 1984 | 98% , 99% for children (2014 data) |
| Greece | 1987 | 77% (driver), 74% (passengers) (2009 data) |
2003 | 23% (2009 data) |
| Hungary | 1976 | 82% (driver), 83% (passengers) | 1993 (outside built up areas), 2001 (inside built up areas) |
39% (79% for children) |
| Iceland | 84% (2013 data) | 65% (2013 data) | ||
| Ireland | 1979 | 94% | 1979 | 81%, 91% for children |
| Israel | 1975 | 97% (2014 data) | 1995 | 74% (2014 data) |
| Italy | 1988 | 62% ( | 1994 | 15%, 48% for children |
| Jamaica | 1999 | estimated 44% in 2008 | 1999 | estimated very low |
| Japan | 1985 | 98% (driver), 95% (passengers) | 2008 | 35% 63% for children |
| Korea | 1990 | 89% (driver) on motorways 75% (passengers) on motorways |
on motorways only, since 2008 | 22% on motorways |
| Lithuania | 97% (drivers) 95% (passengers) (2014 data, roads of national significance) |
33% | ||
| Luxembourg | 1975 | 90% | 1992 | 76% |
| Malaysia | 1978 | 82% (driver), 68% (passengers) | 2009 | 9% |
| Mexico | 2012 | 29% in 2000 | 2015 | 4% in 2000 |
Table 1.7. Seatbelt wearing rates in front and rear seats, 2015 or the latest available year (cont.)
| Country | Front seats | Rear seats | ||
|---|---|---|---|---|
| Morocco | 1977 – rural areas 2005 – urban areas |
49% drivers 46% passengers (2011 data) |
2005 – rural areas | No data |
| Netherlands | 1975 | 97% (2010 data) | 1992 | 82% (2010 data) |
| New Zealand | 1972 | 97% | 1979 | 92% for adults, 93% for children |
| Nigeria | 1997 | 80% | 1997 | < 1% |
| Norway | 1975 | 97% (driver) | 1985 | No monitoring, estimated 90% |
| Poland | 1983 | 93% drivers, 94% passengers (2014 data) |
1991 | 76 % – adults; 93 % for children |
| Portugal | 1978 | 96 % | 1994 | 77%; 89-100% for children restraints |
| Serbia | 1982 | 74% drivers, 70% passengers | 2009 | 7% for adults 44% for children below 3 15% for children above 3 |
| Slovenia | 1977 | 94% (2011 data) | 1998 | 66% for adults 87-94% for children (2011 data) |
| South Africa | 2005 for vehicles registered after 1 January 2006 |
4.5% drivers; 5% passengers | 2005 for vehicles registered after 1 January 2006 |
|
| Spain | 1974 outside urban areas, 1992 inside urban areas |
90% (2012 data) | 1992 | 81% (2012 data) |
| Sweden | 1975 | 98% | 1986 Child restraint systems since 1988 |
93% for adults, 97% for children |
| Switzerland | 1981 | 93% (driver); 92% (passengers) | 1994 | 76 % for adults, 93% for children (in 2012 ) |
| United Kingdom) | 1983 | 98% (driver), 96% (passengers), (2014 data) |
1989 (children); 1991 (adults) | 87.1% 90% Child rear seat passenger (aged < 14), 81% adult rear seat passenger (aged 14 and over) |
| United States | Primary law in 34 states, secondary law in 15 states, not mandatory for adults in one state |
88.5% | Varies by State | 73% (2014 data) 91% children (use of child restraint < 8 years old) |
Crash helmets for two-wheelers: motorcyclists, moped users and cyclists
In all IRTAD member and observer countries except the United States, the use of helmets on powered two-wheelers (motorcycles and mopeds) is compulsory and the wearing rate is usually high with many countries reporting nearly 100% compliance for motorcyclists. In the United States, there is no federal law on helmet use, and three states do not have any helmet law.
In most countries helmet use for cyclists is not compulsory; however the compulsory use of helmets by children is becoming more frequent (see Table 1.8).
Table 1.8. Helmet laws and wearing rates, 2015 or the latest available year
| Country | Powered two-wheelers | | Cyclists | | |
|-----------|---------------------------------------------------------------------------------|-------------------------------|---------------------------|--------------|--|
| | Helmet law | Wearing rate | Helmet law | Wearing rate | |
| Argentina | Yes | 68% drivers
46% passengers | No | | |
| Australia | Yes | | Yes | | |
| Austria | Yes | Nearly 100% | Yes for children up to 12 | | |
| Belgium | Yes | Unknown | No | | |
| Cambodia | Yes PTW over 49 cc, motorcycles
with trailers and for motorised
tricycles | | No | | |
| Canada | Yes | | In some jurisdictions | | |
| Chile | Yes | 99% | Yes in urban areas. | | |
Table 1.8. Helmet laws and wearing rates, 2015 or the latest available year (cont.)
| Country | Powered two-wheelers | Cyclists | ||
|---|---|---|---|---|
| Czech Republic | Yes | Nearly 100% | Yes (2006), for children up to 18 | |
| Denmark | Yes | Estimated 97% | No | |
| Finland | Yes | n.a | Yes ( 2003) | 41% to 60% |
| France | Yes, since 1973 | 90 -100% | No | |
| Germany | Yes | 99% | No | Estimated 17% |
| Greece | Yes | 75% riders 46% passengers (2009 data) |
No | |
| Hungary | Yes since 1965 for motorcyclists, 1997 for moped riders outside built up areas1998 for moped riders in urban areas. |
Nearly 100% | No | |
| Iceland | Yes | Yes, for children up to 14 | ||
| Ireland | Yes | 97% | No | 52% |
| Israel | Yes | Nearly 100% | Yes for children up to 18, for adults on non-urban roads |
90% on non-urban roads (2013 data) |
| Italy | Yes since 2000 for all | More than 90% | No | |
| Jamaica | Yes | Very low | No | |
| Japan | Yes | Estimated 99% | No | |
| Korea | Yes | 78% | No | |
| Lithuania | Yes | n.a. | Yes, for children below 18 | |
| Luxembourg | Yes, since 1976 | Estimated 100% | ||
| Malaysia | Yes, since 1973 | About 74% | No | |
| Mexico | Yes | 82% drivers, 57% passengers | No | |
| Morocco | Yes, since 1976 | 43 % drivers, 8 % passengers (2011 data) |
No | |
| Netherlands | Yes, motorcycles since 1972; mopeds since 1975 Not compulsory on mofas (max. speed 25 km/h) |
Moped riders: 96% Motorcycle riders: nearly 100% |
No | |
| New Zealand | Yes | Nearly 100% | Yes, since 1994 | 92% (2012 data) |
| Nigeria | Yes | 60% | Yes | |
| Norway | Yes | Nearly 100% | No | 56% for all cyclists above 12 years |
| Poland | Yes since 1997 | Nearly 100% | No | |
| Portugal | Yes | n.a | No | |
| Serbia | Yes | 89% for motorcyclists 74% for moped riders |
No | |
| Slovenia | Yes | n.a | Yes for children up to 14 | |
| South Africa | Yes | Yes | ||
| Spain | Yes | Nearly 100% | Yes, except in built up areas Mandatory for children below 16 |
|
| Sweden | Yes | 96-99% | Yes for children below 15 | 60-70% children 30% adults |
| Switzerland | Yes, motorcycles since 1981; mopeds since 1990 |
Nearly 100% | No for "regular" bicycles Yes for e-bikes > 25km/h |
|
| United Kingdom | Yes, motorcycles since 1973; mopeds since 1977 |
No | ||
| United States | No national law 19 states require helmet use by all PTW operators and passengers. 28 states requires helmet use by some segment of population 3 states have no helmet law |
64% in 2014 (use of DOT-compliant helmets) |
21 states and the District of Columbia have enacted age-specific bicycle helmet laws |
Note
- For Argentina, data is currently under review by the National Road Safety Observatory.
References
- Kahane, C.J. (2015), Lives saved by vehicle safety technologies and associated Federal Motor Vehicle Safety Standards, 1960 to 2012, Report No. DOT HS 812 069, Washington, DC: National Highway Traffic Safety Administration.
- OECD/ITF (2011), Reporting on Serious Road Traffic Casualties: Combining and using different data sources to improve understanding of non-fatal road traffic crashes, IRTAD report, International Transport Forum, www.itf-oecd.org/sites/default/files/docs/road-casualties-web.pdf (accessed 12 May 2016).
- OECD/ITF (2015), Why Does Road Safety Improve When Economic Times are Hard, IRTAD report, International Transport Forum, www.itf-oecd.org/sites/default/files/docs/15irtadeconomictimes.pdf (accessed 12 May 2016).
- United Nations (2016), "Improving Global Road Safety", Resolution of the UN General Assembly, A/70/ L.44, 4 April 2016.
- WHO (2014), "WHO Methods and Data Sources for Country-Level Causes of Death 2000-2012". Global Health Estimates Technical Paper WHO/HIS/HSI/GHE/2014.7, World Health Organization, Geneva, www.who.int/entity/healthinfo/global\_burden\_disease/GlobalCOD\_method\_2000\_2012.pdf.
Chapter 2
Argentina
This chapter presents 2014 road safety data for Argentina along with provisional data from 2015. It looks at trends in traffic and road safety from the years 1990 to 2014 and road user behaviour patterns. This includes data on speed, drink driving, drugs and driving, distracted driving, and seat belt and helmet use. The chapter reviews Argentina's road safety strategy, national targets, recently implemented measures and ongoing research.*
* All data stem from the National Road Safety Agency (ANSV) and IRTAD unless otherwise noted. For more information please contact Veronica Heler: vheler@seguridadvial.gov.ar.
Argentina's rapid motorisation over the last five years has resulted in a relative stagnation in the fatality figures at around the 5 000 to 5 200 mark. In 2014, there were 5 279 reported road fatalities, representing a 1.3% increase compared to 2013. Whereas fatalities have increased by 3.6% since 2010, the number of registered vehicles has increased by 32.6%. The overall fatality risk has been reduced to 2.2 deaths per 10 000 registered vehicles, a 22% decrease when compared to 2010. Vulnerable users such as pedestrians, cyclists and motorcyclists are still the most at risk and their safe interaction has become a priority.
Road safety data collection
Definitions applied in Argentina
- Road fatality: Person killed in a traffic crash within 30 days after the crash.
- Serious injury: Non-fatal casualty who stayed more than 24 hours in hospital.
- Slight injury: Non-fatal casualty admitted in hospital for less than 24 hours.
Data collection
The National Road Safety Agency (ANSV) of Argentina joined the International Road Traffic and Accident Database (IRTAD) group in 2010. It benefited in 2010-12 from a twinning programme with the General Traffic Directorate of Spain to review its crash data collection and analysis system. This programme has been instrumental in guiding ANSV in the improvement of the data collection process, conforming to international standards and indicators. In 2013, data from Argentina were validated for inclusion in the IRTAD database. A second round of audit and validation is envisaged.
The 24 Argentinean jurisdictions inform aggregated monthly road crash data using a tool known as the "A Form", which is the main source of official statistics.
In order to get more detailed road crash statistics, the Argentinean road safety statistical form (FEU is its Spanish acronym) was implemented in 2010. This form is currently being used by 13 of the 24 Argentinean provinces to report detailed data on road crashes. However, figures obtained from this source of information show, when compared with the aggregated source, that there is a large amount of underreporting. Therefore, more efforts are needed to improve the coverage of the detailed database.
The A Form is for the most part sent electronically to ANSV, but a few provinces still send it by postal mail. FEU forms are sent by postal mail to ANSV where they are digitalised, and a few provinces have implemented a digital system to locally process part of the information contained in them. ANSV is currently working on a computerised data collection system that is expected to improve the field work of the police, resulting in faster and more efficient procedures. Among other important features, such system will integrate several sources of information to enable cross-checking, allowing early detection of missing observations. Underreporting is quite high for crashes without injuries and with only slight injuries.
ANSV is currently working closely with the 24 jurisdictions in order to review their crash data collection process. In 2016 the Agency will visit all the provincial agencies in charge of road safety statistics, to sign new information exchange agreements, provide training and create a network of local road safety observatories.
Since 2010, ANSV is working with the Ministry of Health to link hospital records and the FEU Form data. However, very modest progress has been attained so far because of the diverse complexities of the Argentinean health system.
Most recent safety data
Road crashes in 2015 – provisional data
Based on provisional data, about 4 600 road fatalities were registered in 2015. However, this figure does not include fatalities from Buenos Aires province or the data for Santa Fe figures for November and December. These two provinces are the most important in terms of the number of road fatalities registered. It is estimated that Buenos Aires represents between 20 and 30% of total fatalities.
In December 2015, a bus transporting police officers fell over a precipice in Salta province, killing more than 40 people. This event was a national tragedy.
Road crashes in 2014
In 2014, there were 5 279 reported road fatalities, representing a 1.3% increase compared to 2013. The reported number of injury crashes decreased by 5.7%.
Traffic
Motorisation is growing quickly in Argentina. Based on vehicle registration data, the number of motorised vehicles grew by more than 6 million units from 2009 to 2014, a 43% increase; this includes an increase of 3.5 million motorcycles, more than doubling the fleet over this 5-year period. It should be noted, however, that these data includes figures for scrapped vehicles.
This extremely rapid motorisation raises important challenges in terms of traffic and infrastructure management, congestion and safety.
Road safety
Crashes and casualties
Since 2008, the number of road fatalities has fluctuated between 5 000 and 5 200. This relative stagnation is to be analysed in relation to the explosion in the number of vehicles.
Rates
In 2014, the mortality rate was 12.4 deaths per 100 000 inhabitants. The fatality risk decreased to 2.2 deaths per 10 000 registered vehicles, a 22% decrease when compared to 2010. This rapid decrease is related to the rapid increase in the vehicle fleet.
Road safety by user group
Data collected by ANSV showed a steady decrease in car occupant fatalities since 2010. However, the situation for all other road users deteriorated.
The number of pedestrians killed increased by more than 72% since 2010. In 2014, this number increased by 8% when compared with 2013. Increase in the motorisation rate,
Table 2.1. Road safety and traffic data
| 2014 % change from | ||||||||
|---|---|---|---|---|---|---|---|---|
| 2009 2010 2012 2013 |
2014 | 2013 | 2010 | 2009 | ||||
| Reported safety data | ||||||||
| Fatalities | 5 219 | 5 094 | 5 074 | 5 209 | 5 279 | 1.3 | 3.6 | 1.1 |
| Injury crashes | 90 851 | 89 403 | 92 240 | 89 630 | 84 513 | -5.7 | -5.5 | -7.0 |
| Deaths per 100 000 inhabitants | 13 | 12.6 | 12.3 | 12.3 | 12.4 | 0.2 | -1.6 | -4.8 |
| Deaths per 10 000 registered vehicles | 3.2 | 2.9 | 2.5 | 2.3 | 2.2 | -3.7 | -21.9 | -29.5 |
| Traffic data | ||||||||
| Registered vehicles (thousands) | 16 416 | 17 751 | 20 684 | 22 371 | 23 544 | 5.2 | 32.6 | 43.4 |
| Registered vehicles per 1 000 inhabitants | 409 | 438 | 501 | 530 | 552 | 4.1 | 25.9 | 34.9 |
Note: Vehicle fleet data includes figures for scrapped vehicles.
Source: National Road Safety Observatory, 2015. Data subject to review by current administration.
1 2 http://dx.doi.org/10.1787/888933385338
Figure 2.1. Road safety, traffic and GDP trends index 1990 = 100
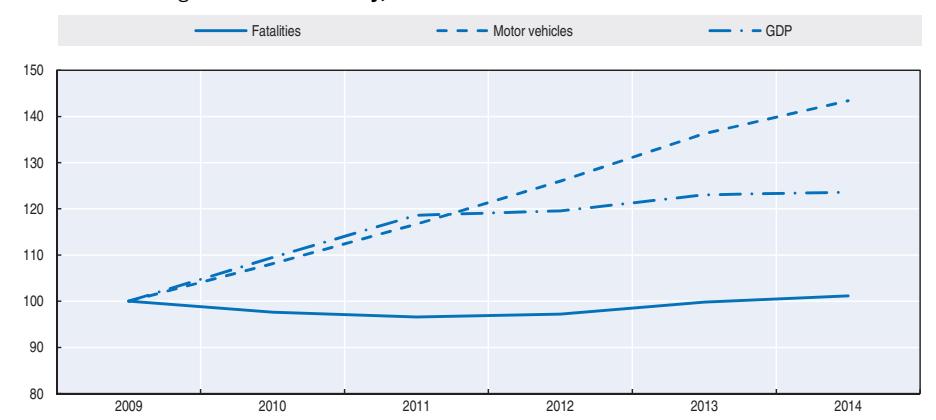
Note: Vehicle fleet data includes figures for scrapped vehicles.
Source: World Bank for Gross Domestic Product (GDP; constant prices).
together with a lack of specific policies targeting this vulnerable group and the fact that about 93% of the road fatalities take place in cities, might be some important influential factors. Urgent action is needed in order to reverse the trend.
The number of motorcyclists killed has increased by 46% since 2010. This increase is to be analysed in conjunction with the rapid expansion of the motorcycle fleet which has more than doubled in the last five years. The safety of powered two-wheelers is a major concern in Argentina, in particular in urban areas. Since 2012 the safe interaction between motorcycles, pedestrians and cyclists in urban areas has become a priority.
Road safety by age group
In 2014, 23% of traffic fatalities involved road users between 15 and 24 years old, who represent 17% of the total population. Young people have a higher risk than the general population, followed closely by road users aged 25 to 64. Since 2010, the number of young people killed in this age group has increased by 10%.
Table 2.2. Road fatalities by road user group
| 2014 % change from | ||||||
|---|---|---|---|---|---|---|
| 2010 | 2012 | 2013 | 2014 | 2013 | 2010 | |
| Cyclists | 77 | 96 | 102 | 83 | -18.6 | 7.8 |
| Motorcyclists | 1 161 | 1 344 | 1 547 | 1 691 | 9.3 | 45.7 |
| Passenger car occupants | 2 923 | 2 778 | 2 619 | 2 363 | -9.8 | -19.2 |
| Pedestrians | 329 | 382 | 524 | 568 | 8.4 | 72.6 |
| Others | 604 | 474 | 417 | 574 | 37.6 | -5.0 |
| Total | 5 094 | 5 074 | 5 209 | 5 279 | 1.3 | 3.6 |
Source: National Road Safety Observatory, 2015. Data subject to review by current administration.
Figure 2.2. Road fatalities by road user group in percentage of total 2014
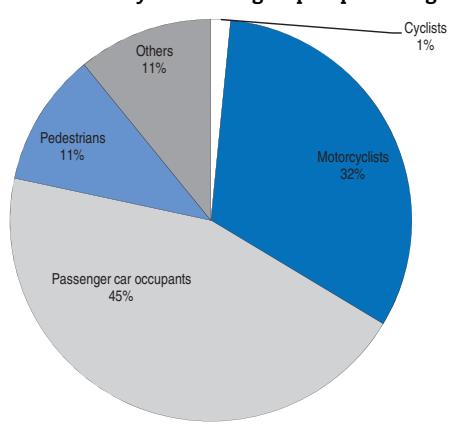
Source: National Road Safety Observatory, 2015. Data subject to review by current administration.
Since 2010, much improvement has been observed for the senior population with a 28% overall decrease in the number of fatalities, despite a 6% increase in 2014.
Table 2.3. Road fatalities by age group
| | | | | | 2014 % change from | | | |-------|-------|-------|-------|-------|--------------------|-------|--| | Age | 2010 | 2012 | 2013 | 2014 | 2013 | 2010 | | | 0-5 | 166 | 129 | 128 | 161 | 25.8 | -3.0 | | | 6-9 | 108 | 81 | 99 | 110 | 11.1 | 1.9 | | | 10-14 | 139 | 107 | 105 | 109 | 3.8 | -21.6 | | | 15-17 | 358 | 369 | 396 | 390 | -1.5 | 8.9 | | | 18-20 | 354 | 367 | 385 | 379 | -1.6 | 7.1 | | | 21-24 | 463 | 481 | 523 | 516 | -1.3 | 11.4 | | | 25-64 | 2 987 | 3 111 | 3 224 | 2 980 | -7.6 | -0.2 | | | > 65 | 519 | 429 | 349 | 372 | 6.6 | -28.3 | | | Total | 5 094 | 5 074 | 5 209 | 5 279 | 1.3 | 3.6 | |
Note: ANSV collects aggregate road fatalities information for the following age ranges: 0-5; 6-14; 15-24; 25-34; 35-44; 45-54; 55-64; 65-74; +75. The information provided on Table 2.3 was estimated as a weighted average, considering age distribution of the total population as published by the National Institute of Statistics and Censuses of Argentina (INDEC). Source: National Road Safety Observatory, 2015. Data subject to review by current administration.
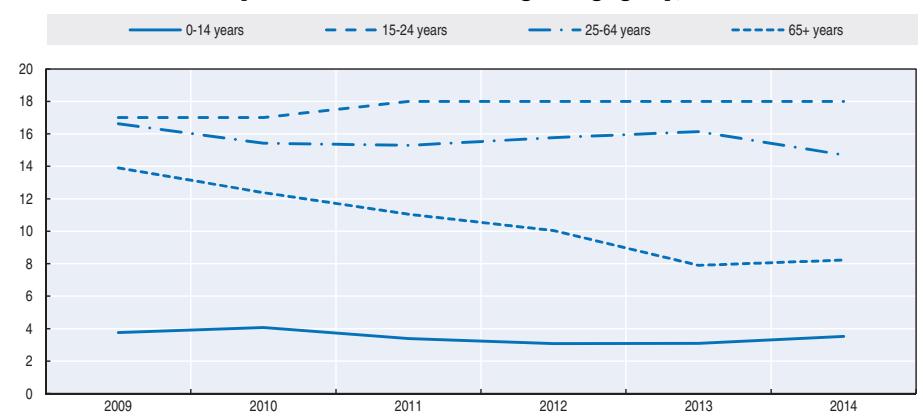
Figure 2.3. Road fatality rates by age group Deaths per 100 000 inhabitants in a given age group, 2009-14
Source: National Road Safety Observatory, 2015. Data subject to review by current administration.
Road safety by road type
In 2014, 93% of all reported road crashes occurred in urban and suburban areas, accounting for 89% of injured persons and 58% of fatalities. Non-urban areas accounted for 7% of road crashes but 42% of fatalities.
The safety of pedestrians, cyclists and motorcyclists in urban areas remains a major challenge. The number of fatalities has increased by 13% in urban areas since 2010.
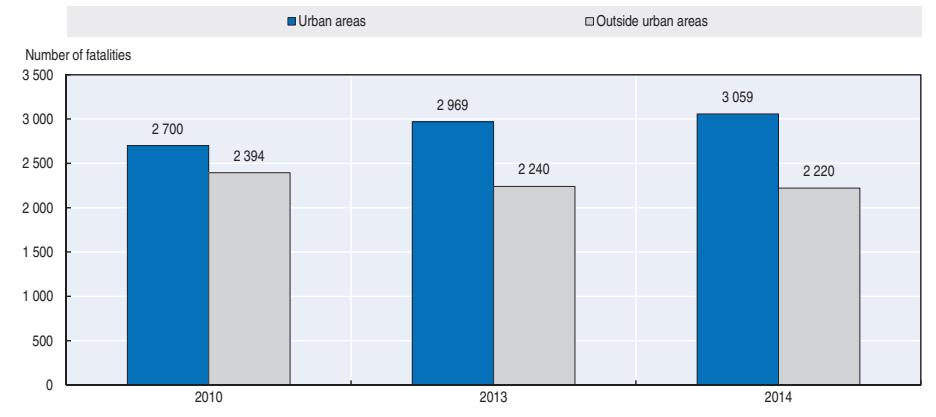
Figure 2.4. Road fatalities by location
Source: National Road Safety Observatory, 2015. Data subject to review by current administration.
Economic costs of traffic crashes
In 2010, it was estimated that road crashes represented 1.2% of the Argentina's GDP (PAHO and ANSV, 2012).
In 2016, the development of a methodology specifically tailored for Argentina to enable estimation of road crash costs will be publicly tendered by ANSV. Such methodology shall be applied to one or two pilot tests as part of the same tendering process.
Recent trends in road user behaviour
Speed
The table below summarises the main speed limits in Argentina.
Table 2.4. Passenger car speed limits by road type, 2016
| Location | Number of lanes | Median barrier | Controlled-access | Speed limit (km/h) |
|---|---|---|---|---|
| Urban* | 2 | No | No | 40 |
| Urban* | 2+2 or more | No | No | 60 |
| Rural | 2 | No | No | 110 |
| Rural | 2+2 or more | Yes | No | 110-120 |
| Rural | 2+2 or more | Yes | Yes | 120-130 |
* Buenos Aires City has a range of 20 to 70 km/h, in 5 categories.
Drink driving
A maximum legal blood alcohol content (BAC) was introduced in February 1995 of 0.5 g/l for most road user categories and zero for professional drivers of buses, taxis and trucks.
It is estimated that 24% of fatal crashes are due to drink driving (SEDRONAR, 2012).
Drugs and driving
The national traffic law prohibits driving while "having consumed illegal or legal drugs that reduce the ability to drive".
Research undertaken by SEDRONAR estimated that out of a sample of 1 777 surveyed cases in 2012 throughout the country, 22.5% of road casualties treated in emergency rooms had consumed some type of psychoactive substance. This figure is similar to the ones obtained on previous studies (SEDRONAR 2003, 2005, 2007 and 2009). This is a very high proportion and further research is planned on this issue.
Distraction
The national traffic law prohibits the use of mobile phones, electronic hand-held devices, DVD players and similar devices while driving.
A national survey on road user behaviour, conducted in 2014, analysed the distraction factors among car drivers. The results are illustrated in the figure below. Results from this survey cannot be compared with information from the 2013 survey, as the methodology to collect the data changed.
Sleepiness and fatigue
National legislation requires professional drivers to rest eight hours after eight hours of driving. Controls are heavily focused on professional drivers of long-distance public transport.
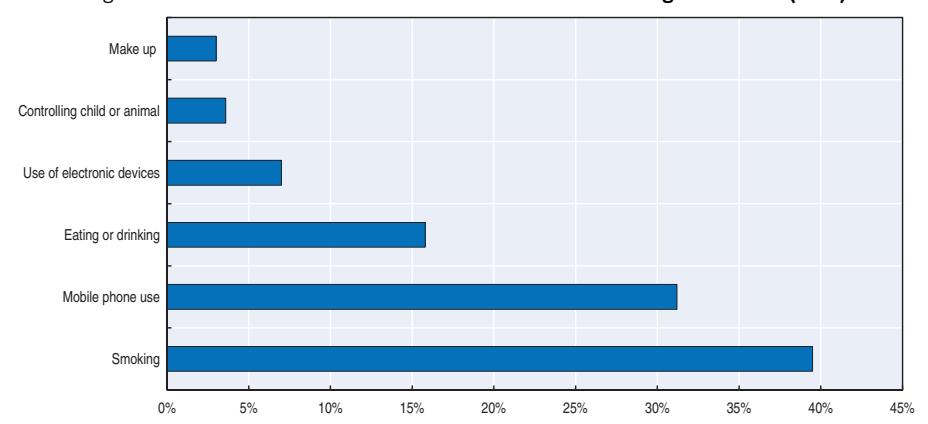
Figure 2.5. Prevalence of distraction factors observed among car drivers (2014)
Seat belts and helmets
Seat belt wearing has been compulsory in front and rear seats since February 1995. Dedicated child restraint systems are mandatory for children under four years old. The table below summarises the evolution in the seat belt wearing rate. While there is some improvement, the wearing rate is very low in comparison to most OECD countries.
| % | | | | | | | | | |------------------------|------|------|------|------|--|--|--|--| | | 2011 | 2012 | 2013 | 2014 | | | | | | Front seat | | | | | | | | | | General | 33 | 38 | 38 | 45 | | | | | | Drivers | 39 | 44 | 42 | 52 | | | | | | Passengers | 29 | 34 | 37 | 45 | | | | | | Rear seats | | | | | | | | | | Adults | 11 | 18 | 26 | 19 | | | | | | Child restraint system | 26 | 29 | 34 | 45 | | | | |
Table 2.5. Seat-belt wearing rate by car occupancy
All riders of two-wheeled motor vehicles are required to wear helmets. In 2014, it was estimated that 68% of motorcycle riders and 46% of passengers wore a helmet.
National road safety strategies and targets
Organisation of road safety
The National Road Safety Agency (ANSV), created in 2008 under the Ministry of Interior and Transport, is the leading road safety agency in Argentina. The agency has three councils and committees: a Federal Council, represented by one member of each province; a Scientific Committee, composed of expert members, engineers, doctors, etc.; and a Consultative Committee, represented mainly by relatives of road safety victims.
All road safety policies are decided within the National Road Safety Agency. Since its inception, the focus has been on the creation of a national drivers' licence, a national education plan, a national control plan and creation of the National Road Safety Observatory.
Road safety strategy for 2011-20
The Argentina Road Safety Plan is based on the pillars recommended by the United Nations Road Safety Plan for the Decade of Action for Road Safety.
Road safety targets
The national government set an objective of a reduction in the number of road traffic fatalities by 50% between 2009 and 2014. Specific targets for 2020 are being developed following the pillars of the Decade-of-Action Plan.
Monitoring
The target to halve the number of fatalities between 2009 and 2014 was probably unrealistic in such a short time frame and was not achieved.
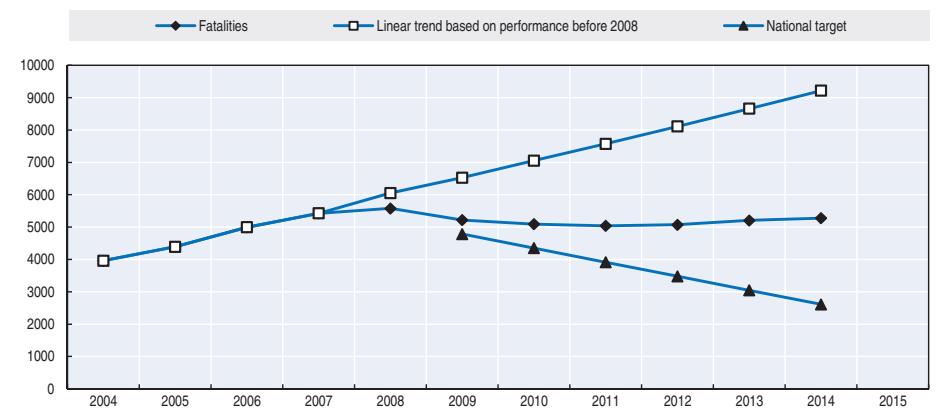
Figure 2.6. Trends in road fatalities towards national target
Recent safety measures (2013-15)
Road safety management
National licensing system
● In 2014, 23 of the 24 Argentinean regional authorities adopted a new National Driving Licence system. The national licensing system centralises driving documentation. This mechanism allows criminal background checks, traffic violation checks, judicial disqualifications and the scoring of the person seeking the licence.
Road users
Motorcyclist safety
● In 2012, the National Road Safety Agency, in co-operation with the Ministry of Health, motorcyclists' associations and other stakeholders, launched a National Motorcycle Plan. ANSV has launched several safety campaigns specially targeting this group of users since then.
Speed management
● In 2013, section control speed enforcement was tested.
Impaired driving
● The ANSV is discussing with the competent bodies the possibility of incrementing penal punishments for those crimes committed while driving under the influence of alcohol.
Education and training
- In 2014, the National Road Safety Agency initiated the "Safe Road to School" programme. It started with surveys in schools on mobility patterns of children. This was followed by the implementation of a safe road network to access the schools. In 2015, a total of 13 schools comprising about 6 300 students from Puerto Rico, Victorio and City Bell participated in such a programme.
- Since 2011, more than 550 conferences reaching more than 100 000 people took place in high schools all over the country, to increase awareness among students about road safety measures. These conferences were aimed at promoting care and respect for others and raising awareness about behaviour in public spaces.
Infrastructure
- The ANSV has conducted risk analysis on national roads to enable development of a road risk map. The results of this work are being considered by the national road authority for use in future interventions.
- Since 2011 a total of 35 111 km were surveyed by the ANSV to determine their risk level in terms of road safety and to ensure intervention is assigned to the competent authorities.
- The ANSV is working together with the National Road Direction (DNV) to carry out road safety audits and to survey road sections, which in turn will enable the implementation of road safety improvements. Such joint work became fully viable in 2016, when both governmental institutions were put under a common National Ministry.
Vehicles
- Since 2011, several agreements were reached with car manufacturers and importers to implement European standards for new vehicles sold in Argentina.
- The National Road Safety Agency is proposing an integral modification of the Road Traffic Bill, which includes the recognition and regulation of electric vehicles and quads.
Safety systems New vehicle models All vehicle models Anti-lock braking system 1 January 2014 Airbags 1 January 2014 Frontal impact test according to the UNECE regulation 30 January 2016 30 January 2016 Rear impact test according to the UNECE regulation 24 months after its compulsory application in Europe 24 months after its compulsory application in Europe Side impact test according to the UNECE regulation 1 January 2018 1 January 2022 Child Restraint System (ISOFIX or LATCH) 1 January 2016 1 January 2018 Electronic Stability Control 1 January 2018 Rear seat belt retractor 1 January 2016 Third stop light 1 January 2014
Table 2.6. Implementation dates of vehicle safety systems
Recent and ongoing research
- The fourth National Survey on Road Safety Behaviour was conducted in December 2014 and focused on professional drivers. http://observatoriovial.seguridadvial.gov.ar/documentos/ conductas-2014.pdf.
- The first sociocultural survey on road safety was carried out between December 2014 and February 2015, through focus groups and interviews. The main conclusions of the Observational study in Argentina on road habits and culture (2014) are shown below, together with a graphical comparison of the main results obtained regarding safety belt use:
- ❖ 62.7% of the respondents believe that Argentineans never or almost never respect traffic rules, while only 2% say they never or almost never violate such rules.
- ❖ Although 23.8% of respondents believe that there is a public institution dedicated to road safety, only 10% know about the existence of ANSV.
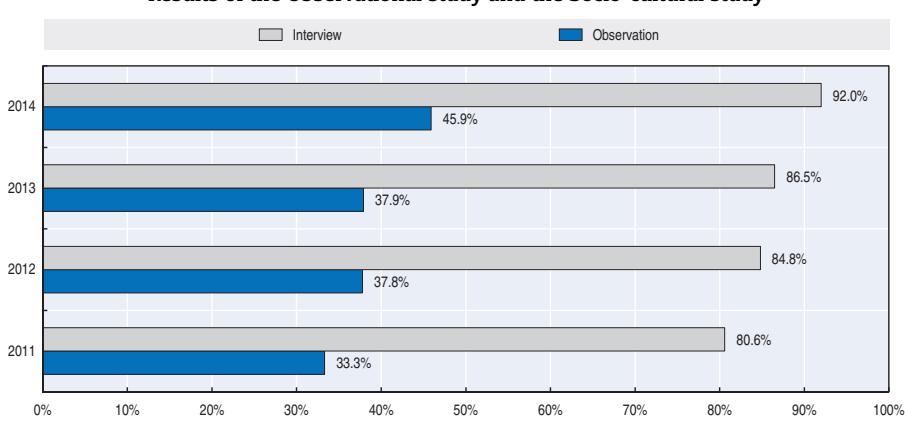
Figure 2.7. Safety belt use by car occupants Results of the Observational study and the Socio-cultural study
References
ANSV and PAHO (2012), Costos de los siniestros viales en Argentina 2011 (Road accident costs in Argentina in 2011), Instituto de Seguridad y Educacion Vial (ISEV), Buenos Aires.
Estudio observacional en Argentina sobre hábitos y cultura vial 2014, http://observatoriovial. seguridadvial.gov.ar/documentos/conductas-2014.pdf.
Websites
- National Road Safety Agency: www.seguridadvial.gov.ar/.
- National Road Safety Observatory: http://observatoriovial.seguridadvial.gov.ar.
Chapter 3
Australia
This chapter presents 2014 road safety data for Australia along with provisional data from 2015. It looks at trends in traffic and road safety from the years 1990 to 2014 and road user behaviour patterns. This includes data on speed, drink driving, drugs and driving, distracted driving, fatigue and seat belt use. Australia has a National Road Safety Strategy 2011-2020 along with an interim Action Plan for 2015-2017. This chapter reviews these strategies, their development and implementation and the progress achieved to date. It also looks at recently adopted safety measures and improvements in infrastructure.*
* All data stem from the Australia Department of Infrastructure and Regional Development and IRTAD unless otherwise noted. For more information please contact: Tim.Risbey@infrastructure.gov.au.
Australia is the world's sixth largest country by area with a population of 24 million inhabitants. There is an average of 752 vehicles per 1 000 inhabitants and nearly 243 billion kilometres are driven each year.
In 2014 road deaths decreased by 2.5% when compared to 2013 data. However, provisional data from 2015 indicate a reverse in this trend, with an increase in deaths by 4.7% over 2014 figures. The 2014 figures translate into a rate of 4.9 deaths per 100 000 inhabitants, or 4.8 deaths per billion vehicle-kilometres. Overall, fatality numbers to the end of 2014 decreased by 19%, notably among young drivers and motorcyclists with a reduction of 32.5%.
Road safety data collection
Definitions applied in Australia
- Road death: A person who dies within 30 days of a crash as a result of injuries received in that crash.
- Road crash: Any apparently unpremeditated event attributable to the movement of a road vehicle on a public road reported to the police or other relevant authority and resulting in death, injury or property damage.
- Seriously/slightly injured: Australia does not have systems in place to reliably measure national indicators of injuries from road crashes, in part because of jurisdictional differences in injury definitions and reporting arrangements.
Data collection
In Australia, crash data are collected and validated by the police and transport agencies in each of the eight states and territories.
Common protocols for the collection of fatality data have enabled the establishment of a reliable national road fatality database, which is managed by the federal Department of Infrastructure and Regional Development (hereafter referred to as the Department). This database is the source of the fatality data included in this report.
With respect to the collection of serious injury road crash data, there are currently substantial differences in the approaches adopted by the Australian states and territories. The federal Department is working with state and territory agencies on options to develop a national serious injury database; however, significant issues must be resolved before this can occur.
The 2014 Review of the National Road Safety Strategy 2011-2020 found that progress in reducing serious injury numbers was difficult to determine because of the lack of reliable, nationally consistent, non-fatal crash data. Addressing this issue is a priority action. Current efforts to develop national measures of serious injury are focussed on a long-term solution to link states and territories hospital case data with road crash data, and the adoption of common standards that will enable national aggregation and reporting.
Most recent safety data
Road crashes in 2015 – provisional data
Annual deaths from road crashes increased in 2015. The total number of deaths in road crashes was 1207, an increase of 4.5% on 2014
Road crashes in 2014
The total number of road deaths in Australia decreased by 2.5% in 2014 when compared with 2013 figures (1 155 deaths compared to 1 185 deaths).
Trends in traffic and road safety (1990-2014)
Traffic
Between 1990 and 2015, the number of motorised vehicles registered for road use increased by 78% and overall vehicle-kilometres travelled increased by 52%.
While light passenger vehicles still account for more than 71% of traffic volume in Australia, there has been a gradual increase in the presence of motorcycles and commercial vehicles. Between 1990 and 2015, the number of vehicle-kilometres travelled by light commercial vehicles grew by 102%, articulated trucks grew by 95%, motorcycles grew by 75% and cars grew by 41%.
In 2015, the number of motorised vehicles increased by 2.1% and vehicle-kilometres travelled increased by 1.7% when compared to 2014.
Road safety
Crashes and casualties
Since 1990, there has been an underlying and relatively constant downward trend in road deaths, with an overall reduction in total fatalities of 50%. Key measures contributing to this reduction, particularly over the last decade, have been the implementation of intensive speed compliance measures, progressive introduction of graduated licensing restrictions, targeted safety investment in road infrastructure and continuous vehicle safety improvements.
Under Australia's National Road Safety Strategy 2011-2020, key statistical indicators are benchmarked against the three-year period 2008 to 2010. Overall, fatality numbers to the end of 2014 decreased by 19%. However, there were notable differences in trends for some road user groups and crash types:
- Deaths of young drivers and motorcyclists (aged 17-25 years) decreased by 32.5%.
- Deaths of all motorcyclists increased by 18.3%.
- Deaths of older drivers and motorcyclists (aged 65+ years) increased by 19.6%.
- Deaths of bicycle riders increased by 36.1% (though relatively small numbers). Over this period there were positive changes in vehicle sales.
- The proportion of new light vehicles sold with a 5-star Australasian New Car Assessment Program (ANCAP) rating increased to 86%.
Rates
Since 2010, the rate of annual deaths per 100 000 inhabitants has decreased by 20% reaching 4.92 in 2014, the lowest figure on record.
ROAD SAFETY ANNUAL REPORT 2016 © OECD/ITF 2016 53
Fatality risk expressed in deaths per vehicle kilometres also reached its lowest level in 2014 at 4.8 fatalities per billion vehicle-kilometres. There are however important variations between the different states of Australia, with the highest rate, of nearly 4 times the average level, in the Northern Territory.
Analysis of seriously injured data
In contrast to the continuing decline in fatal road crashes in Australia, available hospital data suggest that serious non-fatal crashes have not been reduced over the last decade. Between 2000 and 2013, the number of people hospitalised due to road crashes increased from 26 963 to 35 059, however, a break in series on 1 July 2012 means it is not possible to be certain about the size of recent increases. Much of this increase is attributable to vulnerable road users (especially motorcyclists and cyclists).
Table 3.1. Road safety and traffic data
| 2014 % change from | |||||||||
|---|---|---|---|---|---|---|---|---|---|
| 1990 | 2000 | 2010 | 2013 | 2014 | 2013 | 2010 | 2000 | 1990 | |
| Reported safety data | |||||||||
| Fatalities | 2 331 | 1 817 | 1 352 | 1 185 | 1 155 | -2.5 | -14.6 | -36.4 | -50.5 |
| Injured persons hospitalised | 24 961 | 26 963 | 32 775 | 35 059 | na | na | na | na | |
| Deaths per 100 000 inhabitants | 13.7 | 9.5 | 6.1 | 5.1 | 4.9 | -4.0 | -19.8 | -48.4 | -64.0 |
| Deaths per 10 000 registered vehicles | 2.3 | 1.5 | 0.8 | 0.7 | 0.7 | -5.0 | -22.2 | -56.3 | -71.7 |
| Deaths per billion vehicle kilometres | 14.4 | 9.1 | 5.9 | 4.9 | 4.8 | -3.7 | -19.5 | -48.0 | -66.9 |
| Traffic data | |||||||||
| Registered vehicles (thousands) | 10 081 | 12 373 | 16 061 | 17 181 | 17 633 | 2.6 | 9.8 | 42.5 | 74.9 |
| Vehicle kilometres1 (millions) | 162 238 | 198 669 | 228 774 | 239 672 | 242 634 | 1.2 | 6.1 | 22.1 | 49.6 |
| Registered vehicles per 1 000 inhabitants | 591 | 650 | 729 | 743 | 752 | 1.1 | 3.1 | 15.6 | 27.2 |
1 2 http://dx.doi.org/10.1787/888933385343
Figure 3.1. Road safety, traffic and GDP trends index 1990 = 100
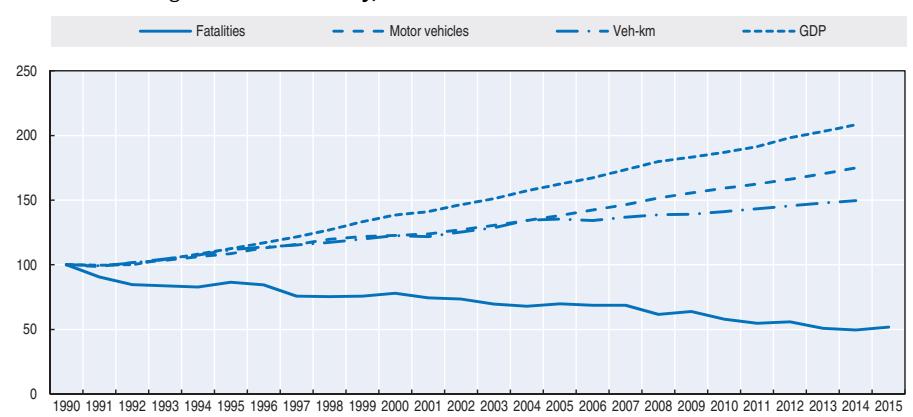
Source: World Bank for Growth Domestic Product (GDP; constant prices).
Road safety by user group
Since 1990, overall fatalities have dropped by over 50% with the most noticeable decreases observed among passenger car occupants (-64%) and pedestrians (-64%). During the same time span, cyclists' fatalities decreased by 45% and motorcyclists fatalities by 27%.
Since 2000, passenger deaths decreased at the fastest rate, with consistent reductions seen also for driver deaths and pedestrian deaths. Motorcyclist deaths have also fallen but at a slower rate. An increasing trend was observed for cyclist deaths, with the 2014 result representing a 41.9% increase on the 2000 results. However, cyclist deaths decreased from a high of 50 in 2013 to 44 in 2014 and 31 in 2015.
In 2014, fatalities were reduced from 2013 results among all user groups, with the biggest decrease observed for cyclists. However the number of cyclists killed rose sharply in 2013 before declining. While Australia does not have national exposure data for cyclists, there is some evidence that cycling activity may be increasing in urban environments.
Changes in motorcycle fatalities have been influenced by changes in exposure (number of active riders and age profile as well as total distance travelled). There is concern that automated speed enforcement may have had less influence on motorcycle speeds than on speeds of other vehicles, partly because motorcycles have no front number plates.
| 2014 % change from | |||||||||
|---|---|---|---|---|---|---|---|---|---|
| 1990 | 2000 | 2010 | 2013 | 2014 | 2013 | 2010 | 2000 | 1990 | |
| Cyclists | 80 | 31 | 38 | 50 | 44 | -12.0 | 15.8 | 41.9 | -45.0 |
| Motorcyclists | 262 | 191 | 224 | 214 | 191 | -10.7 | -14.7 | 0 | -27.1 |
| Passenger car occupants | 1 569 | 1 302 | 723 | 589 | 569 | -3.4 | -21.3 | -56.3 | -63.7 |
| Pedestrians | 420 | 287 | 172 | 162 | 150 | -7.4 | -12.8 | -47.7 | -64.3 |
| Others | na | na | 195 | 170 | 201 | 18.2 | 3.1 | na | na |
| Total | 2 331 | 1 817 | 1 352 | 1 185 | 1 155 | -2.5 | -14.6 | -36.4 | -50.5 |
Table 3.2. Road fatalities by road user group
Figure 3.2. Road fatalities by road user group in percentage of total 2014
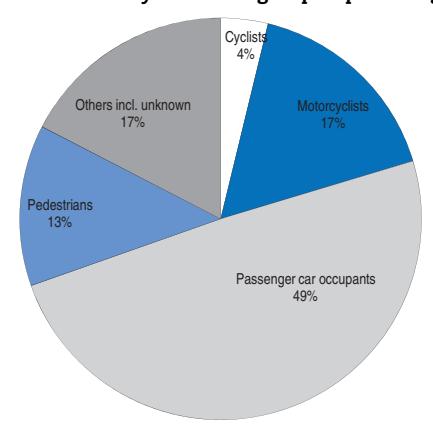
ROAD SAFETY ANNUAL REPORT 2016 © OECD/ITF 2016 55
Road safety by age group
Since 1990, fatality decreases were observed among all age groups. The biggest decreases were observed for young people aged between 6 and 20.
Road users aged 65 and over presently account for 22% of all deaths. Ten years ago this proportion was 16%. This group presently makes up 15% of the total population, compared to 13% ten years ago.
In 2014, there was a sharp increase, from 19 to 29, in the number of children below 6 killed in a traffic crash. This was reversed in 2015 falling back below 2013 levels.
The age group 18 to 20 has a death rate of 9.3 per 100,000 people, nearly twice that of the average population. The death rate of the senior citizen above 65 (7) is also significantly higher.
| 2015 % change from | |||||||||||
|---|---|---|---|---|---|---|---|---|---|---|---|
| Age | 1990 | 2000 | 2010 | 2013 | 2014 | 2015 | 2014 | 2013 | 2010 | 2000 | 1990 |
| 0-5 | 70 | 51 | 26 | 19 | 29 | 16 | -44.8 | -15.8 | -38.5 | -68.6 | -77.1 |
| 6-9 | 55 | 17 | 13 | 19 | 11 | 10 | -9.1 | -47.4 | -23.1 | -41.2 | -81.8 |
| 10-14 | 59 | 46 | 17 | 12 | 13 | 17 | 30.8 | 41.7 | 0.0 | -63.0 | -71.2 |
| 15-17 | 129 | 104 | 53 | 39 | 29 | 47 | 62.1 | 20.5 | -11.3 | -54.8 | -63.6 |
| 18-20 | 340 | 204 | 138 | 80 | 86 | 93 | 8.1 | 16.3 | -32.6 | -54.4 | -72.6 |
| 21-24 | 278 | 178 | 141 | 106 | 102 | 84 | -17.6 | -20.8 | -40.4 | -52.8 | -69.8 |
| 25-64 | 1 049 | 923 | 745 | 636 | 644 | 670 | 4.0 | 5.3 | -10.1 | -27.4 | -36.1 |
| 65 | 351 | 294 | 218 | 273 | 240 | 270 | 12.5 | -1.1 | 23.9 | -8.2 | -23.1 |
| Total | 2 331 | 1 817 | 1 352 | 1 185 | 1 155 | 1 207 | 4.5 | 1.9 | -10.7 | -33.6 | -48.2 |
Table 3.3. Road fatalities by age group
Figure 3.3. Road fatality rates by age group Deaths per 100 000 inhabitants in a given age group, 1990-2015
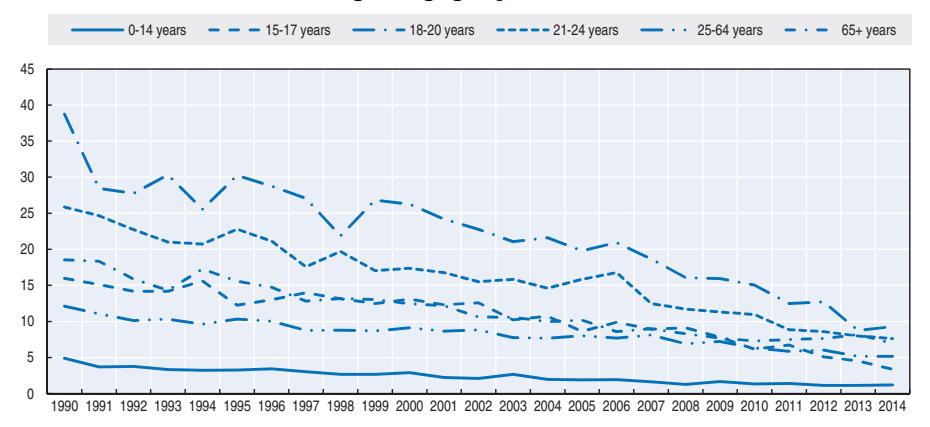
56 ROAD SAFETY ANNUAL REPORT 2016 © OECD/ITF 2016
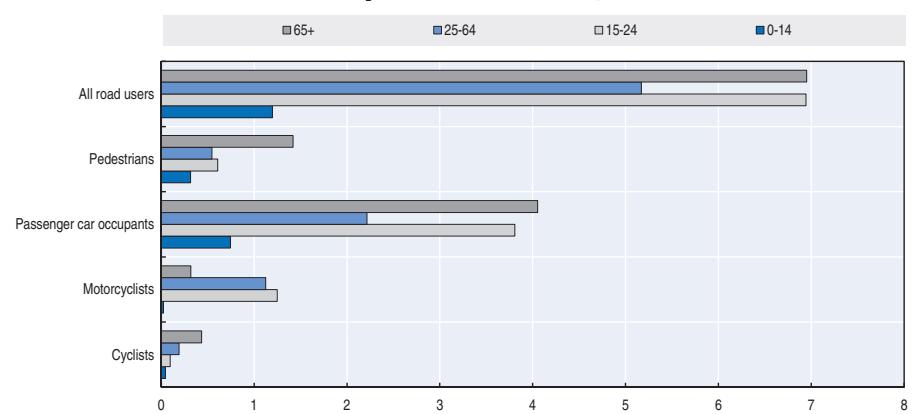
Figure 3.4. Road fatality rate by age and road user group Fatalities per 100 000 inhabitants, 2014
Road safety by road type
Road fatality rates are higher for people who live in rural areas (particularly remote ones) than for people living in major cities. People living outside cities tend to do more of their driving at highway speeds, more driving on lower standard rural roads and more driving overall. Effective enforcement of speed limits, alcohol restrictions and seat belt use is more difficult in rural areas.
Only a small proportion of the rural road network in Australia is a divided road and an even smaller proportion is motorway standard. National and state road safety strategies emphasise the importance of road infrastructure improvements, including relatively low cost measures applicable to single-carriageway roads.
Approximately one-third of all fatal crashes occur in posted speed zones of 100km/h.
Economic costs of traffic crashes
The annual economic cost of road crashes in Australia is an estimated AUD 27 billion per year, based on 2006 data. This estimate is equivalent to 1.8% of national GDP in 2012-13. A willingness-to-pay methodology was used to value the human losses from road crashes.
The estimated cost includes non-reported crashes and injuries.
Unit cost [AUD] Total [AUD billion] Fatalities 9.9 Injury and disability 10.3 Property damage and other costs 6.9 Total 27.1 Total as % of GDP 1.8
Table 3.4. Costs of road crashes, 2006
Source: BITRE (2010); BITRE (2014).
Recent trends in road user behaviour
Speed
Australia does not have reliable national data on the contribution of speed to serious crashes. Police crash reports have suggested that excessive speed is a factor in about a third of all fatal crashes, though this is likely to be an underestimate.
Statistical series and other evaluation studies in individual jurisdictions indicate that speed management measures have made an important contribution to reducing road fatalities and injuries. For example, an authoritative evaluation of a package of Victorian speed-management initiatives in the early 2000s found a 10% reduction in all casualty crashes and a 27% reduction in fatal crashes. National data on speed distributions are not available. Obtaining such data has been identified as a priority to support the effective monitoring of progress under the National Road Safety Strategy.
Under Australia's National Road Safety Strategy, there have been moves to better align posted speed limits with the objective risk profiles of roads. This has led, for example, to an expansion of lower urban speed zones (typically 40 km/h) in areas with high pedestrian and cycling activity.
Nationally co-ordinated work has recently been undertaken to develop guidelines for speed limits at high-risk locations and to facilitate the adoption of best practice speed limits more broadly.
Over the last 10 years, most Australian jurisdictions have taken steps to strengthen speed enforcement programmes, particularly through increased use of mobile and fixed cameras; in recent years several jurisdictions on a modest scale have introduced, or planned to introduce, point to point camera systems to measure average speed.
Most jurisdictions have reviewed their speeding sanctions and several have announced stronger penalties, mainly for high-range offences.
The table below summarises the main speed limits in Australia. It should be noted that speed limits are state-based, but there is broad consistency across jurisdictions.
| General speed limit | Comments | |
|---|---|---|
| Urban roads (non-arterial) | 50 km/h Increasing use of 40 km/h limits in urban areas with high pedestrian activities |
|
| Urban roads (non-arterial) | 60 km/h to 80 km/h | |
| Rural roads (undivided) | 100 km/h | |
| Rural roads (divided) | 100 km/h or 110 km/h | |
| Motorways | 110 km/h |
Table 3.5. Passenger car speed limits by road type, 20161
Drink driving
In Australia, it is illegal to drive a motor vehicle with blood alcohol content (BAC) of 0.5 g/l or higher. Lower BAC limits apply to truck, bus and taxi drivers (typically 0.2 g/l) and to novice drivers (0.0).
All jurisdictions have had considerable success in reducing the contribution of alcohol to road trauma, largely attributable to the combination of intensive random breath-testing programmes and ongoing public education campaigns. While absolute numbers of
1. Speed limits are state-based and may vary from one state to another.
alcohol-related fatalities have continued to decline over the last decade, it is estimated that about 28% of all fatally injured motorists have a BAC above the maximum legal limit of 0.5 g/l.
This figure varies significantly among jurisdictions, with rural and remote areas of Australia presenting particular challenges for the implementation of effective deterrence measures.
Drugs and driving
While a smaller problem than alcohol, there is evidence that other drugs (both illicit and prescription) are a factor in Australian road trauma. It is very difficult to obtain reliable data on drug involvement in serious crashes, though estimates from coroner information have suggested that about 7% of road deaths involve drug-driving as a factor (excluding cases also involving alcohol).
In recent years, most jurisdictions have introduced random roadside drug-testing programmes, supported by laws that make it illegal to drive a motor vehicle with a prescribed drug present in their blood or oral fluid. These laws currently focus on selected illicit drugs, such as cannabis, methamphetamines and ecstasy.
Distraction
Distracted driving is recognised as a major and potentially growing problem in Australia. However, there is no official definition for 'distracted driving' for national statistical collection. Mobile phone use is a particular concern, with self-report surveys consistently finding that about 60% of drivers use a mobile phone while driving. Of particular concern is the significant minority of drivers who admit to reading (32%) or sending (18%) text messages while driving.
It is illegal to use a hand-held phone while driving in all jurisdictions. Learner and provisional licence-holders in some jurisdictions are subject to further restrictions, including a total ban on phone use while driving. Breaches attract fines and licence demerit points.
Sleepiness and fatigue
There is no definitive measure of fatigue involvement in crashes, though various estimates suggest that fatigue may be a factor in 20-30% of fatalities.
Seat belts and helmets
Seat belt use has been compulsory in all states since the 1970s. In most states there are licence demerit point penalties as well as fines for unbelted drivers, and in some states demerit points apply to drivers with unbelted passengers (in addition to fines for unbelted adult passengers).
Children under 7 years of age must be seated in a rear seat (if available) and be adequately restrained in an appropriate child restraint or booster seat, taking into account their weight and height.
Objective nationwide data on usage rates is not available, but non-national observational surveys and self-report data from national surveys indicate that usage rates for both front and rear-seat occupants are now in excess of 95%.
Despite high general usage rates, the rates of non-use among fatally injured vehicle occupants are still estimated at 27%. Analysis indicates that this high figure is the result of a high crash involvement rate among those who do not wear belts, as well as the fact that they are more likely to be killed if involved in a crash.
Table 3.6. Seat belt wearing rate by car occupancy and road type
| % | | | | | | | | |-------------------------------|------|------|--|--|--|--|--| | | 2000 | 2013 | | | | | | | Front seat | | | | | | | | | General (driver + passengers) | 96 | 97 | | | | | | | Rear seats | | | | | | | | | General | 89 | 96 | | | | | |
Helmets are compulsory for motorcycle and moped riders and cyclists. Approximately 1 in 10 motorcyclists and 1 in 4 cyclists killed in road crashes were not wearing a helmet. There is no national data on general helmet usage rates.
National road safety strategies and targets
Organisation of road safety
In Australia's federal system, government responsibilities for road safety vary across jurisdictions. The Australian Government is responsible for regulating safety standards for new vehicles and for allocating infrastructure resources, including for safety, across the national highway and local road networks.
State and territory governments are responsible for funding, planning, designing and operating the road network, managing vehicle registration and driver licensing systems, and regulating and enforcing road user behaviour.
Local governments have responsibilities for funding, planning, designing and operating road networks in their local areas.
Road safety strategy for 2011-2020
The National Road Safety Strategy 2011-2020 represents the commitment of Australia's nine federal, state and territory governments to an agreed set of national road safety goals, objectives and actions. The strategy is firmly based on Safe System principles and is framed by the guiding vision that no person should be killed or seriously injured on Australia's roads.
Following a comprehensive review of Australia's National Road Safety Strategy 2011-20, work was undertaken to develop a new Action Plan (for 2015-2017) which was endorsed by Transport Ministers in November 2014. The National Road Safety Action Plan 2015-17 outlines 19 priority action items for the three years. It is intended to focus national efforts on activities that will deliver or support significant long-term improvements to the safety of Australia's road transport system, especially through strategic investment in infrastructure safety, vehicle safety and capacity building work. The nineteen actions detailed in the Action Plan are grouped into four broad areas of activity under the following headings:
- prioritising the investments in infrastructure
improving the safety of our vehicle fleet
encouraging safer road use
advancing the Safe System
Road safety targets
The strategy presents a 10-year plan to reduce the annual numbers of both deaths and serious injuries on Australian roads by at least 30% by 2020, relative to the average numbers of fatalities and serious injuries in the baseline period 2008-10. The evaluated fatalities target value for 2020 is 998 per year. Road fatality statistics show that the number of national deaths in 2014 (1 155) was 19% below the strategy baseline average (1 426) and 16% over the target value. However, preliminary road fatality statistics for 2015 (1 207) indicate the number of deaths has increased.
In developing these targets, data modelling was carried out to calculate the level of serious casualty reduction that could realistically be achieved over the life of the strategy.
The modelling work was informed by a review of Australian and overseas research on the effectiveness of a number of road safety interventions. A macro-modelling approach was used to estimate the reductions in people killed or seriously injured that would result from a range of possible road safety interventions, during the 10-year life of the strategy. Only a limited set of initiatives was modelled, in an attempt to identify the areas of greatest potential gain during the life of the strategy and to illustrate the broad degree of intervention (at a national level) that would be required in each area. Some types of initiatives did not lend themselves to modelling.
The primary measure of success for the 10-year strategy will be the actual reduction in the numbers of deaths and serious injuries from road crashes. Intermediate progress is assessed annually using the high level outcome indicators and safety performance indicators developed for detailed progress monitoring, and a comprehensive annual report on progress is prepared for Federal, state and territory Transport Ministers each year. A comprehensive review of progress after the first three years led to the identification of implementation priorities and key actions for the next three years. These then informed the development and adoption by governments of the Action Plan for 2015-2017 with a focus on 19 priority action items.
The targets included in the new Sustainable Development Goals (including a 50% reduction in the number of road fatalities by 2020) will be a significant challenge for most countries to meet, including Australia. The current targets adopted under the National Road Safety Strategy 2011-2020 are to reduce the numbers of both deaths and serious injuries by at least 30% by 2020.
The Australian Government is discussing these issues and the implications of the new Sustainable Development Goals with the state and territory governments through national forums.
Monitoring targets
To help monitor the implementation of the national strategy, a range of high-level outcome indicators and more specific Safety Performance Indicators (SPIs) were adopted as empirical measures of progress. The indicators are mainly based on crash data and have necessitated the development of a new national compilation of state and territory data, which is managed by the Department's Bureau of Infrastructure, Transport and Regional Economics (BITRE).
ROAD SAFETY ANNUAL REPORT 2016 © OECD/ITF 2016 61
In addition to data monitoring, the Department works with state and territory transport agencies to periodically gather and compile information on actions taken to deliver the strategy's initiatives.
As noted above, a review of Australia's National Road Safety Strategy 2011-2020 was undertaken in 2014. This included a review of recent road safety research literature, an assessment of progress in implementing the national strategy and identification of issues to be addressed as a matter of priority.
In February 2015 Austroads published the results of a project it commissioned to provide substantial input to the review of the National Road Safety Strategy. This work was designed to identify new countermeasures or changes in trauma patterns that would inform national road safety priorities. The main findings of the review are described in brief below:
- Good statistical progress was made in the first three years of the National Road Safety Strategy, as measured by overall changes in annual road fatalities. The number of deaths in 2013 was 17% below the 2008-10 baseline period.
- Fatality trends were less positive for certain sub-groups of road users, particularly cyclists, motorcyclists and older drivers.
- Progress in reducing serious injury numbers was difficult to determine because of the lack of reliable, nationally consistent, non-fatal crash data. Available hospital data provided some evidence that serious injury levels had not declined in concert with the general downward trend in deaths.
- The review found that progress in implementing the 59 'first steps' actions in the National Road Safety Strategy was varied, though there was evidence that most had progressed to some extent and that there had been a number of clear achievements. Progress had been particularly strong in the vehicle safety area.
- The review concluded that the high-level content of the strategy its guiding vision, targets, key directions and Safe System principles – remain valid and appropriate for the 10-year strategy.
- The review identified a range of priority areas where road safety progress appears to have been lagging.
- The review also concluded that the next phase of the National Road Safety Strategy should be guided by a more concise action plan than the initial agenda for first steps: It should focus on issues that clearly warrant national attention and that can be addressed through specific national actions. The findings of the strategy review informed the development of the three-year Action Plan for 2015-17.
Recent safety measures (2013-16)
Road safety management
- Improved co-ordination and advisory arrangements for national road safety activities (including the National Road Safety Strategy) were put in place through Austroads. This included arrangements for better national engagement between transport and police agencies.
- The National Road Safety Partnership Program was launched in 2014 as a major industrysupported initiative encouraging private sector organisations to develop positive road safety cultures and implement effective road safety strategies within their workplaces. Participation has been strong and continues to grow.
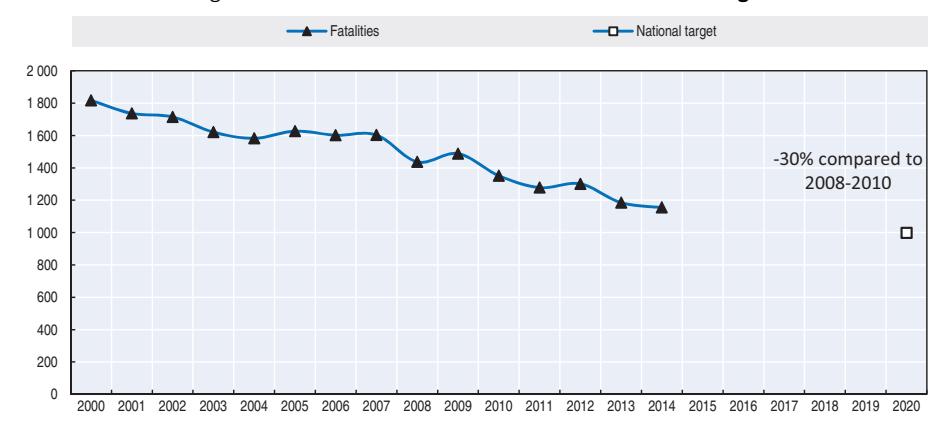
Figure 3.5. Trends in road fatalities towards national target
● A pilot project established in 2015 aims to demonstrate the strengths and limitations of adopting a national data linkage approach to improve measurement and reporting of non-fatal injury road crashes.
Road users
Driving license
- There has been ongoing work in several Australian states to strengthen graduated licensing systems (GLS), supported by Austroads research on the safety evidence associated with different GLS elements. In 2014, New South Wales led a national project to develop a best-practice policy framework for GLS.
- Several jurisdictions have initiated licensing support programmes for people in indigenous communities. This includes the successful completion of a major two-year trial of the DriveSafe NT Remote programme in the Northern Territory, which helped 623 people in remote and very remote regions obtain a full driver's licence.
Drink driving
● States have continued to expand the use of alcohol interlock programmes, and with the commencement of a programme in Western Australia later in 2016, all jurisdictions will have these in place for drink driving offenders.
Speed management
- Significant action was taken in some jurisdictions to adopt safer speed limits. Most notably, lower speed limits were reduced on substantial sections of the rural network in South Australia and on unsealed roads in Tasmania; while 40 km/h limits were increasingly introduced in most capital cities, targeting areas with high pedestrian and cyclist activity.
- Efforts to facilitate the implementation of intelligent speed adaptation (ISA) have been proceeding, focused on the development of suitable speed-limit maps, exploration of the potential regulatory role of ISA in managing high-risk drivers, and integration of safety
assist technologies such as ISA into the Australasian New Car Assessment Program's star rating system. In 2014, New South Wales introduced an ISA advisory app for mobile phones that is available free-of-charge to the public.
● The National Transport Commission has work underway to assess a number of enforcement approaches to reduce speeding by heavy vehicles.
Infrastructure
Federal, state and territory governments invested significantly in a range of infrastructure improvement initiatives. These included:
- The Australian Government has committed AUD 500 million over five years to the national Black Spot Programme.
- Major investments in safe roads of AUD 1 billion in Victoria and AUD 100 million in South Australia.
- Significant infrastructure upgrades including wide median treatments on 20% of the Bruce Highway in Queensland; and AUD 36 million from fine revenue toward addressing single vehicle run-off-road crashes in Western Australia.
- The New South Wales Community Safety Fund (fines from speed cameras) allocated more than AUD 60 million for targeted road safety infrastructure treatments and Black Spots under the Safer Roads Engineering Program.
Austroads developed the Australian National Risk Assessment Model (ANRAM) to help jurisdictions better target infrastructure safety investments using an objective risk-based approach. Austroads is also developing a training package to assist with translating Safe System knowledge and research into practice.
Vehicles
Major vehicle safety activities in recent years have included:
- Increased harmonisation of Australia's vehicle safety standards the Australian Design Rules – with regulations of the United Nations Economic Commission for Europe and Global Technical Regulations.
- Given its commitment to harmonisation, Australia participates actively in the development of international vehicle regulations. A major initiative has been Australia's leadership of Global Technical Regulation 14/UN Regulation (UNR) 135 on Pole Side Impact, which will reduce fatalities and injuries in all side impacts (which account for 20% of Australian road deaths and similar figures in some other countries).
- New Australian Design Rules for pole side impact performance for light passenger and commercial vehicles, seat belt reminders, ISOFIX child seats, Brake Assist Systems for light passenger and commercial vehicles, Electronic Stability Control for light commercial vehicles and Antilock Brake Systems for heavy vehicles.
- Regulation Impact Statements are under development to consider ADRs on Antilock Brake Systems for motorcycles and Electronic Stability Control for heavy vehicles.
- Continued expansion of the Australasian New Car Assessment Program (ANCAP). Under Australia's National Road Safety Strategy 2011-20, statistical performance indicators are benchmarked against the three-year period 2008 to 2010. Data to 2014 showed positive changes in key vehicle safety indicators, with the proportion of new light vehicles sold with a 5-star ANCAP rating having increased by 54%, to 86% of new vehicles.
● The National Transport Commission and the National Heavy Vehicle Regulator (NHVR) have worked together on a joint programme to improve heavy vehicle roadworthiness.
Recent and ongoing research
Bureau of Infrastructure, Transport and Regional Economics
- The impact of airbags and electronic stability control on Australian light vehicle fatalities: www.bitre.gov.au/publications/2015/is\_068.aspx.
- Impact of road trauma and measures to improve outcomes: www.bitre.gov.au/publications/ 2014/report\_140.aspx.
- Road safety of older Australians: recent statistics: www.bitre.gov.au/publications/2014/is\_ 050.aspx.
- Australian cycling safety http://bitre.gov.au/publications/2015/is\_071.aspx.
- Pedestrians and road safety http://bitre.gov.au/publications/2015/is\_070.aspx. Austroads
- Austroads, the association of Australasian road transport and traffic agencies, manages an ongoing programme of nationally coordinated road safety research work: www.austroads.com.au/road-operations/road-safety/safety-program. This has a focus on work that will support the development of Safe System transport networks and includes research projects on land use planning processes, infrastructure performance and the development of a Safe System assessment framework, as well as work to help translate Safe System infrastructure research and knowledge into practice.
Some key completed pieces of research from this programme include:
- Review of the National Road Safety Strategy: www.onlinepublications.austroads.com.au/ items/AP-R477-15.
- Options for rehabilitation in interlock programmes: www.onlinepublications.austroads.com. au/items/AP-R484-15.
- Public demand for safer speeds: identification of interventions for trial: www.online publications.austroads.com.au/items/AP-R507-16.
- Model national guidelines for setting speed limits at high-risk locations: www.online publications.austroads.com.au/items/AP-R455-14.
- Summary of literature of the effective components of graduated driver licensing systems: www.onlinepublications.austroads.com.au/items/AP-R476-15.
- Best practice model for an Australian Graduated Licensing Scheme, published October 2014: http://roadsafety.transport.nsw.gov.au/research/gls/index.html.
- Social costs of road crashes in Australia: the case for willingness-to-pay values for road safety: www.onlinepublications.austroads.com.au/items/AP-R438-15.
- Investigation of key crash types: rear-end crashes in urban and rural environments: www.onlinepublications.austroads.com.au/items/AP-R480-15.
- Investigation of key crash types run-off-road and head-on crashes in urban areas: final report: www.onlinepublications.austroads.com.au/items/AP-R450-14.
- Providing for road user error in the Safe System: www.onlinepublications.austroads.com.au/ items/AP-R460-14.
ROAD SAFETY ANNUAL REPORT 2016 © OECD/ITF 2016 65
- Australian National Risk Assessment Model: www.onlinepublications.austroads.com.au/items/ AP-R451-14.
- Safe System assessment framework for road infrastructure projects: www.onlinepublications. austroads.com.au/items/AP-R509-16.
References
BITRE (2010), Cost of Road Crashes in Australia 2006, Research Report 118, Department of Infrastructure, Transport, Regional Development and Local Government, Canberra.
BITRE (2014), Impact of Road Trauma and Measures to Improve Outcomes, Research Report 140, Department of Infrastructure, Transport, Regional Development and Local Government, Canberra.
Websites
- National Road Safety Strategy 2011-2020: www.roadsafety.gov.au.
- National Road Safety Action Plan 2015-2017: http://roadsafety.gov.au/action-plan/files/National\_Road\_ Safety\_Action\_Plan\_2015\_2017.pdf (accessed 11 March 2016).
- Department of Infrastructure and Regional Development: www.infrastructure.gov.au/roads/safety.
- Bureau of Infrastructure, Transport and Regional Economics: www.bitre.gov.au/.
- Australian Road Deaths Database: https://bitre.gov.au/statistics/safety/fatal\_road\_crash\_database.aspx (accessed 11 March 2016).
- Road Trauma Australia: Annual Summaries: https://bitre.gov.au/publications/ongoing/road\_deaths\_ australia\_annual\_summaries.aspx (accessed 11 March 2016).
- Austroads: www.austroads.com.au/.
- Review of the National Road Safety Strategy: www.onlinepublications.austroads.com.au/items/AP-R477-15 (accessed 11 March 2016).
- ARRB, Australian Road Research Board: www.arrb.com.au.
- Monash University Accident Research Centre: www.monash.edu.au/miri/research/research-areas/transportsafety/.
- ● Centre for Automotive Safety Research: http://casr.adelaide.edu.au/.
- Centre for Accident Research & Road Safety Queensland: www.carrsq.qut.edu.au/.
- Transport and Road Safety (TARS) Research: www.tars.unsw.edu.au/research/index.html.
- The George Institute for Global Health: www.georgeinstitute.org.au/our-work/our-divisions/injury.
Chapter 4
Austria
This chapter presents 2014 road safety data for Austria along with provisional data from 2015. It looks at trends in traffic and road safety from the years 1990 to 2014 and road user behavior patterns. This includes data on speed, drink driving, drugs and driving, distracted driving, fatigue and other factors involved in road crashes. The chapter reviews Austria's road safety strategy and national targets to 2020 and the progress achieved thus far. It also highlights the most recently implemented safety measures.*
* All data stem from KFV (Kuratorium für Verkehrssicherheit, based on disaggregated police data provided by Statistik Austria) and IRTAD unless otherwise noted. For more information please contact: klaus.machata@kfv.at.
The long-term downward trend of road fatalities continued in 2014. The number of road fatalities in 2014 was 430, which is the lowest number since 1961 when safety records began. Fatalities in the cyclist, motorcyclist and pedestrian groups decreased by more than 10% compared to 2013.
Road safety data collection
Definitions applied in Austria
Data included in this report correspond to the consolidated set of police data.
- Road fatalities refer to deaths within 30 days of the crash.
- Injury crashes are crashes resulting in at least one injured or killed person.
- Since 2012 injured persons are subdivided into seriously injured and slightly injured. (Prior to 2012, a third category, "unknown degree of severity", existed).
- ❖ Seriously injured persons are those suffering an injury resulting in an inability to work or health problems for more than 24 days.
- ❖ Slightly injured are all other injured persons.
Data collection
In Austria, crash data are collected by the police. The crash data acquisition process was completely transformed in January 2012 from paper forms to integrated data input including geographic information system (GIS) support. It is believed that this has significantly reduced underreporting rates, especially for less severe road crashes (see resulting increase in the number of injury crashes in Table 4.1 from 2010 to 2013). However, due to the change in collection method, data for injuries and crashes since 2012 cannot be directly compared with previous figures. This does not apply to the number of fatalities.
Injury severity is assessed by the police at the crash scene, with only occasional feedback from hospitals; it is not possible to link police and hospital data directly on the basis of the present data architecture.
Regular estimates for the number of serious injuries are required by the European Commission, based on a Maximum Abbreviated Injury Scale (MAIS) score of 3 or more (MAIS3+). In 2015, for the first time in Austria, this estimate was derived from the International Classification of Diseases-10 (ICD-10) hospital data on road traffic victims.
Most recent safety data
Road crashes in 2015 – provisional data
Based on provisional data, the number of fatalities was 11% higher than in 2014. This increase was predominantly seen among car occupants (+26%), but also pedestrians (+11%) and powered two-wheeler (PTW) riders (+9%).
This relatively bad performance is in part explained by the fact that 2014 had been an extraordinarily good year and had broken all-time records for months June through September. The usual summer high in fatality counts was much less pronounced in 2014 (potential contributors being cool and rainy weather and rising unemployment rates) – whereas 2015 had largely returned to average seasonal values. Initial analysis confirms that exposure on the high level road network was higher in 2015 than in 2014 for the months June through September, especially on weekends.
Road crashes in 2014
The long-term downward trend of road fatalities continued in 2014. The number of road fatalities declined by 5.5% in 2014 to 430, which is the lowest number since 1961 when safety records began. This development holds true for most road user groups in 2014. Since 2013, motorcycle fatalities are the second largest group of road casualties.
In 2014, the police recorded 37 957 injury crashes (-1.4 % compared to 2013). Since the increase observed in 2012 when the crash data collection method was changed, the trend has been downward. However, as this trend is relatively short, the observed reduction has to be interpreted with caution.
Trends in traffic and road safety (1990-2014)
Traffic
Since 1990, the number of vehicles has increased by 52.5% and the number of kilometres driven has increased by 65% (2013 data). Until 2008, the average yearly increase in kilometres driven was nearly 3%; in 2009, the trend shifted downward and growth since then has been about 1.1% annually. However, 2014 saw an increase of nearly 3%, mostly accounted for by increased private car use.
Road safety
Crashes and casualties
Between 1990 and 2014, the number of road fatalities decreased by 72%. More recently (2000 to 2014), the number of fatalities decreased by 56%. A rise of crash figures in 2012 was artificially induced by the new data collection methodology. As a result, injury crash counts for 2012 and later cannot be compared to previous years.
The substantial decline in road mortality since 1990 was marked by the implementation of the first two integrated road safety programmes in Austria incorporating a variety of measures including:
- second phase education for novice drivers after granting the driving licence
- automatic section control of average speeds along stretches of motorways and rural roads
- awareness campaigns in such areas as seat belt and child restraint use, alcohol and child safety
- large-scale roadside testing for alcohol using alcohol screening devices
- penalty point system.
Rates
The road death rate per 100 000 inhabitants has decreased by 75% since 1990, while the number of vehicles per 1 000 inhabitants has increased by 37%.
Analysis of seriously injured data
In 2014 and 2015, KfV carried out a feasibility study on MAIS3+ assessment on behalf of the Austrian Transport Ministry (BMVIT). The study covered two methods of estimating the number of serious road injuries:
- application of a (hospital data based) correction factor to the police reported number of serious injuries
- use of hospital data alone to arrive at an estimate for serious injuries.
The latter method was selected for further use. In late 2015, for the first time, the number of MAIS3+ injuries was estimated, totalling 1 410 for the year 2014. For the same year, the number of fatalities was 430, resulting in a ratio of 3.28 between serious injuries and fatalities.
The accuracy of the estimation procedure may be substantially influenced by data quality and the accuracy of the Hospital Discharge Register.
| 2014 % change from | |||||||||
|---|---|---|---|---|---|---|---|---|---|
| 1990 | 2000 | 2010 | 2013 | 2014 | 2013 | 2010 | 2000 | 1990 | |
| Reported safety data | |||||||||
| Fatalities | 1 558 | 976 | 552 | 455 | 430 | -5.5 | -22.1 | -55.9 | -72.4 |
| Injury crashes1 | 46 338 | 42 126 | 35 348 | 38 502 | 37 957 | -1.4 | 7.4 | -9.9 | -18.1 |
| Injured persons hospitalised (MAIS3+) | 1 410 | ||||||||
| Deaths per 100 000 inhabitants | 20.4 | 12.2 | 6.6 | 5.4 | 5.1 | -6.1 | -23.5 | -58.6 | -75.2 |
| Deaths per 10 000 registered vehicles | 3.7 | 1.8 | 0.9 | 0.7 | 0.7 | -6.8 | -27.0 | -62.2 | -81.9 |
| Deaths per billion vehicle kilometres | 32.0 | 15.0 | 7.3 | 5.8 | 5.4 | na | -19.9 | -61.1 | -81.8 |
| Traffic data | |||||||||
| Registered vehicles2 (thousands) | 4 186 | 5 471 | 5 981 | 6 300 | 6 385 | 1.3 | 6.8 | 16.7 | 52.5 |
| Vehicle kilometres2 (millions) | 48 687 | 65 143 | 75 894 | 78 108 | 80 150 | na | 2.9 | 19.9 | 60.4 |
| Registered vehicles per 1 000 inhabitants2 | 548 | 684 | 716 | 745 | 751 | 0.7 | 4.8 | 9.8 | 37.1 |
Table 4.1. Road safety and traffic data
1 2 http://dx.doi.org/10.1787/888933385354
Road safety by user group
Since 1990, all road users in Austria have benefited from improvements in road safety. By 2014, there was a 79% reduction in fatalities among the largest group, car occupants. Among the second largest group, pedestrians, by 2012 fatalities were reduced by 73% with a further substantial 15% reduction between 2013 and 2014. This positive development is contrasted by an increase since 2010 in motorcycle fatalities (10%), making this group the second largest in terms of fatalities following car occupants, which represent 44% of all fatalities.
Cycling popularity is increasing in Austria and municipalities are providing additional and safer cycling infrastructures. The cyclists group accounted for 10% of all fatalities in 2014.
Road safety by age group
Since 1990, the reduction in fatalities has benefited all age groups. For most groups, their fatalities decreased by more than 70%. Historically, young people represent a high-risk group in road safety. In 1990, the highest number of fatalities per 100 000 inhabitants was recorded for persons 18-20 years old (59), followed by the 21-24 years old group (35). In 2014
1. Due to a change in crash data collection methods a direct comparison of data on injury crashes, or injured road users, with data recorded before 2012 is not possible.
2. Including mopeds.
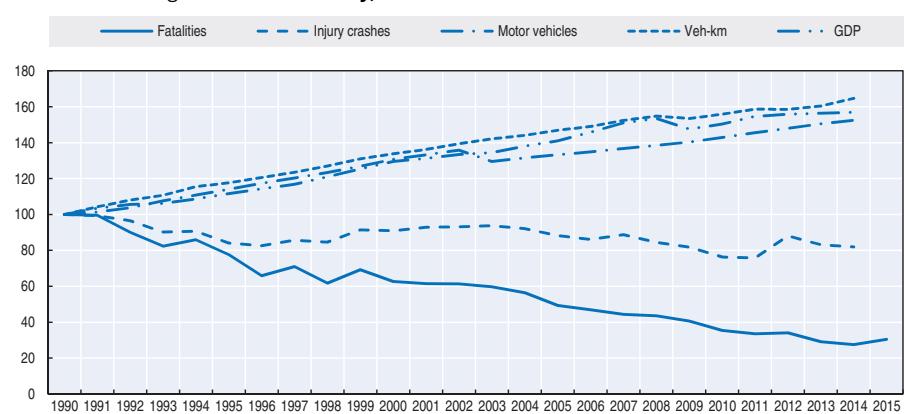
Figure 4.1. Road safety, traffic and GDP trends index 1990 = 100
Note: A direct comparison of data on injury crashes, or injured road users, with data recorded before 2012 is not possible. Source: World Bank for growth domestic product (constant prices).
Table 4.2. Road fatalities by road user group
| 2014 % change from | |||||||||
|---|---|---|---|---|---|---|---|---|---|
| 1990 | 2000 | 2010 | 2013 | 2014 | 2013 | 2010 | 2000 | 1990 | |
| Cyclists | 106 | 62 | 32 | 51 | 45 | -11.8 | 40.6 | -27.4 | -57.5 |
| Moped users | 88 | 44 | 18 | 15 | 14 | -6.7 | -22.2 | -68.2 | -84.1 |
| Motorcyclists | 112 | 112 | 68 | 87 | 75 | -13.8 | 10.3 | -33.0 | -33.0 |
| Passenger car occupants | 913 | 549 | 292 | 193 | 189 | -2.1 | -35.3 | -65.6 | -79.3 |
| Pedestrians | 260 | 140 | 98 | 83 | 71 | -14.5 | -27.6 | -49.3 | -72.7 |
| Others | 78 | 69 | 44 | 26 | 36 | 38.5 | -18.2 | -47.8 | -53.8 |
| Total | 1 558 | 976 | 552 | 455 | 430 | -5.5 | -22.1 | -55.9 | -72.4 |
Figure 4.2. Road fatalities by road user group in percentage of total 2014
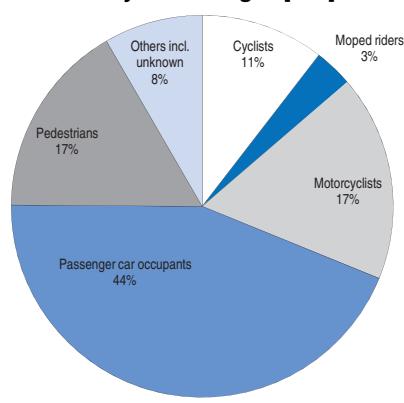
this rate decreased to 9 and 8 respectively and has even gone below the rate for the other groups (7 for 65+, 6 for 15-17, 5 for 25-64, and 1 for 0-14).
Excepting the lower age groups (under 15 years old), where fatalities are too low for a meaningful interpretation, the highest rate of decrease in fatalities, 19%, was for the 65+ group between 2013 and 2014, while fatalities for the other groups slightly increased or remain unchanged.
| 2014 % change from | |||||||||
|---|---|---|---|---|---|---|---|---|---|
| Age | 1990 | 2000 | 2010 | 2013 | 2014 | 2013 | 2010 | 2000 | 1990 |
| 0-5 | 32 | 7 | 5 | 2 | 3 | Figures too small | -57.1 | -90.6 | |
| 6-9 | 16 | 5 | 1 | 1 | 3 | for meaningful | -40.0 | -81.3 | |
| 10-14 | 19 | 14 | 4 | 7 | 2 | comparison in % | -85.7 | -89.5 | |
| 15-17 | 55 | 37 | 27 | 14 | 16 | 14.3 | -40.7 | -56.8 | -70.9 |
| 18-20 | 205 | 105 | 45 | 23 | 26 | 13.0 | -42.2 | -75.2 | -87.3 |
| 21-24 | 186 | 99 | 57 | 33 | 33 | 0.0 | -42.1 | -66.7 | -82.3 |
| 25-64 | 764 | 518 | 273 | 233 | 232 | -0.4 | -15.0 | -55.2 | -69.6 |
| 65 | 278 | 190 | 140 | 142 | 115 | -19.0 | -17.9 | -39.5 | -58.6 |
| Total | 1 558 | 976 | 552 | 455 | 430 | -5.5 | -22.1 | -55.9 | -72.4 |
Table 4.3. Road fatalities by age group

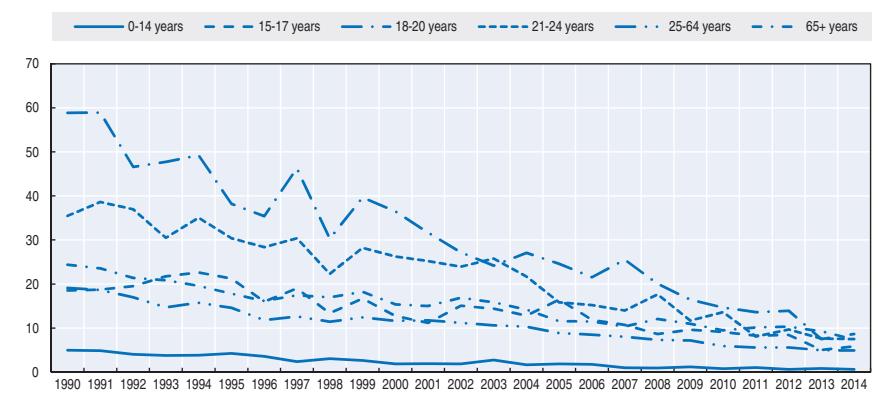
Road safety by road type
In 1990, 65% of fatalities occurred on rural roads, 25% in urban areas and 10% on motorways. While the overall fatalities have been reduced by 72% since 1990, fatalities on motorways decreased by the highest rate (77%) followed by 73% on rural roads and 69% inside urban areas.
In 2014, 63% of fatalities occurred on rural roads, 29% in urban areas and 9% on motorways. Compared with the previous year's statistics, the fatalities inside urban areas and on motorways increased by 7% and 9% respectively, but those on rural roads (the largest group) decreased by 12%, which contributed to the overall decrease.
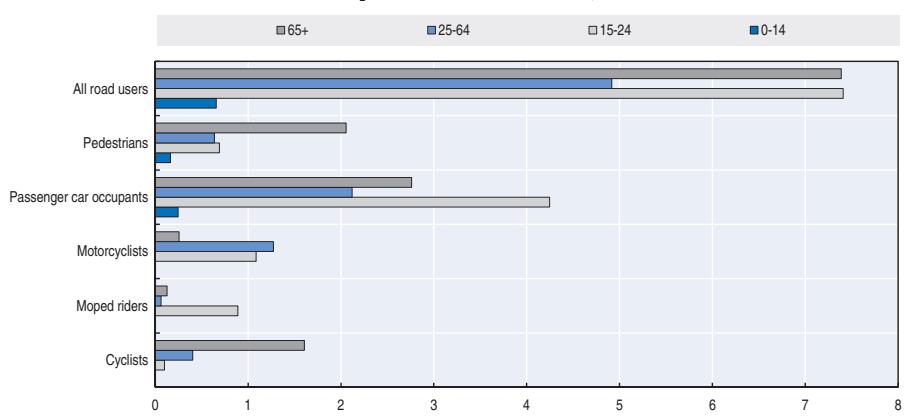
Figure 4.4. Road fatality rate by age and road user group Fatalities per 100 000 inhabitants, 2014
Figure 4.5. Road fatalities by road type
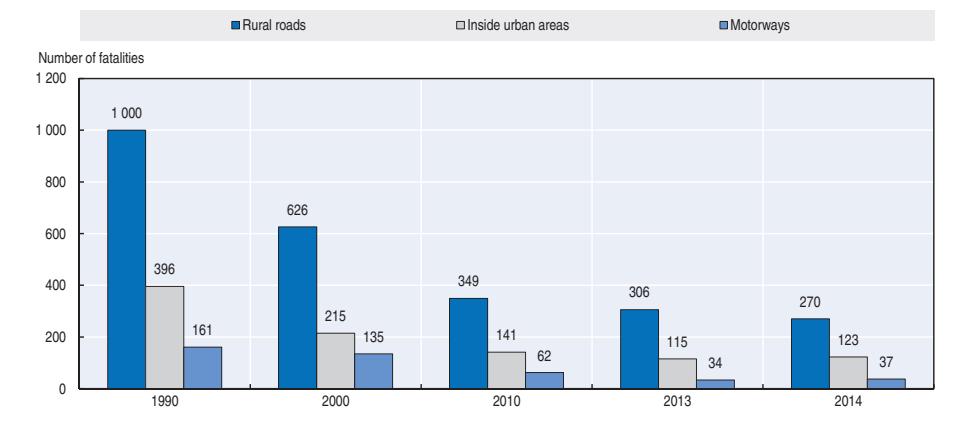
Economic costs of traffic crashes
Traffic crashes represent a very significant cost for Austrian society, estimated at around EUR 10 billion (about 3.4% of Gross Domestic Product).
There are no regular updates on the economic costs of traffic crashes in Austria, but according to a recent study (Herry et al., 2013), the costs of human suffering make up almost half of the crash costs (48% using the "willingness to pay" approach), while the most important other costs are material damage (25%), loss in achievement potential (15% using human capital approach), insurance administration (7%) and legal costs (2%).
Table 4.4. Costs of road crashes, 2014
| Unit cost (EUR) | Total (EUR billion) | |
|---|---|---|
| Fatalities | 3 016 194 | 1.58 |
| Hospitalised persons | 381 480 | 4.01 |
| Slight injuries | 26 894 | 0.93 |
| Property damage costs | 8 245 | 3.58 |
| Total | 10.09 | |
| Total as % of GDP | 3.4% |
Source: Herry et al., 2013.
Recent trends in road user behaviour
Speed
Speed, and especially inappropriate speed, is one of the main causes of crashes in Austria. According to a police assessment in 2014, 14% of all injury crashes and 26% of all road fatalities were caused by inadequate speed.
Due to restrictions in manpower, increases in speed surveillance by traffic police cannot be expected in the future, but automatic speed enforcement including section controls will be further developed. The table below summarises the main speed limits in Austria.
Table 4.5. Passenger car speed limits by road type, 2016
| General speed limit | |
|---|---|
| Urban roads | 50 km/h |
| Rural roads | 100 km/h |
| Motorways | 130 km/h |
Drink driving
To define drink driving crashes, Austria uses the definition recommended by the European Union project SafetyNet: any crash in which any active participant was found with a blood alcohol level above the legal limit.
The maximum permissible blood alcohol content (BAC) level for drivers in Austria has been 0.5 g/l since 1998. The level is 0.1 g/l for moped drivers younger than 20 years, novice drivers (holding a licence for less than two years), drivers of trucks over 7.5 tonnes and drivers of buses with more than nine seats.
Since 2002, every driver involved in an injury crash is tested for alcohol. However, it is not permitted in Austria to test a corpse or an unconscious person (unless the prosecutor requires it). Therefore the number of unreported cases is believed to be substantial.
In 2014 there were 2 213 drink-driving crashes (-6% compared to 2013) with 2 890 injured persons (-6%) and 32 fatalities (+3%). The share of fatalities in crashes involving an alcohol-intoxicated person rose from 6.8% in 2013 to 7.4% in 2014.
Drink driving remains a predominantly male problem. However, the share of drunk females in alcohol-related crashes has been on a steady increase since 2000 (8%) and reaching 16% in 2014.
Drugs and driving
Austrian regulations provide no specific thresholds for drug concentrations. It is forbidden to drive or ride a motor vehicle while under the influence of drugs.
Little is currently known about the prevalence of drugs as a causal factor in accidents. According to a subjective assessment of the Austrian police, in 2014, 4.2% of all injury crashes and 3.1% of all road fatalities were caused by impairment due to alcohol and illicit or pharmaceutical drugs.
Distraction
In 2014, about 38% of all road traffic crashes and 31% of all road fatalities were attributed to inattentiveness or distraction as the main causes for the crash.
In Austria, it is not allowed to drive while using a hand-held mobile phone. However, the use of hands-free devices is tolerated. The use of hand-held mobile phones while cycling was banned in 2013.
A legislative proposal was presented in 2015 with the aim of prohibiting hand-held mobile phone use during driving, now including texting, dialling, social media etc., with the exception of navigation.
Sleepiness and fatigue
The share of fatigue as a causal factor in crashes is especially challenging to detect. According to the Austrian Statistics Bureau and based on police assessment, in 2014, 1.5% of all injury crashes and 3.1% of all road fatalities were caused by drowsiness in drivers. The real figures may be significantly higher.
Seat belts and helmets
Seat belt wearing has been compulsory in Austria since 1984 in front seats and from 1990 for rear seats. The belt wearing rate on front seats has been steadily increasing and was around 95% in 2014, whereas rear seat belts are still used by only 77% of car occupants.
The use of dedicated child restraint devices has been mandatory in Austria since 1994 for children under 14 years of age or less than 150 cm tall.
The share of fatally injured car occupants that were not using a seat belt has gone down from about 50% in 2000 to 34% in 2014.
% 1990 2000 2012 2013 2014 2015 Front seat General (driver + passenger) 76 89 91 95 93 Driver 74 89 91 95 93 Passenger 79 90 93 96 94 Urban roads (driver) 63 70 89 91 95 91 Rural roads (driver) 74 75 88 90 95 95 Motorways (driver) 75 78 90 92 95 95 Rear seats Adults 45 75 76 77 78 Children (use of child restraint) 71 94 95 99 97
Table 4.6. Seat belt wearing rate by car occupancy and road type
Helmets are compulsory on all powered two-wheelers. The helmet-wearing rate by riders of powered two-wheelers is not surveyed regularly, but it is believed to be at practically 100%.
Since June 2011, bicycle helmets have been compulsory for children up to 12 years of age.
National road safety strategies and targets
Organisation of road safety
Primary responsibility for road safety in Austria lies with the Federal Ministry for Transport, Innovation and Technology (BMVIT). BMVIT co-operates with the Federal Ministry of the Interior (BM.I) and other government ministries, regional and local authorities, interest groups, chambers of commerce and industry, trade and labour associations and road safety organisations through the Road Safety Programme.
The Road Safety Advisory Council, established at BMVIT, serves as the institutional platform for partners in the Road Safety Programme. It was established in 2006 as the forum for decision makers in matters relating to road safety and, in particular, for the preparation, ongoing evaluation and development of road safety programmes for all modes of transport. Members are transport spokespersons for the parliamentary political parties, representatives of government ministries, local and regional authorities, automobile clubs, chambers of commerce and industry, trade and labour associations, interest groups and research institutions.
The Austrian Road Safety Fund, also established at BMVIT, was set up with the aim of promoting and furthering road safety. The Road Safety Fund is funded with revenues of personalised vehicle number plates. The Road Safety Fund plays a key role in financing road safety related research and activities relating to the Road Safety Programme. Funding priorities are aligned to Road Safety Programme targets.
Road safety strategy for 2011-20
Despite significant progress in the last decade, Austrian road safety figures are still only average compared to the European Union as whole and below average for the EU 15 countries. The Road Safety Programme 2011-2020 aims at "making Austria one of the five safest countries in Europe". It is based on the Safe System approach and has an increased focus on reducing the number of serious injuries on Austrian roads. The Programme features 17 main fields of action.
Road safety targets
- -50% fatalities by 2020, based on the average for the years 2008-10 (Interim target: -25% by 2015)
- -40% serious injuries by 2020, based on the average for the years 2008-10 (Interim target: -20% by 2015)
- -20% injury crashes by 2020, based on the average for the years 2008-10 (Interim targets: -10% by 2015).
The targets are based on the EU fatality reduction target as well as the European Transport Safety Council's proposal for a serious injury reduction target.
Monitoring targets
To ensure the Road Safety Programme is successfully implemented, the Road Safety Advisory Council provides support in all 17 fields of action throughout the duration of the programme. It gathers and analyses available annual crash statistics, behaviour parameters and safety indicators. Based on this information, measures are adjusted as required to accommodate changes in road behaviour and crashes.
The interim fatality target for the year 2015 was reached in 2013 but preliminary figures indicate an increase slightly above target value for 2015.
The Annual Report 2014 by the Federal Ministry for Transport, Innovation and Technology (BMVIT, 2014a) provides the most recent overview of the implementation status of the Road Safety Programme and therefore serves as an ongoing programme evaluation tool.
A mid-term evaluation of the Programme was carried out in 2015 jointly by BMVIT and members of the Road Safety Advisory Council, eventually leading to an updated version of the Programme for the 2016-20 term.
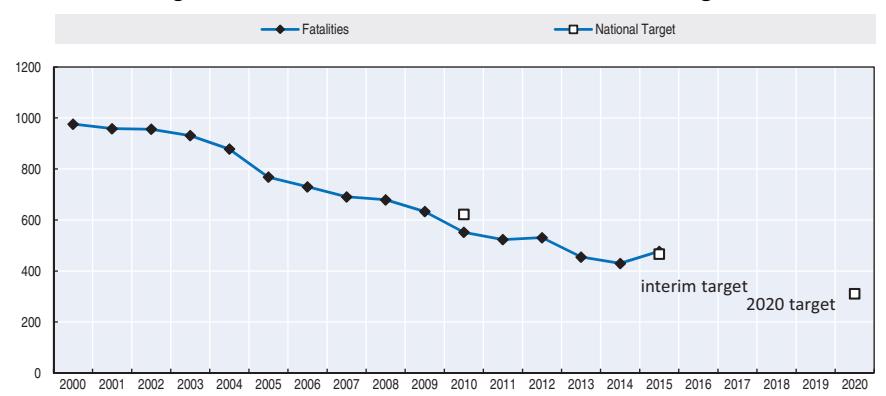
Figure 4.6. Trends in road fatalities towards national target

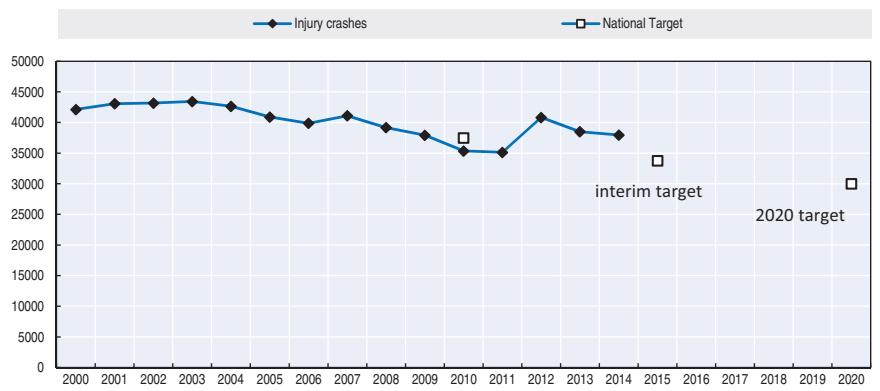
- Crash data acquisition process changed in 2012.
Recent safety measures (2013-16)
Road safety management
- An Austria-wide mobility survey was launched in 2013. This marks the start of regular nationwide mobility surveys.
- A law on a Risk Assessment System for transport companies (implementation of Directive 2006/22/EC) was passed in 2013.
- An updated version of the Austrian Road Safety Programme was published in 2016 (BMVIT 2014b)
Road users
Driving license
- A late starter motorcycle driving licence (for age group 39+) was introduced in 2014, featuring new modules on risk competence and practical handling of heavy bikes.
- A risk competence course for all driving instructors of A-categories was introduced in 2015.
- In the general motorcycle second phase rider training (post-licence, category A), risk identification training and a feedback driving session were introduced in 2013.
Distraction
● A legislative proposal was presented in 2015 with the aim of prohibiting hand-held mobile phone use during driving, now including texting, dialling, social media etc., with the exception of navigation.
Driving under the influence
● A maximum BAC level of 0.1 g/l for non-commercial school transport will be introduced (legislative proposal presented in 2015).
Protective equipment for motorcyclists
● The Supreme Court ruled that motorcycle riders not wearing appropriate protective clothing (in addition to a safety helmet) will not receive full compensation in case of an accident.
Infrastructure
- In 2014, trucks > 7.5 t were banned from using fast lanes on motorways with three or more lanes.
- The Encounter Zone ("Begegnungszone") was introduced into the Highway Code in 2013, with a speed limit of 20 km/h. All traffic is allowed on the carriageway, including walking and roller-skating.
- Cycle Roads ("Fahrradstraße") were introduced into the Highway Code in 2013. On these roads, powered vehicles have restricted access.
- Flexibility in the compulsory use of cycling paths was introduced in 2013. Authorities are now entitled to decide whether a specific cycling path is to be used by cyclists voluntarily or mandatorily.
Vehicles
- Winter tyres are obligatory for four-wheeled light vehicles ("Microcars") since 2013.
- An Austria-wide database on vehicle roadworthiness certificates has been established.
Recent and ongoing research
The Austrian Road Safety Fund (RSF) has been issuing thematic calls for tenders since 2010. The respective themes are defined by BMVIT in line with Road Safety Programme goals and current accident trends. For all RSF projects, reports are available on the BMVIT website (in German, with English abstracts). Some examples are listed here:
- Mobilitätsverhalten und Unfallgeschehen von Kindern auf Schul- und Freizeitwegen (children's modal choice and accidents on their school and leisure time trips) www.bmvit.gv.at/ bmvit/verkehr/strasse/sicherheit/fonds/vsf/46\_mukis.html.
- Handbuch zur Durchführung von RSI (Road Safety Inspection Handbook) www.bmvit.gv.at/ bmvit/verkehr/strasse/sicherheit/fonds/vsf/38\_ris.html.
- Highlight: Wahrnehmbarkeitssteigerung im Straßenverkehr (Improving perceptibility through adequate road lighting) www.bmvit.gv.at/bmvit/verkehr/strasse/sicherheit/fonds/vsf/39\_ highlight.html.
- Überprüfung und Verbesserung der Verkehrssicherheit im Schulumfeld (Safety assessment and improvement around schools) www.bmvit.gv.at/bmvit/verkehr/strasse/sicherheit/fonds/vsf/ 41\_schulumfeld.html.
- Optimierte Anordnung von Rumpelmarkierungen unter Berücksichtigung von Lärmemission mit Beurteilung der Sicherheitswirkung (Use of rumble strips taking account of noise emissions and assessment of safety impacts) www.bmvit.gv.at/bmvit/verkehr/strasse/sicherheit/fonds/ vsf/43\_rumpelmarkierungen.html.
- Optimaler Schutz vor Kopfverletzungen durch verbesserte Testmethoden von Kinder-Fahrradhelmen (Better prevention of head injuries through improved test methods for cycle helmets for children) www.bmvit.gv.at/bmvit/verkehr/strasse/sicherheit/fonds/vsf/44\_clevererhelm.html.
References
BMVIT (2014a), Road Safety in Austria – Annual Report 2014, Federal Ministry for Transport, Innovation and Technology, Vienna, www.bmvit.gv.at/bmvit/en/service/publications/transport/downloads/ roadsafety\_report2014.pdf.
BMVIT (2014b), Austrian Road Safety Programme 2011-2020, updated version for 2016-2020, Federal Ministry for Transport, Innovation and Technology, Vienna, www.bmvit.gv.at/bmvit/en/verkehr/ roads/safety/publications/index.html.
Herry, M. et al. (2013), Studie im Auftrag des VSF/bmvit: Unfallkostenrechnung Straße 2012 unter Berücksichtigung des menschlichen Leids, Federal Ministry for Transport, Innovation and Technology, Vienna.
Websites
- Austrian Ministry for Transport, Innovation and Technology : www.bmvit.gv.at.
- Austrian Road Safety Board (KFV): www.kfv.at.
- Statistik Austria: www.statistik.at/web\_en/statistics/transport/road/road\_traffic\_accidents/index.html.
- Information site on child safety in cars: www.autokindersitz.at/content/index.php.
- Automobile, Motorcycle and Bicyclists Club Austria: www.arboe.at.
- Austrian Automobile, Motorcycle and Touring Club: www.oeamtc.at.
Chapter 5
Belgium
This chapter presents 2014 road safety data for Belgium along with provisional data from 2015. It looks at trends in traffic and road safety from the years 1990 to 2014 and road user behaviour patterns. This includes the results of Belgium's recent work on speed management, as well as data on drink driving, drugs and driving, distracted driving, fatigue and seat belt and helmet use. The chapter reviews Belgium's road safety strategy and national targets to 2020 and the progress achieved thus far. It also highlights the most recently implemented safety measuress.*
* All data stem from the Belgian Road Safety Institute (BRSI) and IRTAD unless otherwise noted. For more information please contact: heike.martensen@bivv.be.
Belgium, with its population of 11.2 million inhabitants and a road network of approximately 118 000 km, saw impressive reductions from 2011 to 2013 in the number of road fatalities and injury crashes. However, this figure levelled off in 2014 and provisional data from 2015 show an increase of 4.7% in road fatalities.
Road safety data collection
Definitions applied in Belgium
- Road fatality: A person who died immediately or within 30 days of a crash
- Seriously injured: A person who stays for treatment for more than 24 hours in a hospital following the crash – as reported by police.
Data collection
Road safety data are electronically collected and centralised by the police force. After some validation procedures, data are transferred to the National Statistics Office. The National Statistics Office carries out some corrections and adds the fatalities occurring within 30 days to the database. This latter operation is done by linking the notification of death (a paper form with very basic information) that is sent by the Department of Justice to the National Statistical Office.
The number of slightly and seriously injured persons is the most likely to be underreported, as many crashes, especially with cyclists and motorcyclists, are not reported to the police. Since 2015 a new procedure is under development to take hospital data into account. This will result in correction for underreporting and an estimation of the numbers of victims with injuries of a Medical Abbreviated Injury Score of 3 and above (MAIS3+). The results are, however, still too preliminary and the data in this report are not corrected for underreporting in police records.
In 2014 the road safety database in Belgium was modified. The database now contains both injury crashes recorded by the police at the scene of the accident and injury crashes self-reported at a police station. The quality of the database has also improved thanks to changes in the data processing method, which notably allow for better identification of user types and of characteristics of individuals and vehicles. The database is therefore more comprehensive. However, it also means that statistics from 2014 onwards are not fully comparable with those of previous years. Also, there is an increase in the number of "unknown" in many variables. Comparisons with previous years should therefore be made with caution.
Most recent safety data
Road crashes in 2015 – provisional data
The preliminary results for the year 2015 showed an unfavourable evolution of road safety in Belgium. With 627 killed on the spot in 2015 there is a significant increase in the number of fatalities (+4.7%) compared to 2014. The total number of fatalities at 30 days is estimated at 755 for 2015, against 727 in 2014. The number of injury crashes for the same period has decreased by almost 3%, matched by a reduction in the number of injured persons by more than 2.5%.
The increase in the number of fatalities was only observed in the regions of Wallonia (+14.6%) and Brussels (+23.5%). In Flanders there was a decrease (-4.0%). The increase of fatalities happened mainly during the third quarter, in particular during the summer holidays (July and August).
There is not, as yet, any precise reason explaining the increase in mortality. It is worthwhile studying why it is related to a specific region of the country during a well delimited period, without any increase in the number of crashes.
Road crashes in 2014
After two years of impressive reductions in the number of fatalities (-6% between 2012 and 2013 and -11% between 2011 and 2012), in 2014 this number stagnated at the 2013 level. There were no improvements in the injury crashes (+ 0.5%), compared to 2013. However, the number of seriously injured persons (who stayed in hospital for more than 24 hours) was reduced by 9% for the same period.
Overall, the results were much better in the second half of the year, while lack of progress during the first quarter can be partly explained by weather conditions favourable to driving. Belgium experienced a mild winter at the beginning of 2014, with just one day of snow.
Trends in traffic and road safety (1990-2014)
Traffic
Since 1990, the distance travelled by motorised road users has increased by more than 45%. In the same period, the number of vehicles has increased by 54%. After a stagnation in vehicle-kilometres between 2007 and 2010, vehicle-kilometres began increasing annually again during 2011-13.
Road safety
Crashes and casualties
Between 1990 and 2014, the number of fatalities decreased by more than 60%, the number of seriously injured persons (as registered by the police) by almost 75% and the number of injury crashes by more than 30%. The biggest share of these improvements, however, fell on the period after 2000.
Around the time of the millennium change, road safety became an issue of great public interest in Belgium. While the number of fatalities had been stagnating or had even increased in the late 1990s, this number has steadily declined since 2001, the year in which the first national assembly on road safety (Etats Généraux de la Sécurité Routière/Staten-Generaal van de Verkeersveiligheid) initiated many improvements in infrastructure, enforcement and education. The reduction in the number of fatalities in the years following this event is even more striking, because between 2001 and 2004 the registration of crashes was revised and strongly improved, which would normally lead to an increase in registered fatalities. The decline has been relatively steady since, with small variations that are probably due to the economic situation (decrease in 2008) or meteorological variations (2010-11, 2014).
The most important measures to have contributed to the decline of mortality in Belgium are:
- reduction of speed limit on many rural roads
- stricter control of speed limits
- black-spot treatment and adjustment of the infrastructure
- improved safety systems in cars and trucks
- better road safety awareness through campaigns and educational measures
Rates
Between 1990 and 2014, the road traffic mortality rate, expressed in terms of deaths per 100 000 inhabitants decreased by more than 65%, and risks expressed in deaths per number of vehicles decreased by almost 80%.
Table 5.1. Road safety and traffic data
| 2014 % change from | |||||||||
|---|---|---|---|---|---|---|---|---|---|
| 1990 | 2000 | 2010 | 2013 | 2014 | 2013 | 2010 | 2000 | 1990 | |
| Reported safety data* | |||||||||
| Fatalities | 1 976 | 1 470 | 840 | 724 | 727 | 0.4 | -13.5 | -50.5 | -63.2 |
| Injury crashes | 62 446 | 49 065 | 45 927 | 41 279 | 41 481 | 0.5 | -9.7 | -15.5 | -33.6 |
| Injured persons hospitalised 1 | 17 479 | 9 847 | 5 984 | 4 947 | 4 502 | -9.0 | -24.8 | -54.3 | -74.2 |
| Deaths per 100 000 inhabitants | 19.9 | 14.4 | 7.7 | 6.5 | 6.5 | 0.0 | -16.3 | -54.8 | -67.3 |
| Deaths per 10 000 registered vehicles | 4.3 | 2.6 | 1.3 | 1.0 | 1.0 | 0.8 | -22.5 | -62.0 | -77.4 |
| Deaths per billion vehicle kilometres | 28.1 | 16.3 | 8.5 | 7.1 | na | ||||
| Traffic data | |||||||||
| Registered vehicles2 (thousands) | 4 594 | 5 735 | 6 689 | 6 994 | 7 076 | 1.2 | 5.8 | 23.4 | 54.0 |
| Vehicle kilometres (millions) | 70 276 | 90 036 | 98 678 | 102 423 | na | ||||
| Registered vehicles per 1 000 inhabitants | 462 | 560 | 617 | 627 | 632 | 0.8 | 2.4 | 12.8 | 36.8 |
* The data collection system changed in 2014; statistics from 2014 onwards are not fully comparable with those of previous years.
1 2 http://dx.doi.org/10.1787/888933385366
Road safety by user group
All user groups, and especially pedestrians, cyclists, moped users and passenger car occupants have benefited from safety improvements since 1990.
While the number of fatalities for car occupants, pedestrians, moped riders and cyclists have shown a more or less regular decline in the last two decades (from 60% to 85%), fatalities among motorcyclists, and truck and van occupants have shown only a relatively small decrease (20%).
In the last five years (from 2010) there was an average decrease of 13.5% in road fatalities. However, while fatalities for passenger cars, motorcycles and mopeds show improvements, the pedestrian fatalities have not declined and the number of cyclists killed has increased. This probably results from an increase in walking and cycling. The ageing of the population may also play a role.
The collection process changed in 2014 and there is a break in the data. This should not be interpreted in terms of road safety developments.
1. The number of injured persons hospitalised is subject to underreporting.
2. Registered vehicles excluding mopeds.
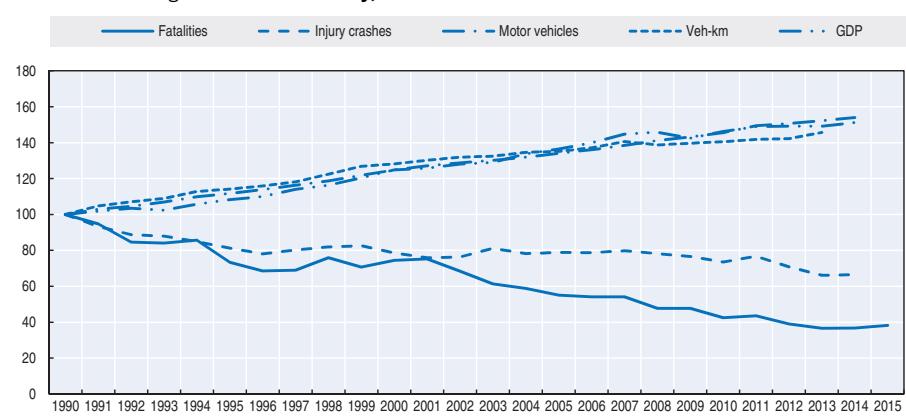
Figure 5.1. Road safety, traffic and GDP trends index 1990 = 100
Source: World Bank for Gross Domestic Product (GDP; constant prices).
Table 5.2. Road fatalities by road user group
| 2014 % change from | |||||||||
|---|---|---|---|---|---|---|---|---|---|
| 1990 | 2000 | 2010 | 2013 | 2014 | 2013 | 2010 | 2000 | 1990 | |
| Cyclists | 196 | 134 | 70 | 73 | 76 | 4.1 | 8.6 | -43.3 | -61.2 |
| Moped users | 110 | 64 | 22 | 13 | 17 | 30.8 | -22.7 | -73.4 | -84.5 |
| Motorcyclists | 106 | 118 | 102 | 102 | 85 | -16.7 | -16.7 | -28.0 | -19.8 |
| Passenger car occupants | 1 181 | 922 | 444 | 342 | 381 | 11.4 | -14.2 | -58.7 | -67.7 |
| Pedestrians | 301 | 142 | 106 | 99 | 106 | 7.1 | 0.0 | -25.4 | -64.8 |
| Others | 82 | 90 | 96 | 95 | 62 | -34.7 | -35.4 | -31.1 | -24.4 |
| Total | 1 976 | 1 470 | 840 | 724 | 727 | 0.4 | -13.5 | -50.5 | -63.2 |
Figure 5.2. Road fatalities by road user group in percentage of total 2014
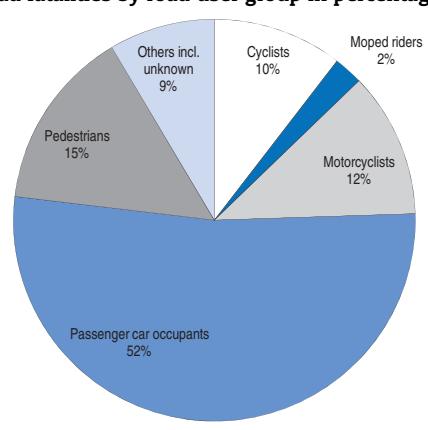
Road safety by age group
Since 1990, the reduction in fatalities has benefited all age groups, but the most impressive reduction concerns children aged 0 to 14 years (by almost 90%). Despite substantial reductions, young people aged 18-24 are still a high-risk group, with a fatality rate nearly twice as high as that of the general population.
Since 2000, the situation has improved for all age groups, except for people aged 65 and above.
The analysis of developments since 2010 mainly shows an improvement in youth mortality.
| 2014 % change from | |||||||||
|---|---|---|---|---|---|---|---|---|---|
| Age | 1990 | 2000 | 2010 | 2013 | 2014 | 2013 | 2010 | 2000 | 1990 |
| 0-5 | 33 | 17 | 8 | 5 | 1 | Figures too small | -94.1 | -97.0 | |
| 6-9 | 27 | 12 | 6 | 4 | 4 | for meaningful | -66.7 | -85.2 | |
| 10-14 | 48 | 23 | 9 | 9 | 5 | comparison | -78.3 | -89.6 | |
| 15-17 | 72 | 55 | 21 | 8 | 22 | 175.0 | 4.8 | -60.0 | -69.4 |
| 18-20 | 202 | 130 | 64 | 52 | 37 | -28.8 | -42.2 | -71.5 | -81.7 |
| 21-24 | 245 | 198 | 107 | 67 | 80 | 19.4 | -25.2 | -59.6 | -67.3 |
| 25-64 | 992 | 784 | 467 | 427 | 392 | -8.2 | -16.1 | -50.0 | -60.5 |
| 65 | 334 | 238 | 153 | 151 | 178 | 17.9 | 16.3 | -25.2 | -46.7 |
| Total | 1 976 | 1 470 | 840 | 724 | 727 | 0.4 | -13.5 | -50.5 | -63.2 |
Table 5.3. Road fatalities by age group
Note: The data collection system changed in 2014; statistics from 2014 onwards are not fully comparable with those of previous years.
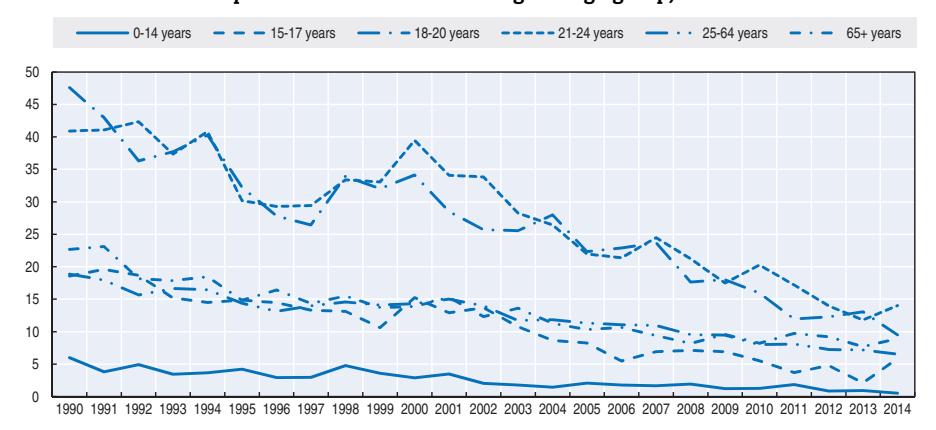
Figure 5.3. Road fatality rates by age group Deaths per 100 000 inhabitants in a given age group, 1990-2014
Road safety by road type
In 2014, more than one-third (37%) of fatalities occurred on rural roads, 26% in urban areas and 13% on motorways. For 24% of the fatalities the road type is unknown. Since
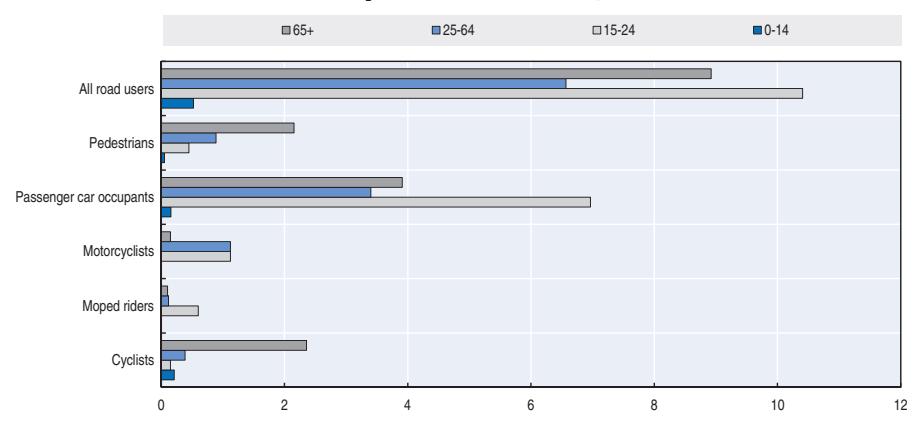
Figure 5.4. Road fatality rate by age and road user group Fatalities per 100 000 inhabitants, 2014
1991, the greatest reduction in fatalities has occurred on rural roads (-74%), with almost equal reduction in fatalities inside urban areas (-70%). Improvement on motorways was more moderate (-58.4%).
Due to a strong increase of fatality locations rated as "unknown" the figures from 2014 are not comparable to the ones in earlier years.
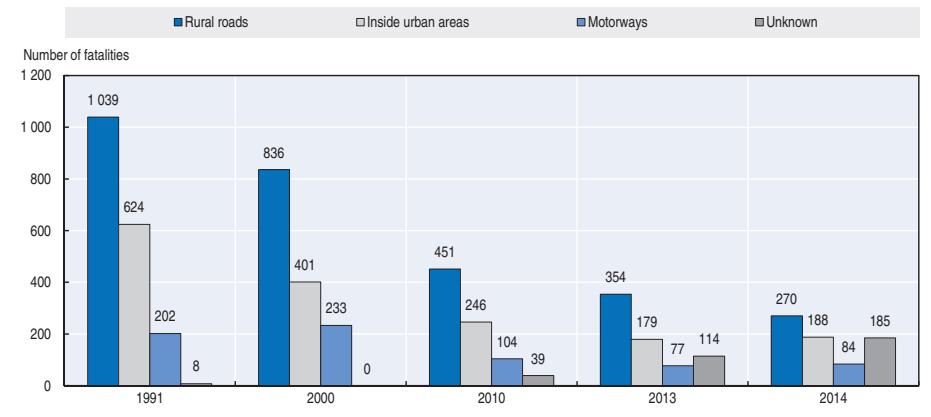
Figure 5.5. Road fatalities by road type
Note: The data collection system changed in 2014; statistics from 2014 onwards are not fully comparable with those of previous years.
Economic cost of traffic crashes
In Belgium there is no recent information on the costs of crashes. The most recently published estimate is based on 2002 crash data (de Brabander and Vereeck, 2007). Taking willingness-to-pay into account, the authors state "the total costs of road crashes in 2002 are valued at EUR 7.2 billion (2004 prices)".
Recent trends in road user behaviour
Speed
Since 2003, the Belgian Road Safety Institute (BRSI) regularly measures the average speed on Belgian roads: the latest available data collected is from 2012.
For 2012, as for previous years, the average speed of drivers not restricted by traffic conditions was higher than the maximum allowed speed on all types of roads except those with a 90 km/h limit and with one lane in each direction and motorways. The biggest difference between the average speed and the speed limit was found on roads in built-up areas, with an average speed of 52.5 km/h when the speed limit is 50 km/h roads. In addition, there has been no reduction for several years in speed on these 50 km/h roads, where 56% of drivers exceed the speed limit and 15% drive at over 61 km/h.
Since 2010, a positive change was observed in the average speed on 70 km/h roads, which is confirmed in the measurements for 2012. Nevertheless, the average speed is still 71.9 km/h and above the speed limit. More than 50% of people drive over the maximum allowed speed and 15% drive at over 83 km/h. A similar change was recorded on 90 km/h roads. But, even if the average speed recorded is 82.1 km/h, 27% of people still drive over the speed limit and 15% drive at over 94 km/h.
The 30 km/h zones around schools where there are no speed deterrents show the most dramatic picture. When the infrastructure is not at all designed to ensure that people respect the speed limit, 91% of drivers exceed it, with 65% of them driving at over 40 km/h. However, there is a positive change on these roads with a constant reduction in speed since 2007.
In 2011, for the first time, BRSI also measured the speed on motorways. The average speed of cars outside congestion periods is 117.9 km/h, slightly under the speed limit of 120 km/h. The average speed is similar on two- and three-lane motorways.
The table below summarises the main speed limits in Belgium.
Table 5.4. Passenger car speed limits by road type, 2016
| General speed limit | |
|---|---|
| Urban roads | 30/50 km/h |
| Rural roads | 70/90 km/h |
| Motorways | 120 km/h |
Drink driving
In Belgium, the maximum authorised blood alcohol content is 0.5 g/l. Since January 2015 the limit for professional drivers is 0.2 g/l.
An alcohol-related crash is defined as a crash involving a driver or a pedestrian who was subjected to a test and either refused to be tested or had a blood alcohol concentration of 0.5 g/l or higher. In 2013, 65% of the drivers involved in crashes were subjected to tests, and 10.5% were either positive or refused to be tested.
In 2015, 2.7% of the car drivers tested had a blood alcohol level above the legal limit (0.22 mg of alcohol per litre of exhaled alveolar air or 0.5 g of alcohol per litre of blood).
This figure of 2.7% is the same as that observed in 2009 and 2012 and is significantly higher than the results obtained in 2007 (2.0%). Furthermore, the share of highly intoxicated drivers (more than 0.35 mg or more than 0.8 g/litre of blood) among offenders has also increased (from 55% in 2007 to 69% in 2015). Half of the offenders had a blood alcohol level of nearly 1 g/litre of blood. This 6th edition of the behavioural measurement highlights an alarming upward trend of driving under the influence of alcohol on Belgian roads (Focant, 2016).
Drugs and driving
In Belgium legislation sets limits for driving under the influence of THC or cannabis (1 ng/ml), amphetamines (25 ng/ml), MDMA or ecstasy (25 ng/ml), morphine (10 ng/ml) and cocaine (25 ng/ml).
Drivers suspected of being impaired are tested for drugs. They can also be tested if the driver transports drugs, admits having taken drugs or is involved in a crash.
The European research project, "Driving Under the Influence of Drugs, Alcohol and Medicines" (DRUID), found for the sample in Belgium that 0.5% of all drivers drove under the influence of cannabis, 0.4% under the influence of cocaine and 0.2% under the influence of heroin. No trace of amphetamines ("speed" and/or "ecstasy") was found among the population of examined Belgian drivers.
Distraction
The use of hand-held phones while driving is forbidden. The use of hands-free devices while driving is authorised. In a 2013 roadside survey, 2% of drivers were talking on the phone without a hands-free kit. Another 1.2% held the phone in their hand. Drivers of vans and trucks were significantly more often observed with hand-held devices than car drivers. Overall it was estimated that at any time 4% of drivers are using a hands-free or hand-held phone (Riguelle and Roynard, 2014).
Sleepiness and fatigue
The results of a survey study (Diependaele, 2015) show that 4.8% of the journeys by car drivers in Belgium involve a driver who is showing signs of sleepiness. The analysis of contextual variables shows that various circumstances result in a prevalence that is considerably higher than the overall estimate of 4.8%.
Seat belts and helmets
Seat belt use has been compulsory in front seats since 1975 and in rear seats since 1991. In 2015, the rate of seat belt use was 92% for drivers and front seat passengers in passenger cars. For back-seat passengers it is however much lower at 86%. Clear progress in seat belt usage occurred between 2003 and 2015. However, the 2010 target of 95% seat belt usage has still not been met.
Since 2006, the Belgian traffic decree specifies that passengers under 18 and smaller than 135 cm must travel in an adapted child restraint device. They can travel either in the front or rear seat if the child restraint system conforms to the latest European standards. There are exceptions to the main rule (Traffic Code, 2012).
The road-side survey in 2014 showed that only one out of three children (35%) is correctly restrained (i.e. with the appropriate system and without misuse). Among the drivers who agree to have their child seat use investigated, 11% had not fastened their child at all – and even worse, this share is estimated at 19% for the general driver population (Roynard, 2015). In 2012, the percentage of children in the study sample that had not been fastened at all was at 10%, almost identical to the 2014 result (all other results are difficult to compare because of methodological changes). We have to conclude that in spite of serious efforts (campaigns, increased number of police checks and fines) there has been no improvement since 2012.
Table 5.5. Seat belt wearing rate by car occupancy and road type
| % | |||
|---|---|---|---|
| 2000 | 2012 | 2015 | |
| Front seat | |||
| Driver | 91.5 | ||
| Passenger | 85 | 92.2 | |
| Urban roads (driver) | 50 | 86 | |
| Rural roads (driver) | 57 | 86 | |
| Motorways (driver) | 66 | 90 | |
| Rear seats | |||
| General | 63 | 85.5 | |
| Children (use of child restraint) | 35/891 |
1. In 2014, among drivers who agree to have the child seat use investigated, 89% of the children are somehow restrained, but only 35% correctly so (right system and correct use) (Roynard, 2015).
All riders of motorised two-wheelers are required to wear helmets. Motorcyclists (> 50 cc) also have to wear gloves, boots that protect the ankle and long sleeved/legged jacket and trousers. The helmet-wearing rate by riders of motorised two-wheelers is not systematically monitored for the whole country. In Brussels, the observed rate was 99.3% in 2013 (Riguelle and Roynard, 2013).
There is no mandatory helmet-use law for cyclists.
National road safety strategies and targets
Organisation of road safety
In 2015, several public responsibilities in relation to road safety shifted from the federal government to the regional ones. The federal level has kept a few remaining competencies, in particular the traffic regulation (although speed limits on regional roads are a regional matter), vehicle safety regulation, licensing (although the drivers' training is now a regional matter) and most of the enforcement chain. All other road safety matters (infrastructure, education, campaigns, training, local police controls) are now determined at the regional level.
At the federal level, the Federal Commission for Road Safety is responsible for setting out the road safety plan. Under the leadership of the Belgian Road Safety Institute, it brings together national and regional government representatives, representatives of the different groups of road users and other non-government organizations, police and justice representatives and organises the General Assembly on Road Safety where the Belgian Road Safety Programme, including the target for 2020 was decided in 2011. At the last Assembly in December 2015 progress in road safety was analysed in detail with recommendations for future actions. In the future, the role of the federal commission is
likely to change and will be taken over by a new foundation bringing together federal and regional stakeholders.
For the Flemish region, the Vlaams Huis voor de Verkeersveiligheid is working on a road safety plan for Flanders. For Wallonia, the Conseil Supérieur Wallon de la Sécurité Routière (CSWSR) has taken over this responsibility under the leadership of the Agence wallonne pour la Sécurité routière (AWSR). For the Brussels region it is not yet clear which agency will take the lead in Road Safety.
Road safety strategy for 2011-2020
The present road safety strategy was released in 2011. The mission from the decade before, to achieve a 50% decrease in fatalities between 2001 and 2011, was renewed for the period 2011-20.
Road safety targets
The European target of halving fatalities by 2020 was adopted, meaning fewer than 420 road fatalities. Forecasting based on past development predicts a number higher than 500 fatalities for 2020. Therefore, additional efforts and measures will be required to achieve the target.
Monitoring targets
Regular monitoring of road safety performance is being undertaken. The results are taken into account by policy makers at the federal and regional levels, but there is no explicit structure for how these are used to define the road safety strategy.
- Monitoring output:
- ❖ A road safety barometer is published four times a year containing the most recent number of fatalities (excluding those who did not die at the scene). Publication lag is about two months.
- ❖ A full statistical report based on all police-registered injury accidents is published yearly. Publication lag is 18-24 months.
- Representative safety performance measures:
- ❖ roadside surveys every three years of driving under the influence of alcohol, speed and seat belt use
- ❖ annual survey of national opinions on road safety
- ❖ survey of road safety attitudes, acceptance of measures and self-reported behaviour.
Midterm review
In December 2015, during the General Assembly for Road Safety (http://egsr2015.be/ in French or http://sgvv2015.be/ in Dutch) the progress midway to the 2020 target was evaluated. Next to the development of road-safety outcomes, the progress was also evaluated in terms of the development of speed, seat belt use, and drink driving.
On the basis of the development of the fatality numbers so far, it is estimated that in 2020 the number of fatalities will lie between 475 and 780. With the present efforts we will therefore not reach the target in 2020 (420). To change this trend, the federal minister for mobility announced the following actions:
● better coordination of road safety efforts in Belgium
- regulation of electrical bikes use
- simplifying traffic rules
- a BAC of 0% for young drivers
- introducing new (quicker) testing devices for drugs
- strategical action plan for better co-ordinated traffic controls
- legal implementation of cross border prosecution
- improving the link between registered offenses and actually paid fines
- legalising the use of APNR camera's for automatic license plate recognition
- improvement of database for offenders
- mandatory fitting of alcolocks in vehicles for person transport
- review of rules for application of alcolocks for recidivists
- alternative punishments have to be paid by offenders
- enabling in-depth accident studies in Belgium (access to accident scenes)
- mandatory installation of event data recorder
- code of practice for testing (semi)automatic vehicles on public roads
Sustainability and inclusiveness figure importantly in the mobility plans in all 3 Regions. There is, however, no specific reference to the sustainable development goals of the United Nations and neither in Flanders nor in Wallonia attention to UN city specific goals.
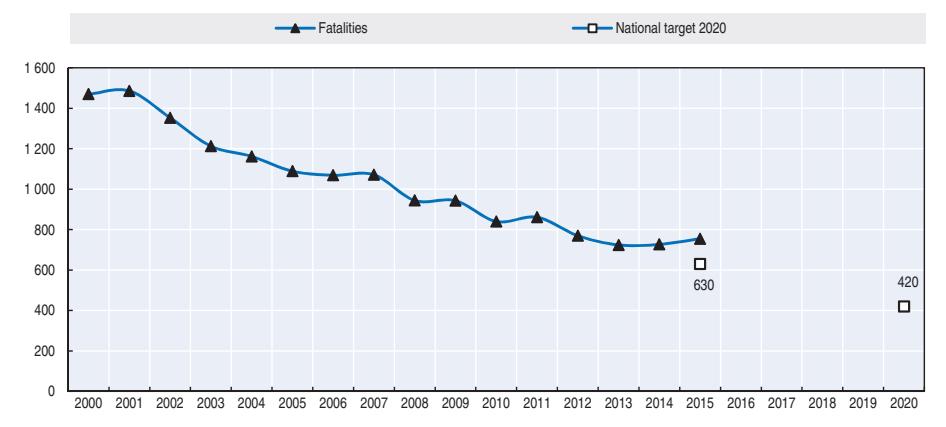
Figure 5.6. Trends in road fatalities towards national target
Recent safety measures (2013-16)
Road safety management
● Sixth state reform, shifting some responsibilities from national to regional governments, was approved on 1 January 2015. These responsibilities include, amongst others, infrastructure management and driving education.
- Foundation of regional road safety funds: Federal, Flanders, Wallonia and Brussels.
- Road pricing for trucks entered into force on 1 April 2016 (not a dedicated road safety measure – for details see www.viapass.be/en/about-viapass/viapass-for-hgvs/).
Road users
Driving license
● The driving licence for motorcyclists was reformed in May 2013.
Speed management
- Belgium's first speed camera system to control average speed on a section of highway was put into operation in June 2012, and three more sections were added in March 2013. A nine-month evaluation of one of those showed a reduction of the mean speed by 5 km/h. Speed violations were reduced by 71% and severe violations (> 10 km/h) by 85%. The number of crashes was reduced by 26% (De Pauw et al., 2014). Four more sections were added in 2014 and 2015. More than 20 additional sections are planned for the next years.
- Flanders has decided to lower the general speed limit outside built-up areas from 90 to 70 km/h, as of January 1st 2017. Since most of these roads are already limited to 70 km/h by traffic signs, it will eventually lead to a reduction in the number of road signs. Moreover, as of 2017 local decision makers will need to justify when they wish to allow a speed higher than 70 km, while so far they have to give reasons for not allowing 90 km/h. This also means that the default speed limits will not be the same all over Belgium but will change at regionals border.
- Since 2015, the speed limit on roads restricted to pedestrians, cyclists, horse-riders and agricultural vehicles is 30 km/h instead of the general speed limit on that area.
Driving under the influence of alcohol
- Since January 2015, the maximum legal alcohol limit for professional drivers is 0.2 g/l, while 0.5 g/l remains the maximum level for other drivers.
- Since December 2015, a new executive decree under the road traffic law went into force. It offers additional tools and quicker ways to determine psychoactive substances in blood and saliva.
Seat belt and helmet use
● More severe penalties were introduced in March 2013 for non-wearing of seat belts or non-use of child restraint systems. In 2014, no effect on child restraint rates was seen. The rate of belted passengers has however, increased from 86% in 2012 to 92% in 2015.
Fines and vehicle immobilisation
- Since July 2013, customs officials are allowed to immobilise a vehicle in case of outstanding traffic fines.
- Since January 2013 non paid police fines for certain traffic offences will be settled more quickly with an order for payment by the prosecutor. If this order is not paid, the amount can be claimed by the Ministry of Finance.
Education and awareness
● Road safety campaigns have been and will be regularly conducted, targeting drink driving, speeding, more respectful attitude towards the other road users, seat belt use and young drivers. There are separate campaigns for the three regions.
Infrastructure
- Since March 2014, at some intersections, cyclists are allowed to turn right on red. A survey study amongst cyclists suggests that there might be a "spill-over effect" leading cyclists to ignore the red light at other crossings as well (De Ceuninck et al., 2016).
- Since March 2014, alternate merging is mandatory in case of congestion. This is actually not a road safety measure but a road capacity measure.
Vehicles
- Since November 2013, the insurance policies of all vehicles registered in Belgium are checked during the technical inspection to reduce the number of uninsured vehicles.
- A two-yearly periodical vehicle inspection is introduced for agricultural vehicles with a maximum authorised mass (MAM) higher than 3.5 tonnes and lower than 7.5 tonnes. A yearly periodical vehicle inspection is introduced for agricultural vehicles with a MAM higher than 7.5 tonnes.
- Registration of mopeds is now mandatory. Owners of mopeds already in use must register their moped before December 2016.
Recent and ongoing research
Some ongoing research projects:
- In-depth analyses of crashes with heavy goods vehicles (BRSI)
- MONITOR: Mobility tracker for all modalities with special attention to accidents and incidents (Federal governmental service mobility & BRSI; IMOB; UNamur)
- ESRA: Collecting comparable data in 17 countries on road users' opinions, attitudes and behaviours with respect to road traffic risk (www.esranet.eu)
- INTRAS: Inequality in Traffic Safety Investigating socio-economic differences in crash involvement. (IMOB, BRSI, BelSpo)
- Long term impacts of accidents on the injured victims (BRSI & Université libre de Bruxelles)
Some recent publications by the Belgian Road Safety Institute (BRSI) (these and others can be found on the BRSI website http://ibsr.be/en/road-safety/notre-publications/ :
- Diependaele, K. (2015), Pedestrian compliance with traffic lights: A national roadside survey Belgium;
- Meesmann, U., F. Slootmans, G. Ost and S. Boets (2015), Fit to drive again? The practice of medical and psychological examinations in cases of deprivation of the right to drive;
- Steegmans, D. and E. Dupont (2015), Impact of work related road accidents. Exploratory study on the distribution and impact of work related road accidents;
Slootmans, F. and G. De Schrijver (2014), Fatalities on highways. In-depth analysis of fatal road traffic accidents on Belgian motorways between 2009 and 2013;
Roynard, M., A. Schoeters and M. Wénin (2015), Safe to school. Analysis of road accidents involving children near primary schools and kindergardens.
- Some recent publications by the Institute for Mobility at the University of Hasselt (IMOB):
Polders, E., S. Daniels, E. Hermans, T. Brijs and G. Wets (2015), "Crash Patterns at Signalized Intersections", Transportation Research Record: Journal of the Transportation Research Board, 2514, p. 105-116;
Polders, E., J. Cornu, T. De Ceunynck, S. Daniels, K. Brijs, T. Brijs, E. Hermans and G. Wets (2015), "Drivers' behavioural responses to combined speed and red light cameras". Accident Analysis & Prevention, 81, 153-166;
Ross, V., E. Jongen, T. Brijs, K. Brijs, R.A. Ruiter and G. Wets (2015), "The relation between cognitive control and risky driving in young novice drivers", Applied Neuropsychology – Adult, 22 (1), p. 61-72;
Wilmots, B., E. Hermans, T. Brijs and G. Wets (2016), "Speed control with and without advanced warning sign on the field: an analysis of the effect on driving speed", Safety Science, 85, p. 23-32.
References
- De Brabander, B. and L. Vereeck (2007), "Valuing the prevention of road accidents in Belgium", Transport reviews, 27(6). pp. 715-732.
- De Pauw, E., S. Daniels, T. Brijs, E. Hermans and G. Wets (2014), "Automated section speed control on motorways: An evaluation of the effect on driving speed", Accident Analysis & Prevention, 73, 313-322.
- Diependaele K. (2015), Sleepy at the wheel. Analysis of the extent and characteristics of sleepiness among Belgian car drivers, Belgian Road Safety Institute – Knowledge Centre Road Safety.
- Focant N. (2016), Drinking and driving … Do we do it too much? National behavioural survey "Driving under the influence of alcohol", Belgian Road Safety Institute – Knowledge Centre Road Safety, Brussels, Belgium.
- Lequeux, Q. (2016), National roadside survey of seatbelt use in Belgium 2015, Belgian Road Safety Institute Knowledge Centre Road Safety, Brussels, Belgium.
- Riguelle, F. and M. Roynard (2014), Conduire sans les mains. Utilisation du GSM et d'autres objets pendant la conduite sur le réseau routier belge, Belgian Road Safety Institute – Knowledge Centre Road Safety, Brussels, Belgium.
- Riguelle, F. and M. Roynard (2013), Mesure de comportement équipements individuels de protection motards en Région de Bruxelles-Capitale – 2013, Belgian Road Safety Institute – Knowledge Centre Road Safety, Brussels, Belgium.
- Roynard, M. (2015), Are children transported safely? National behavioural survey on the use of child restraint systems 2014. Brussels, Belgium: Belgian Road Safety Institute – Knowledge Centre Road Safety.
- Roynard, M. et al. (2014), "National roadside survey of child restraint system use in Belgium", Accident Analysis and Prevention, Volume 62, January 2014, Elsevier.
Websites
- BRSI-BIVV-IBSR (Belgian Road Safety Institute): http://ibsr.be/fr (French); http://ibsr.be/nl/ (Dutch); http://ibsr.be/en/ (English).
- BRSI-BIVV-IBSR research and statistical reports: www.ibsr.be/fr/securite-routiere/publications/ (French); http://ibsr.be/nl/verkeersveiligheid/onze-publicaties/ (Dutch); http://ibsr.be/en/road-safety/notre-publications/ (English).
Belgian Road Safety barometer: http://ibsr.be/fr/securite-routiere/barometre-de-la-securite-routiere/ (French); http://ibsr.be/nl/verkeersveiligheid/verkeersveiligheidsbarometer/ (Dutch); http://ibsr.be/en/road-safety/ road-safety-monitoring-survey/ (English).
Vlaams Huis voor de Verkeersveiligheid: www.vlaamshuisvoorverkeersveiligheid.be.
Conseil supérieur wallon de la sécurité routière: www.cswsr.be.
Agence wallonne pour la Sécurité routière: www.awsr.be.
Instituut voor Mobiliteit Universiteit Hasselt: www.uhasselt.be/IMOB-EN.
Vlaamse stichting verkeerskunde (Flemish Foundation for Traffic Knowledge): www.vsv.be/nl/home.
Chapter 6
Cambodia
This chapter presents 2014 road safety data for Cambodia along with provisional data from 2015. It looks at recent trends in traffic and road safety as well as road user behaviour patterns, including speed, drink driving and seat belt and helmet use. The chapter also reviews Cambodia's road safety strategy and national targets to 2020.*
* All data stem from National Road Safety Committee unless otherwise noted. The National Road Safety Committee joined the International Road Traffic and Accident Database (IRTAD) group in 2010. Data presented in this report are under validation by IRTAD. Actual numbers are likely to be higher. For more information please contact: voun.chhoun@gmail.com.
Cambodia has seen a marked increase in road crash fatalities since 2010 with a peak of 2 226 in 2014. Provisional data from 2015 show a 1% decrease on this figure. The increase in fatalities needs to be taken in the context of the rapid motorisation of Cambodia. Since 2010 the number of vehicles registered has increased by 70%. This is reflected in rate of fatalities per 10 000 vehicles which dropped from 11.0 in 2010 to 6.9 in 2014. Most of the fatalities are in the motorised two-wheeler user group.
Road safety data collection
Definitions applied in Cambodia
- Road fatality: Person who died immediately as a result of a crash or within 30 days.
- Seriously injured person: Person injured in a traffic crash and hospitalised for at least eight days due to sustained injuries. At this stage, it is not envisaged to adopt a definition based on the Maximum Abbreviated Injury Scale.
Data collection
The Road Crash and Victim Information System (RCVIS) was initiated and developed by Handicap International, in close collaboration with the Ministry of Health, the Ministry of the Interior and the Ministry of Public Works and Transport. Data are reported by traffic police and health facilities nationwide. Currently, the Ministry of Health and the Ministry of the Interior are in charge of data collection at a provincial level and provide a soft copy to the National Road Safety Committee (NRSC).
The NRSC combines data from the Ministry of Health and the Ministry of the Interior using a data-linkage system developed with support from the Institute for Road Safety Research (SWOV) in the Netherlands, in the framework of twinning under the International Road Traffic and Accident Database. Duplicate entries are automatically identified. Work is ongoing to assess the level of underreporting.
Most data are available from 2006. Data presented in this report are data currently reported by the police and are under validation by IRTAD. Actual numbers are likely to be higher.
Most recent safety data
Road crashes in 2015 – provisional data
In 2015, RCVIS reported 2 202 fatalities, a 1% decrease over 2014.
Trends in traffic and road safety (2006-14)
Traffic
Cambodia's motorisation is rapidly increasing. Since 2006, the number of motorised vehicles has tripled. In 2015 alone there was a 14% increase in the number of registered vehicles. Powered two-wheelers account for 80% of the motor vehicle fleet and play an important role in the day to day life of people and in the transport sector.
Road safety
Crashes and casualties
Between 2010 and 2015, the number of fatalities reported by the RCVIS increased by 21%. This dramatic increase is explained by the economic boom, the sharp increase in registered vehicles and the young population, as well as the reconstruction of paved roads over the last five years. Road crashes disproportionately affect the most vulnerable road users (motorcyclists, pedestrians and cyclists).
Traffic crashes have major impacts on both the social economy and welfare of Cambodia and are one of the major causes of mortality. Unless additional road safety actions are taken, the number of fatalities in Cambodia could increase to 3 200 by 2020. Therefore, the Royal Government of Cambodia has committed to developing a national road safety action plan for 2011-20 with the objective of reducing the number of road fatalities by 50% by 2020, from the estimated forecast of 3 200 road deaths to 1 600.
Rates
In 2015, the reported death rate per 100 000 inhabitants was 14.3, a decrease of 2.5% compared to 2014.
From 2010 to 2015, the reported fatalities rate per 10 000 vehicles decreased from 11% to 6.9% as the number of registered vehicles increased rapidly.
2010 2013 2014 2015 2015 % change from 2014 2010 Reported safety data Fatalities 1 816 1 950 2 226 2 202 -1.1 22.6 Injury crashes 18 287 14 277 15 315 11 149 -27.2 -16.3 Deaths per 100 000 inhabitants 12.7 13.0 14.7 14.3 -2.5 15.5 Deaths per 10 000 registered vehicles 11.0 7.9 8.0 6.9 -13.9 -27.4 Traffic data Registered vehicles (thousands) 1 650 2 457 2 801 3 200 14.2 69.8 Registered vehicles per 1 000 inhabitants 115 164 183 205 12.0 59.0
Table 6.1. Road safety and traffic data
Note: Safety data are those currently reported by the police. Actual numbers are likely to be higher. Source: RCVIS.
1 2 http://dx.doi.org/10.1787/888933385370
Road safety by user group
Vulnerable road users (motorcyclists, pedestrians and cyclists) represent more than 80% of traffic casualties in Cambodia. Riders of motorised two-wheelers are the most vulnerable road users. In 2015, they represented 85% of the motorised vehicle fleet and 71% of all fatalities. Improving the safety of motorcyclists is a key priority in Cambodia.
Road safety by age group
In 2015, the 20-24 age group accounted for 21% of total fatalities, while they represented only 11% of the total population. About half of total fatalities are between 15 and 29 years old. In 2015, the 21-24 age group had the highest fatality rate with 31 deaths for 100 000 inhabitants.
The elderly (above 65) are particularly vulnerable as pedestrians.
100 150 200 300 2008 2009 2010 2011 2012 2013 2014 2015 Fatalities Motor vehicles GDP
Figure 6.1. Road safety, traffic and GDP trends index 2008 = 100
Source: RCVIS, World Bank for Gross Domestic Product (GDP; constant prices).
Table 6.2. Reported road fatalities by road user group
| | | | | | 2015 % change over | | | |
|-------------------------|------------------------------|-------|-------|-------|--------------------|-------|-------|--|
| Road users | 2010
2013
2014
2015 | | 2014 | 2013 | 2010 | | | |
| Cyclists | 72 | 45 | 66 | 53 | -20 | 17.8 | -26.4 | |
| Motorcyclists | 1 209 | 1 351 | 1 614 | 1 566 | -3 | 15.9 | 29.5 | |
| Passenger car occupants | 140 | 165 | 172 | 200 | 16 | 21.2 | 42.9 | |
| Pedestrians | 217 | 246 | 223 | 217 | -3 | -11.8 | 0 | |
| Others incl. unknown | 178 | 143 | 151 | 166 | 10 | 16.1 | -6.7 | |
| Total | 1 816 | 1 950 | 2 226 | 2 202 | -1 | 12.9 | 21.3 | |
Source: RCVIS. Safety data are those reported by police. Actual numbers are likely to be higher.
Figure 6.2. Road fatalities by road user group in percentage of total 2015
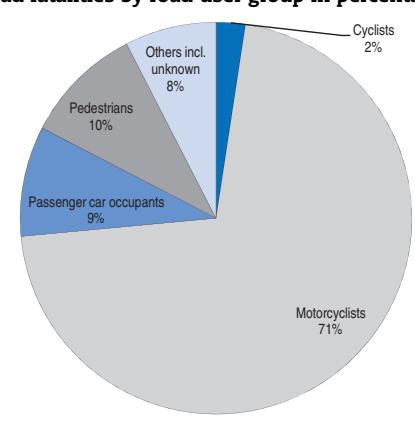
Source: RCVIS.
Table 6.3. Reported road fatalities by age group
| 2015 % change over | ||||||
|---|---|---|---|---|---|---|
| Age | 2010 | 2013 | 2014 | 2015 | 2014 | 2010 |
| 0-5 | 49 | 50 | 60 | 52 | -13 | 6 |
| 6-9 | 50 | 66 | 45 | 42 | -7 | -16 |
| 10-14 | 49 | 35 | 55 | 57 | 4 | 16 |
| 15-17 | 68 | 83 | 61 | 92 | 51 | 35 |
| 18-20 | 228 | 254 | 208 | 248 | 19 | 9 |
| 21-24 | 271 | 322 | 412 | 342 | -17 | 26 |
| 25-64 | 1 000 | 1 061 | 1 231 | 1 271 | 3 | 27 |
| 65 | 84 | 79 | 98 | 98 | 0 | 17 |
| Total incl. unknown | 1 816 | 1 950 | 2 226 | 2 202 | -1 | 21 |
Note: Data are those reported by police. Actual numbers are likely to be higher. 2014 data are provisional. Source: RCVIS.
Figure 6.3. Reported road death rates by age group Fatalities per 100 000 inhabitants in a given age group, 2008-15
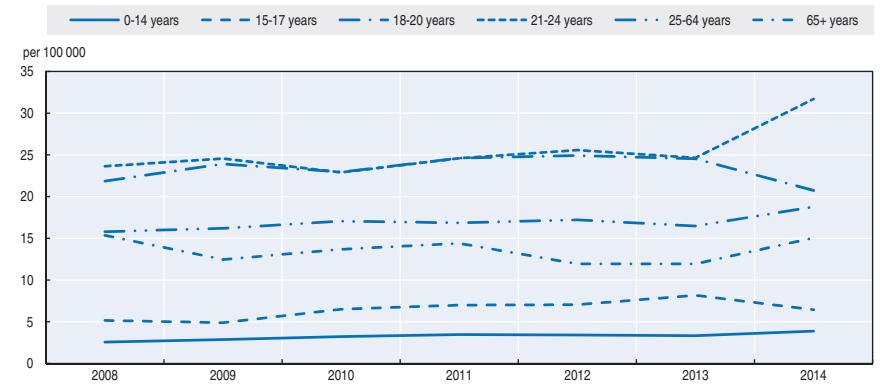
Note: Data are those reported by the police. Actual numbers are likely to be higher. Source: RCVIS.
Road safety by road type
In Cambodia, the roads are classified as follows:
- national roads: long roads connecting provinces
- provincial roads: roads connecting districts within a province
- main and minor roads in cities and towns
- local roads and tracks: small roads in villages
There is no motorway network in Cambodia. The large majority of fatalities (65%) occur on national roads.
Economic cost of traffic crashes
It is estimated that in 2013 the economic cost of road crashes equalled approximately USD 337 million. This represents 2.3% of Cambodia's GDP. The cost was estimated by Handicap International based on a methodology developed by the Asian Development Bank and updated by Handicap International Belgium and Hasselt University (2012).
The capital approach (human capital method) was used to calculate the cost of road crashes, which includes property damage costs, administrative costs, medical costs, lost output cost and human costs.
Recent trends in road user behaviour
Speed
Excessive speed is the leading cause of traffic crashes in Cambodia. In 2014, it was estimated that speed was a contributing factor in 44% of fatalities.
Until 2013, the number of speeding related fatalities was increasing annually due to the development of the road network and road rehabilitation throughout the country, enabling increased speed while driving. However, the number of speeding related fatalities decreased in 2013 and 2014.
The table below summarises the main speed limits in Cambodia.
Table 6.4. Speed limits by road type and vehicle type, 2016
| Motorcycles, tricycles | Passenger cars | |
|---|---|---|
| Inside built up areas | 30 km/h 40 km/h on national roads |
40 km/h |
| Outside built up areas | 90 km/h | 90 km/h |
Source: RCVIS.
Drink-driving
The maximum authorised blood alcohol content (BAC) is 0.5 g/l for all drivers. A drinkdriving related crash is defined as a crash caused by a road user with a BAC over the limit.
Drink driving is the second major cause of road crashes and casualties in Cambodia after speeding. In 2014 and 2015, 17% of reported fatalities were due to drink driving.
In 2015, a peak of drink-driving fatalities was observed between 6 p.m. and 7 p.m. (14%). Sundays, Saturdays and Friday had the highest percentages of alcohol related fatalities: 27%, 19% and 16% respectively. According to RCVIS, 82% of at-fault drivers in drink-driving crashes were motorbike drivers.
Drugs and driving
Cambodia has neither a legal framework nor facilities to enforce drug driving penalties.
Distraction
The new land traffic law bans hand-held mobile phones while driving. Hands-free phones can be used.
Seat belts and helmets
Seat belt wearing has been compulsory on front seats since 2007. Seat belt wearing is not compulsory for rear-seat passengers. Enforcement is weak and the rate of use is low.
Babies less than 10 months old must use a baby seat with the safety belt firmly attached. Children between 10 months and 4 years old must use a child seat with safety belt attached. Children less than 10 years old in front seats must be accompanied by an adult and must wear a seat belt. The compliance rate is low.
In 2015, 68% of passenger car drivers who died in a crash were not wearing a seat belt.
Table 6.5. Seat belt wearing rate by car occupancy and road type
| % | ||||
|---|---|---|---|---|
| 2009 | 2010 | 2011 | 2012 | |
| General | 23 | 30 | 27 | 16 |
| Urban roads (driver) | 52 | 41 | 44 | |
| Rural roads (driver) | 42 | 35 | 41 |
Source: RCVIS.
Helmet wearing has been compulsory since 2007 for operators of powered twowheelers over 49 cc, for motorcycles with trailers and for motorised tricycles. Helmets are not compulsory on mopeds below 49 cc. The mandatory use of helmets by passengers is approved and has been included in the latest revision to the traffic laws in 2015.
The helmet wearing rate is low: 77% of motorcycle drivers killed in a road crash and 99% of child passengers killed were not wearing a helmet.
National road safety strategies and targets
Organisation of road safety
The National Road Safety Committee (NRSC) was established in 2005 as the lead agency for road safety, under the responsibility of the Ministry of Transport and Public Works. Its role is to manage and co-ordinate all road safety activities in Cambodia. In the framework of the new traffic laws, expected to come into force in 2016, oversight of the NRSC will be shifted to the Ministry of Interior.
Road safety strategy for 2011-2020
To respond to the current road traffic crash situation, the NRSC has developed the National Plan for Road Safety 2011-20, based on the action plan developed to support the United Nations Decade of Action for Road Safety. The plan was submitted to the Prime Minister and was approved by the Council of Ministers in 2014.
The IRTAD twinning programme has allowed the NRSC to collaborate with Handicap International, the Institute for Road Safety Research of The Netherlands and Road Safety for All. Collaboration was instrumental in developing the road safety strategy and defining targets and performance indicators to monitor progress. The Action Plan consists of seven pillars: road safety management; infrastructure; safe vehicles; safe road user behaviour; post-crash care; traffic law legislation and enforcement; driver licensing, and better transport services for passengers and cargo.
Measures are chiefly focused on the main risk factors, which are the absence of helmets, speeding and drink-driving.
Road safety targets
This plan includes, for the first time, quantified national targets and safety performance indicators. The main target is to reduce the forecast number of fatalities by 50% by 2020, as recommended by the United Nations.
Monitoring
Monitoring tools have been developed by the co-operation between Cambodia and the Netherlands. The tools include:
- Analysis of data from the RCVIS:
- ❖ fatalities and trends (by age groups, road users, provinces, etc.)
- ❖ fatalities caused by head injuries, speeding and drink-driving.
- Observational studies:
- ❖ helmet-wearing rate during daytime and night-time
- ❖ drink driving measurement
- ❖ speed measurement: average speed, percentage of drivers exceeding the limit, etc.
- Roadside surveys/interviews to improve knowledge on attitudes and practices:
- ❖ helmet wearing
- ❖ drink-driving
- ❖ speeding.
In 2010, the forecast for the number of road traffic fatalities for the period 2011-20 was estimated based on 1995 to 2009 road traffic fatalities and motor vehicle ownership. The forecasting method adapted the latent risk time series model to predict the numbers of fatalities for 2010 to 2020. It is estimated that unless additional road safety actions are taken, the number of fatalities in Cambodia will increase up to 3 200 by 2020. The target is therefore to reduce the number of fatalities to less than 1 600. If the target is achieved progressively, 7 350 lives will be saved.
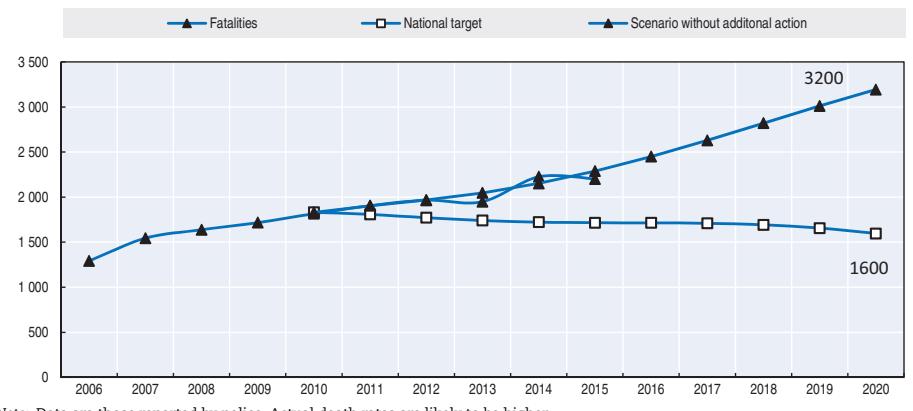
Figure 6.4. Trends in road fatalities towards national target
Note: Data are those reported by police. Actual death rates are likely to be higher. Source: RCVIS.
Following the endorsement of the Sustainable Development Goals of the United Nations, the 2016 annual road safety plan was approved by the government. The plan takes into account the national target of reducing the number of fatalities by 10% in 2016 compared to 2015 to contribute to the UN Goal.
The government has strengthened its provincial road safety committees and interventions by establishing road safety action plans in most of the provinces. At least half of the provinces in Cambodia have exercised these enforced interventions, in particular with drink driving, helmet wearing and overloading. The reports on the intervention results are not yet available.
References
Handicap International Belgium and the Institute of Mobility – Hasselt University of Belgium (2012), Cost Analysis of Road Crashes in Cambodia, Phnom Penh, Handicap International Belgium, 2012.
Website
● National Road Safety Committee: www.nrsc.gov.kh.
Chapter 7
Canada
This chapter presents 2014 road safety data for Canada. It looks at trends in traffic and road safety from the years 1990 to 2014 and road user behaviour patterns. This includes data on speed, drink driving, drugs and driving, distracted driving, fatigue and seat belt use. This chapter reviews Canada's national road safety strategies, their development and implementation and the progress achieved to date, along with a brief review of its new Road Safety Strategy 2025. It also looks at recently adopted safety measures and ongoing research.*
* A complete set of data for the year 2014 was not available when this report was prepared; therefore this report is based on both 2013 data and 2014 where possible. All data stem from Transport Canada and IRTAD unless otherwise noted. For more information, please contact: michael.marth@tc.gc.ca.
Canada, the world's fourth-largest country by land area, with a population of 35 million, has continued its improving trend in road safety recording in 2014 a total of 1 834 fatalities, the lowest number on record since data first started to be collected by Transport Canada over four decades ago. This is a 6% decrease over 2013. The reduction in fatalities was seen in all road user groups and all age groups. The current fatality rate is 5.2 per 100 000 inhabitants. Canada has adopted the Vision Zero approach as an aspiration goal for their road safety strategy.
Road safety data collection
Definitions applied in Canada
- Road fatality: Person who died as a result of a reportable motor vehicle crash within 30 days of its occurrence.
- Seriously injured person: Person admitted to hospital for treatment or observation.
Data collection
Transport Canada has a well-established road safety data programme and has been reporting on motor vehicle crash statistics since the 1970s. Police-reported road traffic crash information is collected and processed by provinces and territories and is then sent to Transport Canada for final processing and for compilation of national crash statistics.
Transport Canada considers the motor vehicle crash data to be relevant, of good quality overall and reliable for most analytical purposes. However, there are areas for improvement, as some specific data variables are not provided by certain jurisdictions or consistently reported by all of them. In some cases, where data has not been received from all jurisdictions within Canada, methodologies are used to ensure that national estimates take into account any non-reporting.
Transport Canada is currently working with provincial and territorial road safety partners in the area of electronic data collection and other initiatives aimed at improving the timeliness and accuracy of motor vehicle crash data. It is anticipated that approximately one-third of the data will be collected electronically within the next year or so.
Currently, serious injury data are collected through the same reporting mechanism as for all crash data. Transport Canada is in the initial stages of trying to improve the quality of the injury data, and is currently undertaking an environmental scan and consultation process as part of its efforts.
The National Collision Database online web application is a query tool that contains national level statistics on vehicle crashes occurring on public roads in Canada. Approximately 23 of the data elements contained in the National Collision Database are available to users, so that they can select and extract data of interest to them. A second version created for provinces and territories allows access to more detailed information.
Most recent safety data
Road crashes in 2014
The 2014 fatality count of 1 834 was not only 6% lower than that of the previous year, but also marked the lowest number of fatalities on record since the data were first collected by Transport Canada over four decades ago.
The long-term downward trend in both fatalities and serious injuries continued in 2014. Comparing 2014 fatality counts with those recorded in 2005 and in 1995, there has been a decrease of 37% and 45% respectively. The reduction in the number of serious injuries is even greater at 39% and 52% respectively.
This progress was achieved despite significant growth over this time period in the Canadian population, the number of licensed drivers, the number of registered vehicles and in vehicle kilometres travelled (VKT). Factors that helped contribute to the overall progress include national and jurisdictional road safety strategies and countermeasures as well as continuing improvement in vehicle safety features and equipment.
In terms of progress made on national road safety plans, the progress that was achieved in the closing years of the Road Safety Vision 2010 has so far kept its momentum going over the course of Road Safety Strategy 2015.
Trends in traffic and road safety (1990-2014)
Traffic
Motor vehicle registrations in Canada have been steadily increasing over the last two decades, rising by 38.6% since 1990. Between 2000 and 2014, light-duty vehicle registrations rose by about 29%, while commercial vehicle registrations were up by about 52%. Driver exposure in that period, as measured by vehicle-kilometres travelled for light-duty and commercial vehicles, increased by approximately 16%.
It is believed that the challenging economic climate dampened the level of driver exposure in particular between 2007 and 2009 wherein the Gross Domestic Product (GDP) grew modestly and even declined. Starting in year 2010 and continuing into 2014, the GDP has grown at higher rates, though more modestly in the latter years of this period. During this same period (2010 to 2014), vehicle travel remained fairly constant but increased slightly by 0.8% in 2010 over 2009, and then increasing by 0.5% in 2011 and 0.9% in 2012, before increasing more significantly by 3.5% and 1.7% in 2013 and 2014, respectively.
Road safety
Crashes and casualties
Motor vehicle casualties decreased significantly again in 2014, dropping below 1 900 for the first time in five decades of data compilation by Transport Canada. Fatalities were down approximately 54% as compared to the benchmark year of 1990, with the number of serious injuries having fallen 62%.
This progress was achieved despite ongoing growth in recent years in the number of licensed drivers, in the number of registered vehicles and in vehicle kilometres travelled.
It is believed that increased efforts by key stakeholders in developing and implementing road safety strategies, plans and countermeasures that focused on key areas of concern, such as speeding, impaired driving and unbelted occupants, contributed to the overall progress. Other contributors include improvements in vehicle safety features and equipment.
Rates
In 2014, the rate of fatalities per billion vehicle kilometres travelled was 5.1, which was 8% lower than the 2013 rate and approximately 23% lower than the rate seen five years previously.
The rate of fatalities per 100 000 inhabitants has fallen from 14.3 in 1990 to 5.2 in 2014; a decrease of 64%.
A very similar decrease was seen in the rate of serious injuries per 100 000 inhabitants which fell from 81.5 in 1990 to 28.6 in 2014; a decrease of 65%.
Table 7.1. Road safety and traffic data
| 2014 % change from | |||||||||
|---|---|---|---|---|---|---|---|---|---|
| 1990 | 2000 | 2010 | 2013 | 2014 | 2013 | 2010 | 2000 | 1990 | |
| Reported safety data | |||||||||
| Fatalities | 3 963 | 2 904 | 2 238 | 1 951 | 1 834 | -6.0 | -18.1 | -36.8 | -53.7 |
| Injury crashes | 181 960 | 155 838 | 125 636 | 122 101 | 112 167 | -8.1 | -10.7 | -28.0 | -38.4 |
| Injured persons hospitalised | 25 020 | 15 581 | 11 796 | 10 663 | 9 647 | -9.5 | -18.2 | -38.1 | -61.4 |
| Deaths per 100 000 inhabitants | 14.3 | 9.5 | 6.6 | 5.4 | 5.2 | -5.0 | -21.6 | -45.5 | -64.0 |
| Deaths per 10 000 registered vehicles | 2.3 | 1.6 | 1.0 | 0.9 | 0.8 | -8.2 | -23.5 | -52.0 | -66.6 |
| Deaths per billion vehicle kilometres | 9.4 | 6.7 | 5.5 | 5.1 | -7.6 | -23.2 | -45.3 | ||
| Traffic data | |||||||||
| Registered vehicles (thousands) | 16 981 | 17 882 | 21 848 | 23 006 | 23 538 | 2.3 | 7.7 | 31.6 | 38.6 |
| Vehicle kilometres (millions) | 308 631 | 335 900 | 352 367 | 358 518 | 1.7 | 6.7 | 16.2 | ||
| Registered vehicles per 1 000 inhabitants) | 613 | 583 | 642 | 654 | 662 | 1.2 | 3.1 | 13.6 | 8.0 |
1 2 http://dx.doi.org/10.1787/888933385387
Figure 7.1. Road safety, traffic and GDP trends index 1990 = 100
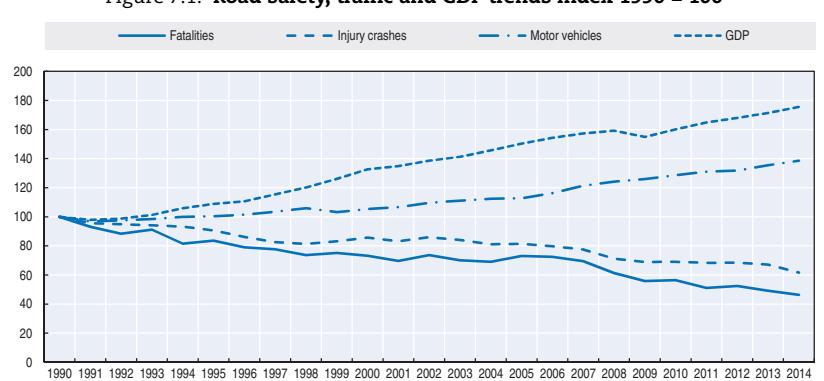
Source: World Bank for Growth Domestic Product (GDP; constant prices).
Road safety by user group
Since 1990, improvement in road safety benefited all user groups, though the reduction was slower for motorcyclists (-25%; whereas the overall fatalities declined by 54%).
Fatalities by road user class over the short-term have remained fairly stable across their respective categories, though fatalities of passenger car occupants (-25%) have declined at a greater rate than that of other groups over the 2010 to 2014 period.
With respect to vehicle types in 2014, while passenger cars continued to represent the vehicle type attributed with the most fatalities, this proportion has been decreasing in the last five years.
| 2014 % change from | |||||||||
|---|---|---|---|---|---|---|---|---|---|
| 1990 | 2000 | 2010 | 2013 | 2014 | 2013 | 2010 | 2000 | 1990 | |
| Bicyclists | 106 | 40 | 61 | 63 | 60 | -4.8 | -1.6 | 50.0 | -43.4 |
| Moped users | 8 | 5 | 5 | 1 | 1 | Figures too small for meaningful comparison | |||
| Motorcyclists | 252 | 166 | 188 | 200 | 188 | -6.0 | 0 | 13.3 | -25.4 |
| Passenger car occupants | 2 244 | 1 761 | 1 270 | 1 014 | 954 | -5.9 | -24.9 | -45.8 | -57.5 |
| Pedestrians | 584 | 373 | 306 | 308 | 289 | -6.2 | -5.6 | -22.5 | -50.5 |
| Others | 769 | 559 | 408 | 365 | 342 | -6.3 | -16.2 | -38.8 | -55.5 |
| Total | 3 963 | 2 904 | 2 238 | 1 951 | 1 834 | -6.0 | -18.1 | -36.8 | -53.7 |
Table 7.2. Road fatalities by road user group
Figure 7.2. Road fatalities by road user group in percentage of total 2014
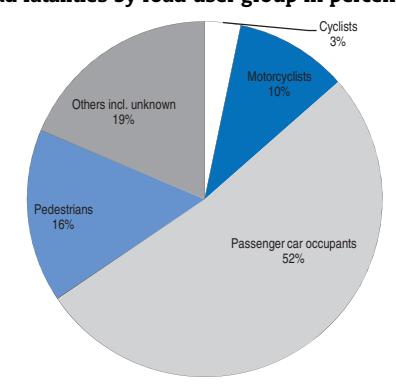
Road safety by age group
Since 1990, improvements in road safety benefited all age groups, with a strongest reduction for children up to 14.
The 15-24 year-olds continued to account for the most fatalities and injuries in 2014. Approximately 21% of fatalities in 2014 were associated with a driver or passenger in that age group, however, this representation has decreased slightly in recent years. Conversely, there has been a slight increase in the proportion of seniors (65+) fatally injured over the last five years, rising from 17% in 2010 to 21% in 2014. This coincides with an increase in population share for that age grouping, which accounted for 15.7% of the population in 2014 compared to 14.1% in 2010.
Young people (18-20) are the most at risk in traffic with a fatality rate that is approximately twice that of the general population.
Road safety by road type
The highest number of fatalities is found on rural roads. However, the percentage of fatalities on rural roads has decreased from approximately 52% in 1990 to 49% in 2014.
| | | | | | | | | 2014 % change from | | | |-------|-------|-------|-------|-------|-------|------|-------|--------------------|-------|--| | Age | 1990 | 2000 | 2010 | 2013 | 2014 | 2013 | 2010 | 2000 | 1990 | | | 0-5 | 101 | 38 | 20 | 31 | 29 | -6.5 | 45.0 | -23.7 | -71.3 | | | 6-9 | 77 | 40 | 15 | 15 | 14 | -6.7 | -6.7 | -65.0 | -81.8 | | | 10-14 | 127 | 66 | 28 | 26 | 24 | -7.7 | -14.3 | -63.6 | -81.1 | | | 15-17 | 223 | 183 | 114 | 75 | 71 | -5.3 | -37.7 | -61.2 | -68.2 | | | 18-20 | 382 | 293 | 193 | 157 | 148 | -5.7 | -23.3 | -49.5 | -61.3 | | | 21-24 | 444 | 294 | 211 | 182 | 171 | -6.0 | -19.0 | -41.8 | -61.5 | | | 25-64 | 2 003 | 1 461 | 1 220 | 1 044 | 981 | -6.0 | -19.6 | -32.9 | -51.0 | | | 65 | 583 | 505 | 426 | 402 | 378 | -6.0 | -11.3 | -25.1 | -35.2 | | | Total | 3 963 | 2 904 | 2 238 | 1 951 | 1 834 | -6.0 | -18.1 | -36.8 | -53.7 | |
Table 7.3. Road fatalities by age group
Figure 7.3. Road death rates by age group Fatalities per 100 000 inhabitants in a given age group, 1990-2014
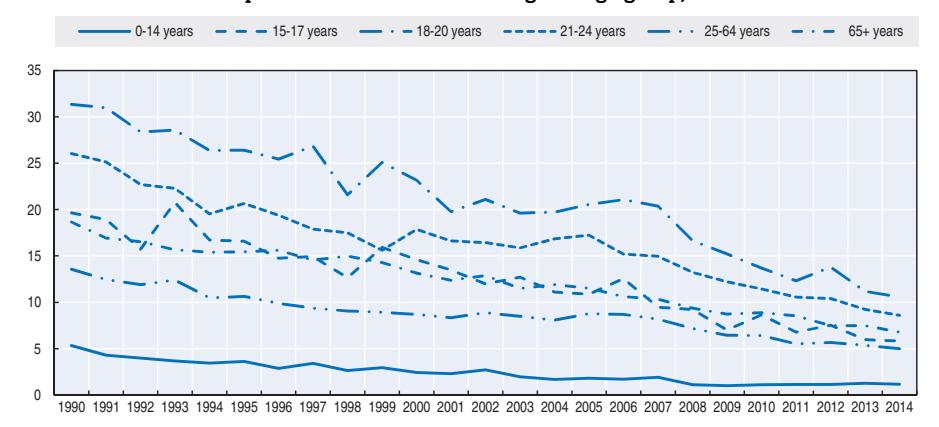
Economic costs of traffic crashes
For the purposes of this report, costs have been calculated using the willingness-topay approach. This means that the value of a statistical life (VSL) is used to value fatalities, and fractions of VSL are used to value injuries, based on quality-adjusted life years (QALYs) lost. The values noted below are still preliminary and may be subject to change.
Traffic crashes represent a very significant cost for society at CAD 35.9 billion or 1.9% of GDP in 2013.
Recent trends in road user behaviour
Speed
Speeding, along with impaired and distracted driving, is a significant contributor to motor vehicle fatalities. In 2013, it is estimated that about one-fifth of fatal crashes involved speeding. Over the last decade, speed-related fatalities have declined about 20%. Casualty data in 2013 indicates a 43% reduction in speed related crashes compared to the 2006 to 2010 period.
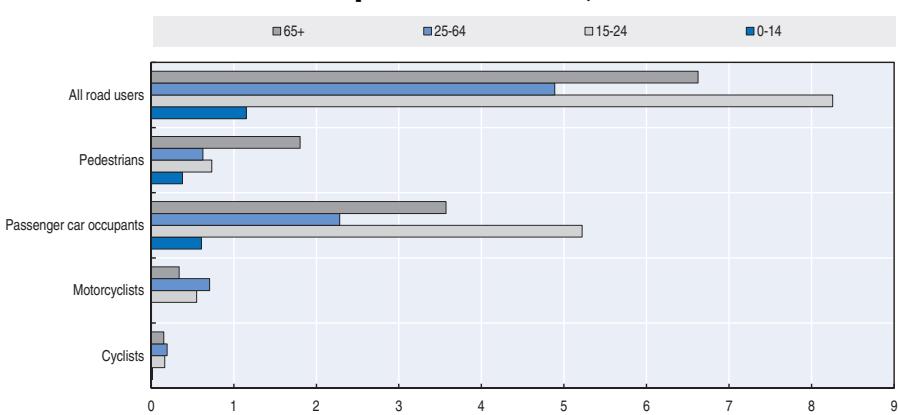
Figure 7.4. Road death rate by age and road user group Fatalities per 100 000 inhabitants, 2014
Figure 7.5. Road fatalities by road type
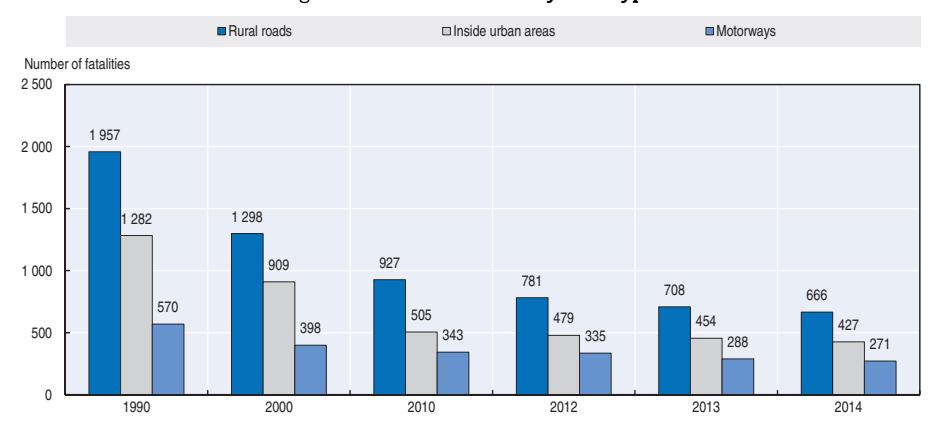
Table 7.4. Costs of road crashes, 2013
| Costs | Unit cost (2013 CAD) | Total (2013 CAD) |
|---|---|---|
| Fatalities | 8 590 493 | 16.8 billion |
| Hospitalised people | 1 066 939 | 10.9 billion |
| Slight injuries | 22 727 | 3.5 billion |
| Property/damage costs | 8 967 | 4.8 billion |
| Total (CAD) | 67 7051 | 35.9 billion |
| Total as % of GDP | 1.90% |
1. Total unit cost is per crash.
The table below summarises the main speed limits in Canada.
Table 7.5. Passenger car speed limits by road type, 2016
| Urban roads | 40-70 km/h |
|---|---|
| Rural roads | 80-90 km/h |
| Motorways | 100-110 km/h |
Drinking and driving
Under the Criminal Code of Canada the maximum permissible blood alcohol content (BAC) when driving is 0.8 g/l. However, in most provinces and territories, there is an additional administrative maximum level of 0.5 g/l (0.4 g/l in Saskatchewan, and in Quebec the 0.5 g/l limit only applies to commercial vehicles).
Penalties under these administrative programmes are significant but do not match the seriousness of a full Criminal Code of Canada charge. Penalties in both situations increase for repeat offenders. In addition, most provincial/territorial jurisdictions have a zero BAC limit for young (under 21) and/or novice drivers.
The 2012 preliminary data (most recent available) indicate that 33% of drivers who were fatally injured in road crashes had some level of alcohol in their blood and 22% were over the 0.8 g/l threshold.
Information on the presence of alcohol is collected on police crash report forms, but as the data are not always reliable, a surrogate is used for instances of deaths of drivers and pedestrians involving alcohol. The percentage of fatally injured drivers who were tested for alcohol is applied to all motor vehicle deaths to estimate the percentage of all deaths which were alcohol related. With respect to injury crashes, any police report which indicates alcohol or any crashes that fit a surrogate model are identified as alcohol related (Mayhew et al., 1997). Canada is reviewing the Criminal Code of Canada sanctions against impaired driving with a view to updating the laws.
Drugs and driving
The Criminal Code of Canada sections that govern impaired driving would also include impairment by drugs. The Criminal Code was updated in 2009 to detail a police investigation of suspected drug-impaired driving situations, based on behavioural indices of unsafe driving and following the procedures set out by the Drug Recognition Evaluator (DRE) programme of the International Association of Chiefs of Police. This programme is initiated if there appears to be behavioural indications of impairment and no or little alcohol is found. The penalties are the same as for impairment by alcohol.
Canada began testing fatally injured drivers for drugs in 2000, similar to the method used for alcohol. The table below indicates the number and percentage of drivers who were tested and found positive or negative for drugs. Not all drivers are tested and the testing rate is typically lower than that of alcohol. It should be noted that the rate of psychotropic drugs found in fatally injured drivers is similar to that of alcohol. Canada is reviewing the situation of cannabis with a view to changing its current status. The government of Canada is currently studying its options.
| Year | Drivers | Drivers tested | % Tested | % Negative | % Positive |
|---|---|---|---|---|---|
| 2000 | 1 453 | 528 | 36.3 | 65.3 | 34.7 |
| 2001 | 1 403 | 582 | 41.5 | 64.6 | 35.4 |
| 2002 | 1 448 | 639 | 44.1 | 58.5 | 41.5 |
| 2003 | 1 429 | 636 | 44.5 | 68.4 | 31.6 |
| 2004 | 1 350 | 520 | 38.5 | 63.7 | 36.3 |
| 2005 | 1 497 | 655 | 43.8 | 61.7 | 38.3 |
| 2006 | 1 490 | 842 | 56.5 | 65.9 | 34.1 |
| 2007 | 1 408 | 865 | 61.4 | 66.2 | 33.8 |
| 2008 | 1 301 | 747 | 57.4 | 62.4 | 37.6 |
| 2009 | 1 195 | 670 | 56.1 | 63.9 | 36.1 |
| 2010 | 1 158 | 644 | 55.6 | 62.9 | 37.1 |
| 2011 | 1 123 | 818 | 72.8 | 59.2 | 40.8 |
| 2012 | 1 172 | 907 | 77.4 | 60 | 40 |
Table 7.6. Number and percentage of drivers who were tested and found positive or negative for drugs
Distraction
Broadly speaking, distracted driving was commonly associated with activities such as eating, talking to other passengers, adjusting entertainment or climate controls and general inattention. While these types of driver distraction continue to this day, there is increasing focus on distracted driving due to electronic communication devices and electronic vehicle equipment.
The use of mobile phones or other electronic devices while driving is regulated by the individual provinces and territories.
An observational mobile phone survey was conducted at 286 urban sites during September 2012 and at 252 rural sites during September 2013. A total of 70 686 drivers of light-duty vehicles were observed while they were stopped at a traffic light or a stop sign at urban sites and 33 483 drivers were observed at rural sites at similar intersections. The use of a hand-held Electronic Communications Device (ECD) was recorded, as was the type of usage (i.e. speaking, typing, both), driver age and gender, number of passengers in the vehicle and type of vehicle. The data were weighted by population and number of vehicles passing through each survey site to obtain estimates of ECD use and the type of use.
The results were presented nationally, by jurisdiction, and by various subgroups (i.e. age, sex, type of vehicle, number of passengers). Nationally, an estimated 4.4% (±0.4) of the drivers used an ECD, varying by jurisdiction from 1.4 to 8.7%. ECD use was more frequent among drivers under 25 years of age, drivers of light trucks, drivers without passengers, and somewhat more by female drivers. ECDs were used for talking by 2.3% of drivers and for typing by 1.6% of drivers. Nationally, the use of hand-held ECDs for talking was 58% lower in the 2012-2013 surveys than that observed in 2006-2007 surveys.
There are plans to repeat these observational surveys in the fall of 2016 and 2017. Analysis will be undertaken to measure the changes in ECD use between the survey periods.
Fatigue and sleepiness
The North American Fatigue Management Program (www.nafmp.com) is a comprehensive educational website that provides Motor Carriers, their drivers, dispatchers and management, with all the necessary information to mitigate driver fatigue over and above Hours of Service Regulations. The website was launched in July 2014 and has since then been widely adopted across North America. There are usually between 150 and 400 simultaneous users on the website, however genuine implementation of the programme is impossible to assess at this time
Seat belts and helmets
Seat belt use was made compulsory in Canadian jurisdictions between 1976 and 1988.
In Canada, road user behaviour is a provincial/territorial responsibility and the laws around the use of seat belts and child restraints are provincial or territorial. All provinces and territories have laws in place mandating the use of child restraints since the 1980s, and they are occasionally updated. In most cases, the driver is responsible for ensuring that a child is correctly restrained.
In Canada, child restraint use is promoted in four stages: Stage 1, rear facing; Stage 2, forward facing; Stage 3, booster sears; Stage 4, three-point seat belt in the rear seat. Graduation from one stage to another is based on the seat involved and the weight and height of the child. Usage for Stage 1 and Stage 2 seats is very high but only some provinces/ territories have legislation requiring booster seats.
A 2010 observational survey of child restraint use in Canada indicates that incorrect use of child restraints increases with the age of the child. The most significant incorrect usage issue is premature graduation from one stage to another, which reduces safety for the child (Snowdon et al., 2010).
Seat belt use in Canada is at approximately 95%. However, about 28% of occupants killed in 2014 were unbelted at the time of the crash; a 20 per cent decrease from the rate of 35% in 2010.
There are plans to measure seat belt usage at the same time that the observational surveys associated with ECD use are to take place (last quarter 2016 and 2017).
National road safety strategies and targets
Organisation of road safety
In Canada, the responsibility for road safety is divided among different levels of government and other road safety and private sector partners.
Federal, provincial and territorial departments responsible for transportation and highway safety work together through various committees and associations that report to the Council of Ministers Responsible for Transportation and Highway Safety. This council is assisted by the Council of Deputy Ministers Responsible for Transportation and Highway Safety. Within this structure, three committees co-ordinate multi-jurisdictional views and efforts (Canadian Council of Motor Transport Administrators, Engineering and Research Support Committee and the Policy and Planning Support Committee). In addition, the Transportation Association of Canada, which also includes a number of municipal partners, addresses infrastructure issues.
This structure is designed to promote national consistency, provide a platform to share information and assist jurisdictions in addressing the issues within their specific mandate. Ultimately the responsibility for implementation remains with the appropriate jurisdiction.
The Federal Government is responsible for regulations and standards related to the manufacture and importation of motor vehicles, tyres and child restraints. Provincial and territorial governments are responsible for licensing drivers, registering vehicles and administering justice and jurisdictional road safety programmes. They are also responsible for policy and regulations regarding the roadways. In many cases, the road authority responsible for the operations of the road may be regional or municipal governments, which must operate within the provincial guidelines.
Road safety strategy for 2011-15
Canada's fourth national road safety plan, the Road Safety Strategy (RSS) 2025 has been launched by the Council of Ministers Responsible for Transportation and Highway Safety. The goal remains to achieve downward trends in fatalities and serious injuries throughout a five-year duration, comparing a rolling three-year average with the established baseline period
The new plan has a greater emphasis on vehicle technologies and roadway infrastructure. Canada has adopted the Vision Zero approach as an aspirational goal. A database of proven and promising road safety initiatives is maintained as a part of the strategy and each jurisdiction is encouraged to develop their own road safety plan based on regional needs and conditions. More information is available at http://crss-2025.ccmta.ca (accessed 3 May 2016).
Road safety targets
The aspirational goal of RSS 2025 is zero fatalities and serious injuries. The ongoing goal of the current programme is to achieve downward trends in fatalities and serious injuries throughout its five-year duration.
Monitoring
The Canadian Council of Motor Transport Administrators with assistance from Transport Canada reports annually on progress toward the goals of fatality and injury reduction. A number of rate-based measures are used to focus on progress in specific areas such as impaired driving, speeding, and unbelted occupants.
When comparing the 2014 figures with the baseline period of 2006-10, fatalities were down 27%, while serious injuries were down by 28%. The 2011-14 average fatalities and serious injuries were both 21% lower than the baseline period.
A similar story unfolds using a rate-based measure, with the rate of fatalities per billion VKTs in 2014 being 23% lower than that of the baseline period (2006-10), and the rate of serious injuries per billion VKTs was 34% lower.
The New Sustainable Development Goals have been shared with the provincial/ territorial jurisdictions to assist with regional road safety plans.
Any evaluations are with respect to the Road Safety Strategy which will be evaluated up to the end of 2015. As it was launched at the same time as the decade this will serve as a mid-term review of the decade.
Recent safety measures (2013-15)
Road safety management
● All jurisdictions are requested to develop a jurisdictional road safety plan specific to the regional challenges they face. These plans may also include hard targets. It is recommended that plans be published.
Road users
Impaired driving
- A number of jurisdictions have improved their administrative sanctions for impaired driving. For example, the Immediate Roadside Prohibition programme in British Columbia.
- A number of jurisdictions are changing the administrative sanctions to include drug impairment.
- Testing is underway to authorise in the Criminal Code of Canada the use by police of roadside drug testing devices for preapproved drugs. At the same time, consideration is being given to per se limits for specific drugs.
Driving licence
● Some jurisdictions are updating their driver licensing systems and include more use of electronic systems.
Fatigue
● The North American Fatigue Management Program information can be found at the following website www.nafmp.com.
Infrastructure
- Programmes for safer communities continue to be adopted by Canadian municipalities.
- Up-to-date information on infrastructure improvements can be found at: http://tac-atc.ca/ en/bookstore-and-resources/tac-news.
Vehicles
- The Motor Vehicle Safety Act has been updated to support alignment with other safety regimes in the United States and the United Nations Economic Commission for Europe (UNECE) and to increase its defect and recall powers. Additional enhancements to the act are being considered. The department is also a member of a United Nations effort to harmonise vehicle regulations, Working Party 29.
- The Automated Vehicle Working Group managed by CCMTA held a national meeting looking at issues related to automated vehicles and technologies. Issues considered related to allowing testing of such technologies and their ultimate roll out. There was discussion regarding driver licensing, insurance, vehicle repair certification and cyber security. Work is continuing.
Recent and ongoing research
Updates on road safety research in Canada can be found at:
- Canadian Association of Road Safety Professionals Conference: www.carsp.ca.
- Road Safety driver and vehicle policy, regulations and research: www.ccmta.ca.
- Infrastructure projects: www.tac-atc.ca.
References
Mayhew, D.R., D.J. Beirness and H.M. Simpson (1997), Indicators of the Alcohol-Crash Problem, Road Safety and Motor Vehicle Regulation, Transport Canada, Ottawa, Ontario.
Snowdon, A., A. Hussein and E. Ahmed (2011), Canadian National Survey on Child Restraint Use 2010, completed for Transport Canada, in partnership with AUTO21, www.tc.gc.ca/eng/motorvehiclesafety/ resources-researchstats-child-restraint-survey-2010-1207.htm (accessed 3 May 2016).
Websites
- Transport Canada: www.tc.gc.ca/.
- Road Safety Vision 2010: http://ccmta.ca/en/members/standing-committees/rsrp-member-page/rsrp-memberpage-committee-reports.
- Road Safety Strategy 2025: http://crss-2025.ccmta.ca/en/.
- Transportation Association of Canada: www.tac-atc.ca/.
- National Collision Data Base On-Line Web application: www.tc.gc.ca/VehicleCollisions (accessed 3 May 2016).
Chapter 8
Chile
This chapter presents 2014 road safety data for Chile along with provisional data from 2015. It looks at trends in traffic and road safety from the years 2000 to 2014 and road user behaviour patterns. This includes data on speed, drink driving, drugs and driving, distracted driving, fatigue and seat belt and helmet use. The chapter reviews Chile's road safety strategy and the most recently implemented safety measures.*
* Data included in this report are under validation by IRTAD. All data stem from National Road Safety Commission (CONASET) unless otherwise noted. For more information please contact: CMedina@mtt.gob.cl.
Between 2000 and 2014, fatalities in Chile fluctuated with no clear trend emerging. The lowest value 1 960 was observed in 2009 and the highest value 2 317 was observed in 2008. In 2014 there were 2 119 road deaths in Chile, a 0.4 % increase compared to 2013. Initial data from 2015 indicate that this figure has increased again by 1%. Injury crashes decreased by 2% in 2014, but the overall trend since 2000 has been an increasing one.
From 2014, Chile has implemented the reform of their driving licence system. They have also clamped down on drink driving offences which have reduced alcohol related fatalities by 25%.
Road safety data collection
Definitions applied in Chile
- Road fatality: A person who dies from injuries within 24 hours of the crash. To conform to international definitions being a death within 30 days, the National Road Safety Commission (CONASET, Comisión Nacional de Seguridad de Tránsito) applies a correction factor of 1.3. Fatality data in this report correspond to the corrected data.
- Person seriously injured: A person injured and hospitalised for more than 24 hours.
Data collection
Following a traffic crash, the police (Carabineros de Chile) attending the site of the accident are responsible for filling out a Data Collection Form of Road Traffic Accidents (SIEC 2), which is used throughout the country. The information is later entered and stored in a road traffic crash database available to the police. In cases of crashes involving deaths or serious injuries, the crash report is sent by the police to the relevant judges. The police records only include data for the first 24 hours after the crash has occurred.
The official data, on the other hand, are generated through the National Vital Statistics Agreement (CNEV, whose members are the National Statistics Institute, the Ministry of Health and the Civil Registry and Identification Service). The cause of death is coded by the Ministry of Health using the International Statistical Classification of Diseases and Related Health Problems (ICD-10). However, due to the complexity involved in collecting and validating data on deaths, the most recent information from the health database is from 2011. The collection and validation process also involves cross checking with police data. This process is not yet automated, which explains the delay in reporting data on vital statistics.
Due these challenges, to standardise the number of deaths to those occurring up to 30 days after the crash and in accordance with the criteria set by the World Health Organisation (WHO), a correction factor of 1.3 is applied to the death data received from the police. CONASET is currently working together with the police and other relevant institutions to develop an improved form and to create a new database with automated linkage between police and health data.
Most recent safety data
Road crashes in 2015 – provisional data
Based on provisional data, there were 2 140 road fatalities in 2015, 1% more than in 2014. The number of injury crashes increased by 0.7%.
Road crashes in 2014
In 2014, there were 2 119 road deaths in Chile, a 0.4 % increase compared to 2013. The number of deaths decreased among cyclists and pedestrians, but increased among motorcyclists and passenger car occupants. Fatalities increased among young people (0-14 years old) and the elderly (65+ years old). The number of injury crashes decreased by 2%.
Two important measures were implemented in 2014: the reform of the driving licence procedure, with new theoretical and practical exams; and the adoption in September of the "Emilia's Law" which increases the severity of punishment for drunk drivers who cause serious injuries or death (including at least one year of actual imprisonment). In addition, fleeing the scene or refusing an alcohol test has become a criminal offence.
Trends in traffic and road safety (2000-14)
Traffic
Between 2000 and 2014, the number of motorised vehicles more than doubled (115%), with the number of motorcycles multiplying by more than five from approximately 30 000 to nearly 170 000 (515%).
There is a strong vehicle concentration in the main cities. As a consequence, congestion is increasing, especially during rush hours.
Road safety
Crashes and casualties
Between 2000 and 2014, the fatalities have fluctuated with no clear trend emerging. The lowest value 1 960 was observed in 2009 and the highest value 2 317 was observed in 2008. Injury crashes decreased by 2% in 2014, but the overall trend is increasing since 2000.
Rates
In 2014, Chile had a fatality rate of 11.9 fatalities per 100 000 inhabitants. Since 1990 the rate has decreased by 24%.
1990 2000 2010 2013 2014 2014 % change from 2013 2010 2000 1990 Reported safety data Fatalities 2 063 2 207 2 074 2 110 2 119 0.4 2.2 -4.0 2.7 Injury crashes 30 772 34 335 39 307 38 483 -2.1 12.1 25.1 na Seriously injured persons 6 312 7 581 6 420 6 943 6 968 0.4 8.5 -8.1 10.4 Deaths per 100 000 inhabitants 15.7 14.3 12.1 12.0 11.9 -1.1 -2.0 -17.0 -24.0 Deaths per 10 000 registered vehicles 19.2 10.6 6.3 5.1 4.7 -6.3 -24.6 -55.3 -75.3 Traffic data Registered vehicles (thousands) 2 079 3 299 4 169 4 468 7.2 35.4 114.9 na Registered vehicles per 1 000 inhabitants 135 193 237 251 5.6 29.9 85.7 na
Table 8.1. Road safety and traffic data
1 2 http://dx.doi.org/10.1787/888933385394
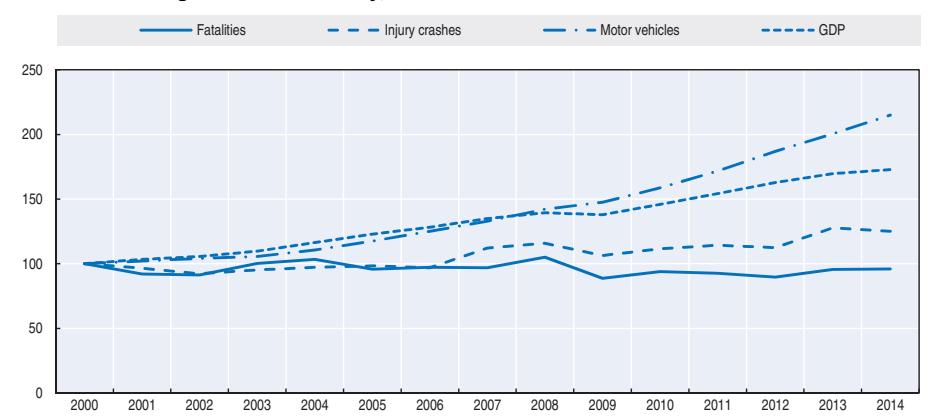
Figure 8.1. Road safety, traffic and GDP trends index 2000 = 100
Source: World Bank for Gross Domestic Product (GDP; constant prices).
Road safety by user group
Passenger car occupants and pedestrians are the user groups the most affected by road fatalities and were represented in 2014 at 39% and 38% respectively of all fatalities.
As in many Latin American countries, the safety of motorcyclists is a growing concern. Since 2010 the number of motorcyclists killed increased by more than 45% while the number of motorised two-wheelers increased by 64% over the same period. In 2014, the government launched a national plan to improve the safety of motorcyclists. It includes 35 targeted measures, including a graduated licensing system, a more rigorous driving exam and infrastructure improvement (see also the section on recent road safety measures).
The number of deaths among cyclists decreased by 12% in 2014 compared to 2013 (from 161 to 142). There is growing popularity of cycling as a means of transport and not just for recreational purposes. To respond to this growth, CONASET has implemented a number of awareness campaigns.
| | | | | 2014 % change from | | | |-------------------------|-------|-------|-------|--------------------|-------|--| | | 2010 | 2013 | 2014 | 2013 | 2010 | | | Cyclists | 189 | 161 | 142 | -11.8 | -24.9 | | | Motorcyclists | 111 | 146 | 160 | 9.6 | 44.1 | | | Passenger car occupants | 731 | 762 | 832 | 9.2 | 13.8 | | | Pedestrians | 815 | 820 | 800 | -2.4 | -1.8 | | | Others | 229 | 221 | 186 | -15.8 | -18.8 | | | Total | 2 074 | 2 110 | 2 119 | 0.4 | 2.2 | |
Table 8.2. Road fatalities by road user group
Road safety by age group
Road crashes are the primary cause of death in children aged between 1 and 14.
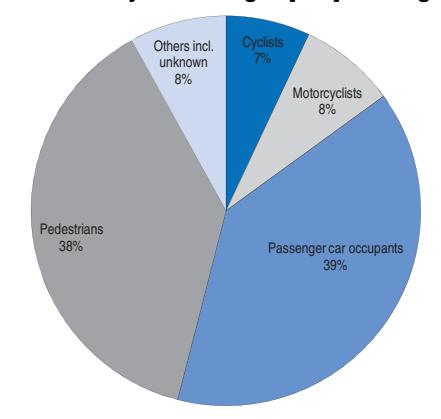
Figure 8.2. Road fatalities by road user group in percentage of total 2014
Since 2010, senior citizens (65+ years old) are the most at risk in traffic, with a mortality rate of 19 to 20 deaths per 100 000 inhabitants. They are particularly vulnerable as pedestrians and cyclists.
In 2014, fatalities increased for young people (0-24 years old) and decreased for the 15-17 and 25-64 year-old age groups.
| 2014 % change from | |||||
|---|---|---|---|---|---|
| Age | 2010 | 2013 | 2014 | 2013 | 2010 |
| 0-5 | 56 | 43 | 56 | 30.2 | 0 |
| 6-9 | 18 | 23 | 27 | 17.4 | 50.0 |
| 10-14 | 29 | 27 | 36 | 33.3 | 24.1 |
| 15-17 | 42 | 55 | 39 | -29.1 | -7.1 |
| 18-20 | 104 | 118 | 118 | 0 | 13.5 |
| 21-24 | 147 | 172 | 192 | 11.6 | 30.6 |
| 25-64 | 1 292 | 1 279 | 1 243 | -2.8 | -3.8 |
| 65 | 302 | 334 | 341 | 2.1 | 12.9 |
| Total | 2 074 | 2 110 | 2 119 | 0.4 | 2.2 |
Table 8.3. Road fatalities by age group
Road safety by road type
In 2014, 61% of road fatalities occurred on roads outside urban areas.
Economic cost of traffic crashes
In Chile, the economic cost of road crashes is based on the human capital approach. This approach assesses the consequences of the crashes based on the loss of productivity resulting from a statistical death, but does not include property damage and other costs.
Based on this methodology, road crashes cost was estimated at USD 404 million in 2013.
However, the real costs of road crashes for Chilean society are actually much higher. First, police data underestimate the true extent of casualties. Second, the mandatory vehicle
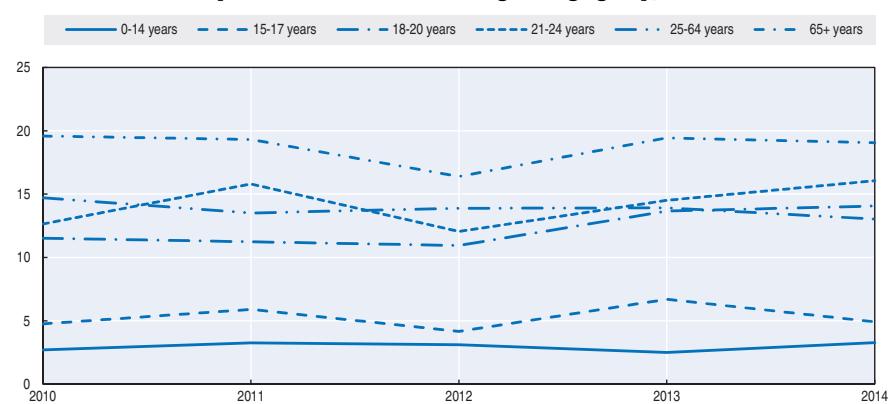
Figure 8.3. Road fatality rates by age group Deaths per 100 000 inhabitants in a given age group, 1990-2014
Figure 8.4. Road fatality rate by age and road user group Fatalities per 100 000 inhabitants, 2014
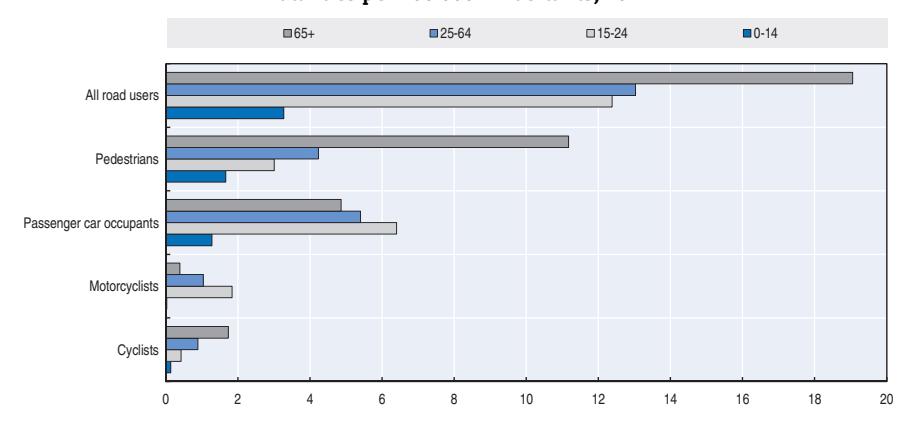
insurance covers health expenses up to a certain amount, beyond which the expenses must be covered by the victims. In addition, this calculation does not consider property damage and other costs, including police, fire, legal and administrative costs and paperwork.
Recent trends in road user behaviour
Speed
There is little information on the share of crashes due to excessive or inappropriate speed. Moreover, data available underestimates the influence of speed in the most serious crashes. Work is underway to get more accurate information. Meanwhile, it is roughly estimated that speeding is responsible for around 30% of fatal crashes.
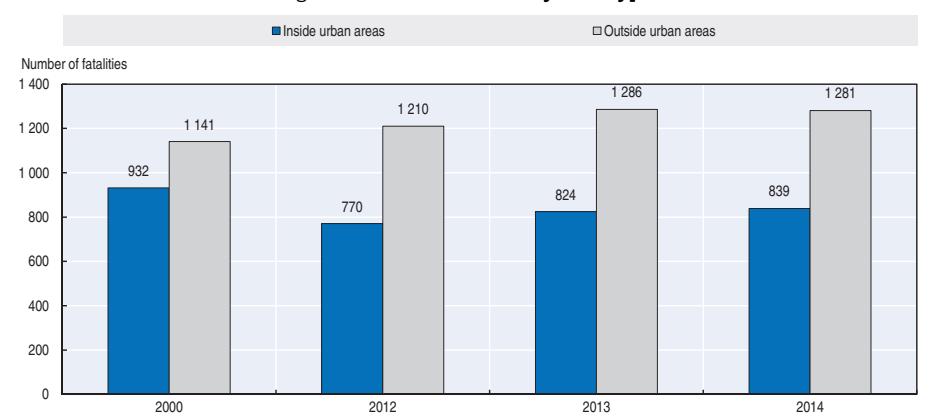
Figure 8.5. Road fatalities by road type
A study conducted in 2014-15 revealed that at any given time 50% of drivers exceed the speed limit on interurban roads and 40% in urban areas. The research also showed speeding was more prevalent during the night and at weekends. The study also found that roads with a median barrier separation contributed to speeding.
In August 2015, the Ministry of Transportation and Telecommunications submitted a bill to congress that proposes reducing the urban speed limit from 60 to 50 km/h. This law is expected to be voted on by parliament in 2016.
| General speed limit | |
|---|---|
| Urban roads | 60 km/h |
| Rural roads | 100 km/h if there is one lane in each direction 120 km/h if there are two or more lanes in each direction |
| Motorways | 120km/h |
Table 8.4. Passenger car speed limits by road type, 2016
Drink driving
In 2012, the government of Chile introduced a new law to support the zero tolerance policy for drink driving. It sets the maximum permissible blood alcohol content (BAC) at 0.3 g/l. The law defines:
- driving under the influence of alcohol as driving with a BAC between 0.3 g/l and 0.8 g/l
- driving while intoxicated, which entails much tougher sanctions, as driving with a BAC of 0.8 g/l or higher.
A traffic crash is defined as alcohol-related when either a driver, or another person involved in the crash (including motorcyclists, cyclists or pedestrians), has a measurable or estimated BAC of 0.3 g/l or above.
The number of fatalities due to drink driving declined significantly in 2012, when the zero tolerance law was implemented. It is estimated that 9% of fatalities in 2014 involved a driver impaired by alcohol.
In 2014, "Emilia's Law" (Ley Emilia) was implemented to more severely punish drunk drivers responsible for serious injury or fatal crashes. This new law complements the zero tolerance law enacted in 2012 and increases sanctions for drink driving, such as disqualifying the driver for life. The driver is also subject to at least one year of actual imprisonment. In addition, fleeing the scene or refusing an alcohol test is now a criminal offence. More information can be found at www.conaset.cl/ley-emilia.html.
Following the first year of the implementation of "Emilia's Law" the number of fatalities, crashes and those injured due to the influence of alcohol decreased respectively by 16%, 12% and 13%.
Drugs and driving
Currently there is no proper drug test process following a crash. Therefore, the attribution of only 0.1% of deaths to driving under the influence of drugs is largely underestimated. This situation can be explained because a road crash is defined as caused by drugs only when the police see the act of consuming or any physical evidence of drugs.
Distraction
Police data reported that 6% of crash deaths in 2014 were related to distracted driving. Chilean traffic law considers driving while using a mobile phone a serious traffic violation, unless the person is using a hands-free device.
Sleepiness and fatigue
According to police data only 1.4% of traffic deaths in 2014 are related to fatigue. This figure is low because it is difficult for the police to discern the physical condition of the drivers when the crash occurred.
Seat belts and helmets
Seat belt use has been compulsory for front seats since 1985 and rear seats since 2006. The wearing rate in 2014 was 78% for drivers, 62% for front seat passengers and around 15% for rear seat passengers.
Until 2015, children under 8 years of age had to be seated in the rear seat and be adequately restrained. Since March 2016, this applies to children up to 12 years of age. As of 2017, the obligation to use child restraints will be applied to children from 4 to 8 years of age or those below 1.35 m height or lighter than 33 kg of weight.
All riders of motorised two-wheelers are required to wear helmets. The helmet wearing rate by riders of motorised two-wheelers is high at 99%. Use of the helmet has been compulsory since 1985 when the transit law was published.
For cyclists, wearing helmets has been required from 2005, but just in urban areas.
% 2014 2015 Front seat Driver 78 76 Passenger 62 59 Rear seats General 15 15
Table 8.5. Seat belt wearing rate by car occupancy and road type
National road safety strategies and targets
Organisation of road safety
CONASET is an interministerial body created as a presidential advisory commission through Supreme Decree 223, of 27 December 1993.
CONASET has a board of 10 ministers (Ministry of Interior Affairs, Ministry of the General Secretariat of the Presidency, Ministry General Secretariat of Government, Ministry of Education, Ministry of Justice, Ministry of Public Works, Ministry of Health, Ministry of Housing and Urban Development, Ministry of Labour and Ministry of Transportation) plus the National Police Director. CONASET is led by the Minister of Transportation and CONASET's Executive Secretary is in charge of the National Road Safety Strategy, which is agreed by the board.
In 1993, CONASET began working on a framework policy declaration, which has served as the general strategic guide.
Road safety strategy for 2011-2020
The Chilean Government has launched an ambitious development agenda that is the basis for the country's ultimate goal of achieving a high-income developed status by 2018. Chile is a leading country in the Latin American region but lags behind standards of the Organisation for Economic Co-operation and Development (OECD) for the Human Opportunity Index. In this context, it is important to achieve greater competitiveness and to improve the quality of road safety.
Chile is currently developing a new National Road Safety Strategy, which will be based on the five pillars of the Global Plan for the Decade of Action for Road Safety 2011-20. In particular, the focus of the new strategy will be on institutional strengthening, speed enforcement, safer new and older vehicles, strengthening the protection of vulnerable road users and a complete revision of the national post road crashes protocol.
Road safety targets
In 2011, Chile established its first ever road safety target: a 20% decrease in the number of road deaths by 2014 (to 1 636 fatalities or fewer) compared to the level of 2011.
Monitoring targets
In 2014, there were 2 119 road fatalities. The target was not reached.
In 2015 a special evaluation was made for the first half of the decade. Its results will guide the elaboration of the new strategy. In particular, the evaluation highlighted the need to develop safety plans for the most vulnerable road users, including children, teenagers and motorcyclists.
Recent safety measures (2013-16)
Road safety management
Road users
Driving license
- The new practical exam for vehicle drivers requires candidates to demonstrate their ability to drive safely and does not only evaluate a set of determined manoeuvres.
- Since 2014, the knowledge exam can be also taken in English throughout all of Chile.
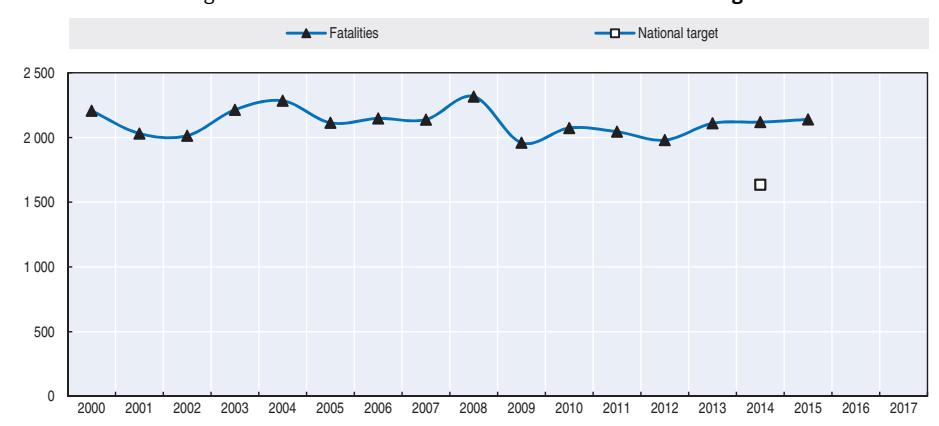
Figure 8.6. Trends in road fatalities towards national target
- In order to educate citizens on the benefits of eco-driving, this topic was included in the knowledge exam from 2015.
- CONASET developed a handbook (Libro del Nuevo Conductor) to help candidates study for their tests.
Pedestrians
● In Chile, pedestrians account for nearly 40% of all road fatalities. They remain a target for awareness campaigns which focus on respect, self-care and civic coexistence to improve people's quality of life (More information can be found at.Motorcycle) www.conaset.cl/todos-so.Motorcycle)mospeatones/).
Motorcycle ro.Motorcycle)ad safety plan
- The Motorcycle Road Safety plan was launched in 2014. This plan contains 35 measures including short, medium and long term initiatives.
- A first measure of the plan, introduced in August 2015, is the implementation of "Motobox". This consists of a demarcation area at intersections with traffic lights, allowing motorcyclists to move off as soon as the green light is displayed, ahead of the rest of the traffic.
- A new, more rigorous, driving test for motorcyclists is being developed. The test will consist of a series of manoeuvres on a closed circuit designed to assess the ability of the motorcyclist to manoeuvre the motorcycle.
- Another initiative is the re-categorisation of the current motorcycle license into 3 levels. The objective is to enable new motorcycle riders to gradually qualify to ride more powerful motorcycles, preventing potential accidents with inexperienced riders.
Children and teenagers road safety plan
● In Chile, road crashes are the first cause of death for children between 1 and 14 years of age. To demonstrate the urgent need to improve road safety in this area, Chile joined the UN's #SaveKidsLives initiative and started to develop a road safety plan for children and teenagers. The plan was based on consultation with citizens, parents and children throughout Chile and will be presented during the first half of 2016.
Speed management
- Speed enforcement is carried out by the Chilean police (Carabineros de Chile) and inspectors of the Ministry of Public Works on road sides. Given the limited resources and the very widespread road network, the chances of being checked for speed are very low. Taking into account the successful experiences of other countries, the government of Chile has decided to launch a programme for the progressive implementation of automatic speed enforcement throughout the country. This programme will take the form of an automated centre for the treatment of speed infractions (CATI in Spanish) that will operate radars to enforce speed compliance. The creation of this centre is part of a bill currently in congress.
- In August 2015 the Ministry of Transportation and Telecommunications submitted a bill to congress that proposes reducing urban speed limits from 60 to 50 km/h. In 2002, the speed limit was increased to 60 km/h and the following year crashes in urban areas increased, as well as fatalities (by 25%).
Road safety education and campaigns
- In the last three years CONASET in collaboration with the Ministry of Education has added road safety activities to primary school programs.
- CONASET is continuously developing road safety awareness campaigns. In 2015, the most relevant campaigns were "Desacelérate" (Decelerate) that focused on reducing speed and "La Consentida" for improving awareness of the problem of drink driving during the Chilean Independence Day holiday. There were renewed efforts to reinforce the importance of the use of the seat belts in the campaign "Solo un click" (Just one click). Child safety was another relevant matter covered by the campaign "Niños Seguros" (Security for our Children) initiative where both children and parents from different cities across the country participated in dialogues about the importance of safety when using various means of transport. This campaign is aligned with the international #SaveKidsLives campaign.
- More about campaigns from CONASET can be found at www.youtube.com/user/Manejateporlavida.
Vehicles
Recent improvements to vehicle safety include:
- mandatory frontal airbags (for drivers and passengers) on new light vehicles sold in Chile (2015)
- ISOFIX or LATCH anchoring systems for vehicles of 2 700 kg or less to simplify correct installation of child restraint systems without the need of seat belts (2014)
- reflective vests in cars starting as of January 2016 (2014)
- increased safety requirements for motorcycles, including standards for motorcycle features in line with international regulations (2014)
- new safety devices for interurban buses, such as Antilock Brake Systems, Electronic Stability Control, rear fog light, back-up alarm (2013)
- an audible alarm for non-use of seat belts in new cars (2013)
Recent and ongoing research
- A speed survey was carried out in 2014 and 2015 on different road types of Chile. Speed data was collected by radars continuously for 24 hours a day, seven days a week at 50 control points. In short, the data showed that 5 out of 10 drivers exceed speed limits in intercity roads and 4 out of 10 exceed the limits in urban roads.
- Behavioural studies were conducted in 10 cities in 2013 and 2014, focusing on seat belt use, helmet use and distracted driving by car or motorcycle drivers. These studies showed that 77% of drivers and 62% of the front seat passengers use their seat belt and that the use of helmets in motorcyclists and passengers is up to 99%. The study also showed that 14% of car drivers get distracted using their cell phones, while just 1% of the motorcyclists use their phones when they are driving. A similar study was undertaken in 2015, with coverage in 89 cities around the country and more than 80 000 observed cases. In addition, this study integrated the subject of child restraint systems use in detail. This research is now under analysis.
References
Websites
- National Road Safety Commission CONASET: www.conaset.cl.
- Ministry of Transport and Telecommunications : www.mtt.gob.cl.
Chapter 9
Czech Republic
This chapter presents 2014 road safety data for the Czech Republic along with provisional data from 2015. It looks at trends in traffic and road safety from the years 1990 to 2014 and road user behaviour patterns. This includes data on speed, drink driving, drugs and driving, distracted driving, fatigue and seat belt usage. The chapter reviews the Czech Republic's road safety strategy and national targets to 2020 and the progress achieved thus far. It also looks at ongoing research and recently implemented safety measures.*
* All data stem from CDV (Centrum dopravního výzkumu: Czech Transport Research Centre) and IRTAD unless otherwise noted. For more information please contact: jan.tecl@cdv.cz
Between 1994 and 2014, the overall number of road deaths in the Czech Republic decreased by 58%. This comes as the result of successive national strategic safety plans. The fatality rate in 2014 reached 6.5 per 100 000 inhabitants. However, fatality rates among young people are still higher than the overall average. In 2014, the death rate for the 18-20 year old group was 13.9 and that for 21-24 year old group was 10.3. The increased fatalities seen in 2014 and 2015 highlight the need for increased traffic enforcement, a strengthened driver licensing system, improved traffic education and infrastructure audits and inspections, especially at railway crossings.
Road safety data collection
Definitions applied in the Czech Republic
- Road fatality: Person who died immediately after the crash or within the next 30 days. (Note: this is fully applied for international data comparison, but for domestic purposes, a road fatality often refers to a person who died immediately or within 24 hours).
- Serious injury: Injury severity is determined through the opinion of the physician at the scene of the crash or later in hospital (within 24 hours of the crash). A serious injury is one considered to cause serious harm to health. At present, the severity value based on a score of three or more on the Maximum Abbreviated Injury Scale (MAIS3+) is not in general use in accident registration, and its future utilisation is yet to be decided.
Data collection
Crash data in the Czech Republic are collected by traffic police in 80 districts and transferred to the police headquarters. Data are checked both at district and central levels.
Crash reporting rates in the police database are relatively high due the legal obligation that all crashes with a death, injury or material damage over CZK 100 000 (since 2009) have to be reported to and registered by the police.
Most recent safety data
Road crashes in 2015 – provisional data
Based on provisional data, there were 732 reported road fatalities in 2015, a 6.4% increase when compared to 2014. The number of injury crashes increased by 2.4%. For the second consecutive year, the goals of the national road safety strategy were not reached.
The number of fatalities increased significantly on rural roads (+13% fatalities) and on motorways (+28%). There was an increase of 24% in the number of cyclists killed and of 15% in the number of pedestrians killed.
Due to the poor performance seen in 2014 and 2015, there is an urgent need to implement new and effective road safety measures and to bring radical changes to the current road safety management system. Based on analyses of 2014 and 2015 data, it is particularly important to increase traffic enforcement, strengthen the driver licensing system, improve traffic education and undertake infrastructure audits and inspections, especially at railway crossings.
Road crashes in 2014
In 2014, there were 688 road fatalities, a 5.2% increase from 2013. The number of injury crashes increased by 3.5%.
Between 2013 and 2014, fatalities increased among groups using powered two-wheelers and car occupants. Fatalities decreased among cyclists and pedestrians.
Trends in traffic and road safety (1990-2014)
Traffic
Since 1990, the number of motorised vehicles has increased by more than 60%. The traffic (in terms of vehicle-kilometres) more than doubled between 1990 and 2009, but stagnation was observed in the following years.
The traffic of heavy goods vehicles increased gradually after 1990 with the development of the new market economy. During the economic recession vehicle-kilometres stagnated in 2007-08 and then dropped after 2009 (partially due to a change of methodology in registering trucks and trailers).
Road safety
Crashes and casualties
The number of fatalities peaked in 1969 and steadily decreased until 1986. Between 1986 and 1994, there was a rapid deterioration of road safety and road deaths increased by 82%. This corresponded to a period of important political changes in the Czech Republic and other Eastern European countries following the fall of the Soviet bloc. During this period, the number of motorised vehicles increased sharply in a context of weak police control and less political attention to road safety.
Between 1994 and 2014, the number of road deaths decreased by 58% and that of injury crashes also decreased by 24%. These good results are the fruit of successive national strategic safety plans.
Rates
Between 1994 and 2014, fatalities per 100 000 inhabitants decreased by 59%, reaching 6.5 in 2014.
Analysis of seriously injured data
Reducing the number of persons seriously injured is the second target of the national road safety strategy. Unfortunately, it is not yet possible to estimate the number of persons injured based on the MAIS classification. Based on the current definition, the number of persons seriously injured decreased by 8.7% to 2 468 between 2014 and 2015 achieving one part of the strategic road safety programme.
Road safety by user group
Since 2000, all user groups except mopeds riders, whose figure is too small for a meaningful interpretation, have benefited from safety improvements. Strengthened enforcement and education within the national strategic safety plan contributed to these good results in the first period of the safety plan.
Table 9.1. Road safety and traffic data
| 2014 % change from | |||||||||
|---|---|---|---|---|---|---|---|---|---|
| 1990 | 2000 | 2010 | 2013 | 2014 | 2013 | 2010 | 2000 | 1990 | |
| Reported safety data | |||||||||
| Fatalities | 1 291 | 1 486 | 802 | 654 | 688 | 5.2 | -14.2 | -53.7 | -46.7 |
| Injury crashes | 21 910 | 25 445 | 19 676 | 20 342 | 21 054 | 3.5 | 7.0 | -17.3 | -3.9 |
| Deaths per 100 000 inhabitants | 12.5 | 14.5 | 7.7 | 6.2 | 6.5 | 5.2 | -14.6 | -54.7 | -47.5 |
| Deaths per 10 000 registered vehicles | 3.3 | 3.2 | 1.3 | 1.0 | 1.1 | 5.3 | -18.8 | -66.3 | -67.0 |
| Deaths per billion vehicle kilometres | 48.3 | 36.7 | 16.2 | na | na | na | na | ||
| Traffic data | |||||||||
| Registered vehicles1 (thousands) | 3 933 | 4 636 | 6 021 | 6 369 | 6 360 | -0.1 | 5.6 | 37.2 | 61.7 |
| Vehicle kilometres (millions) | 26 710 | 40 480 | 49 434 | na | na | na | na | ||
| Registered vehicles per 1 000 inhabitants | 380 | 451 | 576 | 606 | 605 | -0.1 | 5.1 | 34.1 | 59.4 |
1. Registered vehicles include mopeds.
1 2 http://dx.doi.org/10.1787/888933385403
Figure 9.1. Road safety, traffic and GDP trends index 1990 = 100
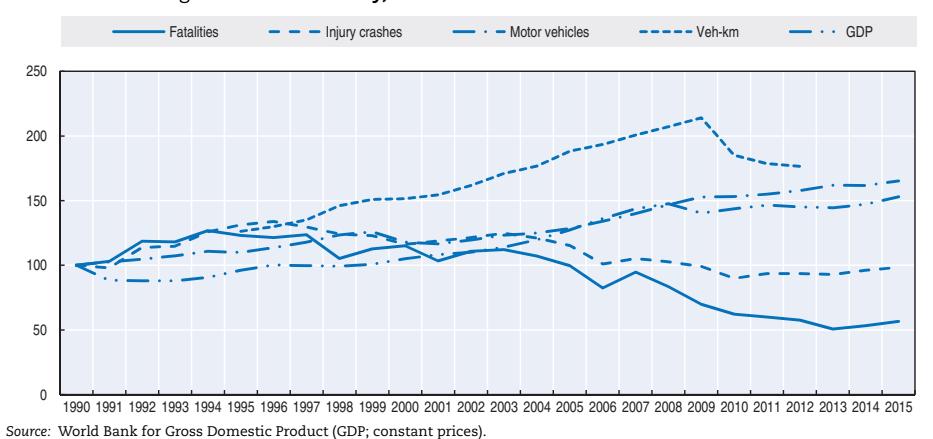
In 2014, the number of fatalities increased among car occupants and motorcyclists. The number of cyclists and pedestrians killed decreased. However, based on provisional data for 2015, there was a sharp increase in the number of cyclists (+24%) and pedestrians (+15%) killed. Since 2013, the situation has deteriorated for all road users.
Table 9.2. Road fatalities by road user group
| 1990 | 2010 | 2013 2014 |
2014 % change from | ||||||
|---|---|---|---|---|---|---|---|---|---|
| 2000 | 2013 | 2010 | 2000 | 1990 | |||||
| Cyclists | 135 | 151 | 80 | 74 | 68 | -8.1 | -15.0 | -55.0 | -49.6 |
| Moped users | 47 | 16 | 4 | 6 | 8 | 33.3 | 100.0 | -50.0 | -83.0 |
| Motorcyclists | 66 | 100 | 95 | 66 | 88 | 33.3 | -7.4 | -12.0 | 33.3 |
| Passenger car occupants | 597 | 784 | 403 | 308 | 347 | 12.7 | -13.9 | -55.7 | -41.9 |
| Pedestrians | 359 | 362 | 168 | 162 | 130 | -19.8 | -22.6 | -64.1 | -63.8 |
| Others | 87 | 73 | 52 | 38 | 47 | 23.7 | -9.6 | -35.6 | -46.0 |
| Total | 1 291 | 1 486 | 802 | 654 | 688 | 5.2 | -14.2 | -53.7 | -46.7 |
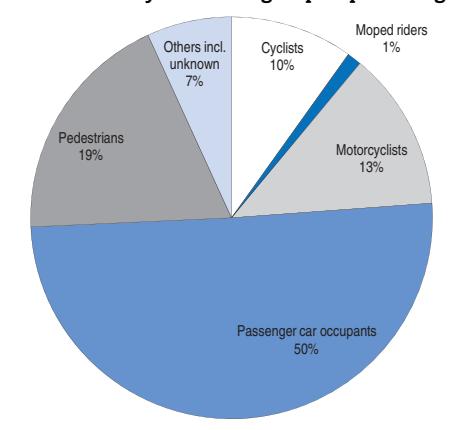
Figure 9.2. Road fatalities by road user group in percentage of total 2014
Road safety by age group
Since 1990, the reduction in fatalities has benefited all age groups, with the highest reduction for children and young people. However, in 2014 fatalities increased among 15-20 years old and 15-64 years old group.
Young people (18-24) have a risk well over the average of 6.5 road deaths per 100 000 inhabitants in 2014. In 2014, the death rate for the 18-20 year old group was 13.9 and that for 21-24 year old group was 10.3.
| | | 2000 | | | 2014 | 2014 % change from | | | | |
|-------|-------|-------|------|------|------|----------------------------------------------------------|-------|-------|-------|--|
| Age | 1990 | | 2010 | 2013 | | 2013 | 2010 | 2000 | 1990 | |
| 0-5 | 16 | 13 | 7 | 7 | 6 | Figures too small
for a meaningful
comparison in % | | -53.8 | -62.5 | |
| 6-9 | 25 | 17 | 3 | 2 | 3 | | | -82.4 | -88.0 | |
| 10-14 | 18 | 24 | 7 | 2 | 5 | | | -79.2 | -72.2 | |
| 15-17 | 57 | 44 | 17 | 10 | 11 | 10.0 | -35.3 | -75.0 | -80.7 | |
| 18-20 | 107 | 103 | 51 | 32 | 46 | 43.8 | -9.8 | -55.3 | -57.0 | |
| 21-24 | 123 | 155 | 74 | 64 | 54 | -15.6 | -27.0 | -65.2 | -56.1 | |
| 25-64 | 668 | 881 | 471 | 378 | 430 | 13.8 | -8.7 | -51.2 | -35.6 | |
| 65 | 270 | 243 | 164 | 155 | 131 | -15.5 | -20.1 | -46.1 | -51.5 | |
| Total | 1 291 | 1 486 | 802 | 654 | 688 | 5.2 | -14.2 | -53.7 | -46.7 | |
Table 9.3. Road fatalities by age group
Road safety by road type
Since 1990, the greatest reduction in fatalities has occurred on urban roads (-65%), while improvement on rural roads has been less marked (-28%). Improvements on urban roads are related to the introduction of the 50 km/h speed limit, the extension of 30 km/h zones, and the widespread introduction of traffic-calming measures. Since 2000, fatalities decreased by 62% on urban roads and 48% on rural roads. However, in 2014, the fatalities increased on rural roads (+ 11 %). According to provisional data, there was a sharp increase in the number of fatalities on rural roads (+13%) and motorways (+28%) in 2015.
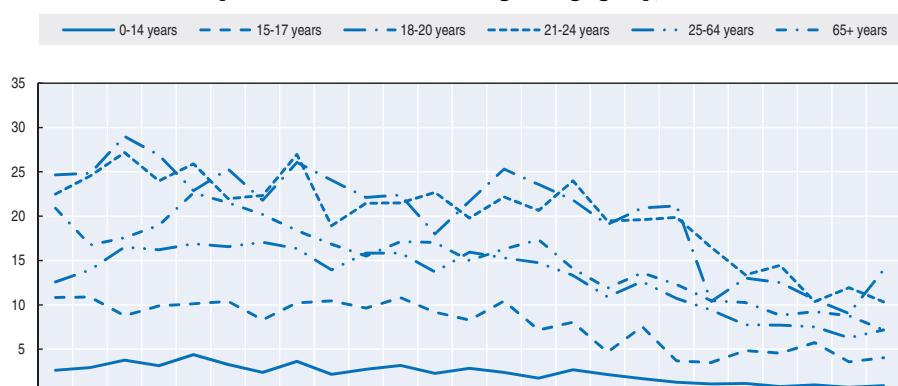
Figure 9.3. Road fatality rates by age group Deaths per 100 000 inhabitants in a given age group, 1990-2014
Figure 9.4. Road fatality rate by age and road user group Fatalities per 100 000 inhabitants, 2014
1990 1991 1992 1993 1994 1995 1996 1997 1998 1999 2000 2001 2002 2003 2004 2005 2006 2007 2008 2009 2010 2011 2012 2013 2014
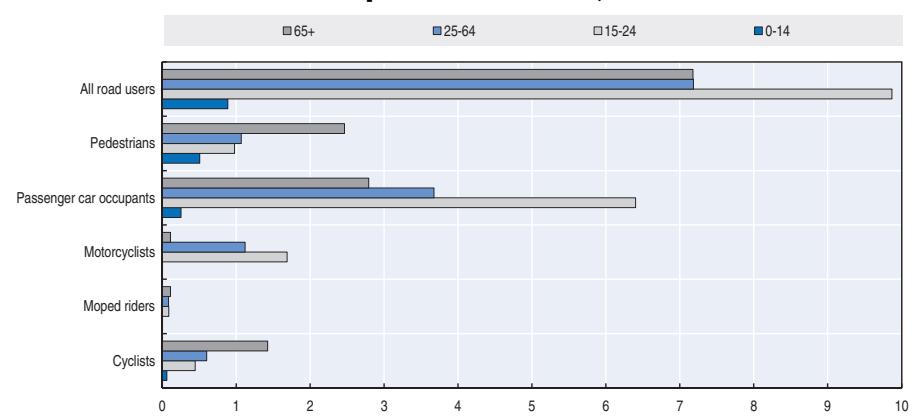
It should be noted that as of 1 January 2016, expressways are classified as motorways. The length of the motorway network therefore increased from 776 km to 1 235 km.
Economic costs of traffic crashes
Economic costs engendered by road crashes are evaluated by the human capital approach. They are composed of direct costs (chiefly medical care, rescue service, police and justice) and indirect costs (lost value of economic productivity due to ill health, disability, or premature mortality, and social expenses).
The economic costs of crashes for the Czech Republic are published every year. For 2014, they were estimated at EUR 2 billion, or 1.4 % of GDP.
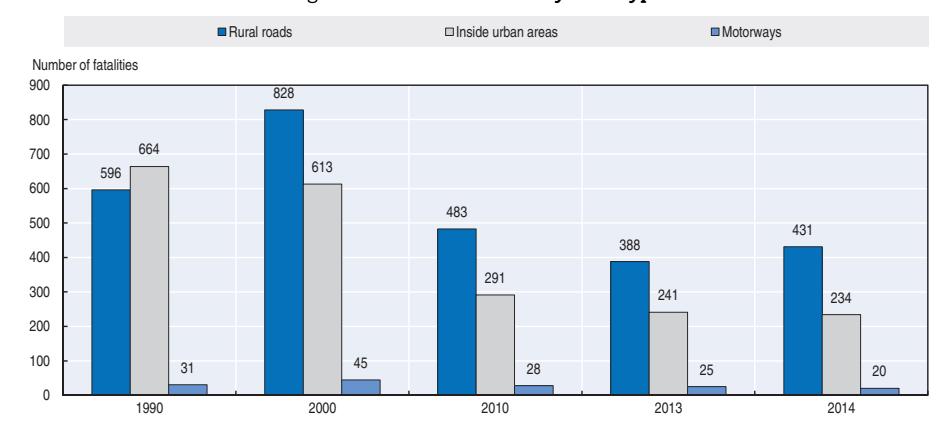
Figure 9.5. Road fatalities by road type
Table 9.4. Costs of road crashes, 2014
| General speed limit | |
|---|---|
| Urban roads | 50 km/h |
| Rural roads | 90 km/h |
| Motorways | 130 km/h |
Recent trends in road user behaviour
Speed
Speeding is the main contributing factor in fatal crashes, although the number of drivers above the legal speed limit has decreased, especially in urban areas. The share of fatal crashes due to excessive speed was 33% in 1980, 40% in 2000 and also 40% in 2014.
Average speed, 85th percentile speed and the percentage of drivers above the speed limit have been monitored regularly since 2005. The introduction of a demerit point system in 2006 resulted in a reduction in the number of drivers above the limit, but this share increased again in 2010.
The table below summarises the main speed limits in the Czech Republic.
Table 9.5. Passenger car speed limits by road type, 2016
| Unit cost | Total | |
|---|---|---|
| Fatalities | EUR 758 399 | EUR 521.8 million |
| Hospitalised persons | EUR 184 833 | EUR 499.6 million |
| Slight injuries | EUR 15 581 | EUR 368.6 million |
| Property damage costs | EUR 9 516 | EUR 616.7 million |
| Total | EUR 2.0 billion | |
| Total as % of GDP | 1.3% |
Drink driving
There is a zero blood alcohol content (BAC) limit in the Czech Republic. When police arrive at the scene of a crash, all persons involved are checked for BAC. If the BAC level of anyone involved is positive, the crash is classified as alcohol-related.
In 2002, 11% of fatalities were due to alcohol related crashes. This proportion decreased to 3.4% in 2007, and then increased again to 14% in 2010 (probably due to a change in the investigation procedure). In 2014, it is estimated that 10% of road fatalities were alcohol related crashes.
Drugs and driving
Drug use is forbidden while driving. The share of fatal crashes due to a driver under the influence of drugs was estimated at 0.9% in 2014.
A crash is defined as drug related if the driver tests positive for drug consumption.
Distraction
In the Czech Republic, drivers are not allowed to drive while using a hand-held phone or other electronic device such as a Personal Digital Assistant (PDA). Hands-free devices are tolerated. In 2014, it was estimated that 2.7% of drivers used a mobile phone while driving.
Sleepiness and fatigue
In 2014, it was estimated that about 2.1% of crashes were due to fatigue.
Seat belts and helmets
Seat belt use has been compulsory in front seats since 1966 and in rear seats since 1975. However, until recently the level of enforcement was very low. The situation has significantly improved since 2004.
Dedicated child restraints are compulsory for children between 0 and 3 years old, and for children 4 and above who are less than 150 cm in height or 36 kg in weight.
In 2014, 32% of car occupants killed were not wearing a seat belt when the crash occurred. It is estimated that 90 lives could have been saved if all car occupants had worn seat belts.
| % | |||
|---|---|---|---|
| 2000 | 2012 | 2014 | |
| Front seat | |||
| General (driver + passengers) | 63 | 97 | 93 |
| Driver | 97 | 93 | |
| Passenger | 96 | 94 | |
| Urban roads (driver) | 46 | 98 | 93 |
| Rural roads (driver) | 62 | 96 | 94 |
| Motorways (driver) | 81 | ||
| Rear seats | |||
| General | 88 | 93 | |
| Children (use of child restraint) | 98 |
Table 9.6. Seat belt wearing rate by car occupancy and road type
Helmet-wearing is compulsory for all motorcycle and moped riders and the wearing rate is nearly 100%. Safety helmets were made mandatory for cyclists up to the age of 15 in 2001 and up to 18 in 2006. The compulsory wearing of helmets for all cyclists is under discussion.
National road safety strategies and targets
Organisation of road safety
BESIP (Bezpečnost silničního provozu), an independent department of the Ministry of Transport, is the main co-ordinating body for road traffic in the Czech Republic. BESIP is responsible for the National Road Safety Strategy for 2011-2020. The other key player is the Government Council of Road Traffic Safety (composed of representatives of parliament, ministries, civil associations, professional organisations and the private sector). There are also 14 regional BESIP co-ordinators.
Road safety strategy for 2011-20
The main target of the National Road Safety Strategic Plan for the years 2011-20 is to decrease the fatality rate (deaths per 100 000 inhabitants) to the European average. This corresponds approximately to a 60% reduction in fatalities by 2020 compared to 2009. The second target is a reduction by 40% in the number of persons seriously injured.
Monitoring targets
Interim targets for the number of fatalities and persons seriously injured have been set for each year until 2020. Results are monitored annually by the BESIP for the Government Council of Road Traffic Safety at national and regional levels. Other safety indicators (speed, drink driving, drug driving, use of seat belts and helmets, and use of mobile phone while driving) are also regularly monitored.
While the country was on track in 2013, the interim target for 2014 (fewer than 594 road fatalities) was not achieved as 688 people were killed. In 2015, the interim target was again not reached (732 fatalities against 547 targeted).
New measures are needed to get back on track towards the 2020 target, including more enforcement, traffic education, a strengthened driving license system, traffic infrastructure audit and inspection, the penetration of safer vehicles into the fleet, etc.
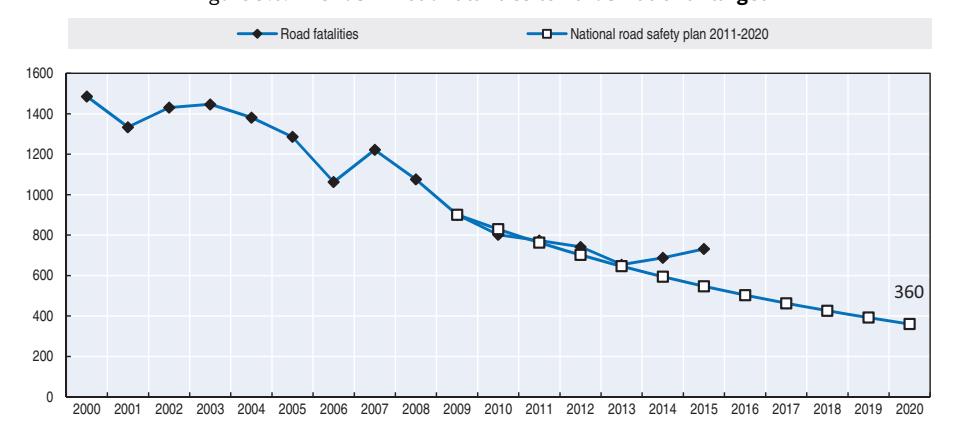
Figure 9.6. Trends in road fatalities towards national target
ROAD SAFETY ANNUAL REPORT 2016 © OECD/ITF 2016 141
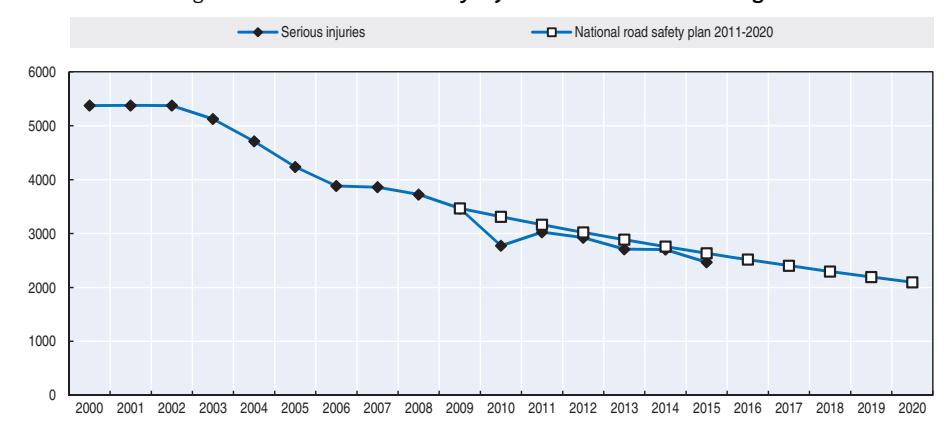
Figure 9.7. Trends in seriously injured towards national target
Recent safety measures (2013-16)
Road safety management
- Since 2014, the new civil code includes an article regarding higher financial compensation from the guilty drivers to the crash victim.
- The improvement of the penalty point system is under discussion.
- Traffic enforcement is being intensified.
Road users
Speed management
● Mobile speed cameras are being deployed.
Protective equipment
● The compulsory use of helmets by all cyclists is under discussion.
Traffic control
● Systems to detect right-of-way violations are being implemented.
Education and awareness
- Work is underway to implement an improved curriculum in driving schools.
- Since 2013, there is a new system of traffic education in schools.
Infrastructure
- Since 1 January 2016, the road network has been reclassified. All expressways were reclassified as motorways. Therefore the length of the motorway network increased from 776 km to 1 235 km.
- Road safety audits and inspections and road infrastructure assessments are being conducted.
- Traffic calming measures are being implemented.
- Safety improvement of railway crossings has become a priority.
Vehicles
● Discussions are underway for Antilock Braking Systems (ABS) and Electronic Stability Control (ESC) to become standard equipment in new vehicles.
Recent and ongoing research
Some research projects of CDV are presented below:
- in-depth accident analysis
- road infrastructure assessment
- safety improvement of railways crossings
- prediction models of accidents
- human factor analysis.
References
Websites
- CDV, Transport Research Centre: www.cdv.cz.
- Ministry of Transport: www.mdcr.cz.
- Police of the Czech Republic: www.policie.cz.
- Road safety observatory: www.czrso.cz.
- In-depth accidents analysis: http://hadn.cdvinfo.cz.
- Road traffic infrastructure improvement: http://veobez.cdvinfo.cz.
Chapter 10
Denmark
This chapter presents 2014 road safety data for Denmark along with provisional data from 2015. It looks at trends in traffic and road safety from the years 1990 to 2014 and road user behaviour patterns. This includes data on speed, drink driving, drugs and driving, distracted driving, fatigue and seat belt usage. The chapter reviews the Danish road safety strategy and national targets to 2020 and the progress achieved thus far along with current and ongoing research.*
* All data stem from the Danish Road Directorate and IRTAD unless otherwise noted. For more information please contact: Stig R. Hemdorff, Traffic Safety Department, Road Directorate, srh@vd.dk.
In 2014, Denmark recorded 182 road deaths, a 4.7% decrease compared to 2013. Injury crashes also decreased by 3.5%. Preliminary data from 2015 seem to indicate very similar figures with around 180 fatalities. This is equivalent to a rate of 3.2 fatalities per 100 000 inhabitants, making Denmark one of the top performers in road safety. Car occupants still have the largest share of fatalities, although an increase in cycling and the use of E-bikes by the older population means that vulnerable users are more at risk than previously.
Road safety data collection
Definitions applied in Denmark
- Road fatality: Person who dies within 30 days as a result of a traffic crash.
- Seriously injured persons: Those included in the police report under bodily injury and any type of injury other than "minor injuries only".
- Slightly injured persons: Persons suffering from minor injuries only.
Data collection
Traffic crash data are collected by the police using a common national system. Data are transferred to the Road Directorate every week. These data contain preliminary and final information. Final information about a crash should be sent within six weeks following the incident. This, however, is not always the case. In particular, information about alcohol level awaiting laboratory analysis might delay the process.
In the Danish system, there are more than 90 different parameters for crash data. Some may be subjective. For example, "speed driven before the crash" is filled in by the police officer on the basis of witness statements. More accurate speed information is obtained when investigating fatal accidents or others chosen for in-depth study.
Serious injuries data are based solely on police reports, and the severity of injuries is based upon the judgement of the police officer. A hospital may be contacted to obtain additional information, but there is no systematic linkage with hospital data. Currently, a linking procedure is not possible as the Danish hospital registration system does not include the Abbreviated Injury Scale (AIS) score of patients; only diagnosis codes are included. Denmark is working on a process to convert diagnosis codes into AIS and Maximum Abbreviated Injury Scale (MAIS) scores.
Details of traffic-related casualties are recorded in the national patient register. Information from the national patient register reveals that the real number of injury crashes is much higher than those recorded by the police. Injuries to vulnerable road users are particularly under-reported in the police records.
The weakness of the national patient register is that there is little information on the accident compared to police records. For example, there is little indication on the crash location and no information on vehicle occupancy.
Systematic nationwide use of Accident & Emergency (A&E) department data in addition to the more detailed information from the police would provide a better basis for making decisions. To achieve this, A&E departments would need to include details of the degree of injury in their records, which would allow the conversion of diagnosis codes into injury severity codes. This would require substantial additional resources in A&E departments for recording, training and quality assurance of the data.
Most recent safety data
Road crashes in 2015 – provisional data
The preliminary data for 2015 show a similar level to that of 2014. For the moment the preliminary number of fatalities is about 180, the number of injuries around 3 000 and number of injury accidents about 2 900.
Road crashes in 2014
In 2014, there were 182 road deaths, a 4.7% decrease compared to 2013. Injury crashes decreased by 3.5%.
In 2014, fatalities increased among motorised vehicle users like mopeds, motorcyclists and passenger car occupants, but the increase is smaller than the reduction in pedestrian fatalities. There were slight increases in road deaths among 21-24 year olds and the 65+ age group.
Trends in traffic and road safety (1990-2014)
Traffic
Between 1990 and 2014, the number of motorised vehicles increased by 44%; the overall vehicle kilometres driven increased by around 39%.
In 2014, the overall number of motorised vehicles and traffic volume increased by 2.5% over 2013.
Road safety
Crashes and casualties
The fewest road deaths in Denmark since registration started in the 1930s occurred in 2012, with 167 deaths. Between 1990 and 2012, the number of fatalities decreased by nearly 70%. In 2008-12, the reduction in fatalities accelerated, with a nearly 60% reduction. In 2009, there was a 25% decrease in the number of road deaths over 2008, a phenomenon which cannot really be explained.
Effective safety measures, tough winter conditions in 2010 and 2011, and possibly the economic downturn might explain this sharp decrease in fatalities. There are also indications that although mean speeds have decreased only slightly, the top speeds have reduced more significantly. This may be more related to saving fuel, which became more expensive. Finally, the penetration of new vehicles with advanced safety equipment into the fleet has also had a positive impact.
The year 2013 saw an increase in road deaths, but in 2014 the trend was downward once again.
Rates
Since 2000, both the mortality rate (expressed in deaths per 100 000 inhabitants) and the fatality risk (expressed in deaths per billion vehicle-kilometres) have decreased by about 65%. In 2012, Denmark had a mortality rate of 3.0 per 100 000 inhabitants, one of the lowest rates among countries in the Organisation for Economic Development and Co-operation (OECD). The rate slightly increased to 3.4 in 2013, but it decreased to 3.2 in 2014.
Analysis of seriously injured data
Table 10.1. Road safety and traffic data
| 2014 % change from | |||||||||
|---|---|---|---|---|---|---|---|---|---|
| 1990 | 2000 | 2010 | 2013 | 2014 | 2013 | 2010 | 2000 | 1990 | |
| Reported safety data | |||||||||
| Fatalities | 634 | 498 | 255 | 191 | 182 | -4.7 | -28.6 | -63.5 | -71.3 |
| Injury crashes | 9 155 | 7 346 | 3 498 | 2 984 | 2 881 | -3.5 | -17.6 | -60.8 | -68.5 |
| Injured persons hospitalised | 5 347 | 4 366 | 2 071 | 1 736 | 1 556 | -10.4 | -24.9 | -64.4 | -70.9 |
| Deaths per 100 000 inhabitants | 12.3 | 9.3 | 4.6 | 3.4 | 3.2 | -5.1 | -29.8 | -65.4 | -73.8 |
| Deaths per 10 000 registered vehicles | 2.9 | 2.0 | 0.9 | 0.6 | 0.6 | -5.5 | -30.8 | -69.8 | -79.2 |
| Deaths per billion vehicle kilometres | 17.3 | 10.7 | 5.6 | 3.9 | 3.6 | -7.0 | -36.4 | -66.3 | -79.3 |
| Traffic data | |||||||||
| Registered vehicles1 (thousands) | 2 068 | 2 409 | 2 892 | 2 957 | 2 982 | 0.8 | 3.1 | 23.8 | 44.2 |
| Vehicle kilometres (millions) | 36 600 | 46 753 | 45 432 | 49 451 | 50 692 | 2.5 | 11.6 | 8.4 | 38.5 |
| Registered vehicles per 1 000 inhabitants | 403 | 452 | 523 | 528 | 530 | 0.4 | 1.4 | 17.3 | 31.6 |
1. Registered vehicles excluding mopeds.
1 2 http://dx.doi.org/10.1787/888933385410
Figure 10.1. Road safety, traffic and GDP trends index 1990 = 100
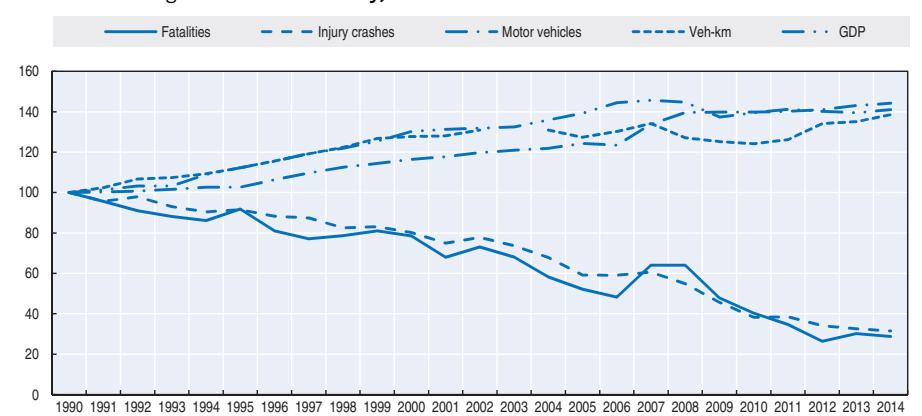
Source: World Bank for Gross Domestic Product (GDP; constant prices).
Road safety by user group
Looking at those killed and injured by road user group there has been a steady decrease for cars and mopeds since the end of 2004. For pedestrians and cyclists there has been a decrease up until the beginning of 2013 after which it levelled out. For motorcyclists there has been an increase since the end of 2012. Motorcyclists have seen the least progress since the end of 2004.
In 2014, there was a sharp decrease in pedestrian fatalities from 34 to 22. However, an increasing trend was observed for passenger car occupants.
| 2014 % change from | |||||||||
|---|---|---|---|---|---|---|---|---|---|
| 1990 | 2000 2010 |
2013 | 2014 | 2013 | 2010 | 2000 | 1990 | ||
| Cyclists | 110 | 58 | 26 | 33 | 30 | -9.1 | 15.4 | -48.3 | -72.7 |
| Moped users | 44 | 47 | 11 | 11 | 13 | 18.2 | 18.2 | -72.3 | -70.5 |
| Motorcyclists | 39 | 24 | 22 | 15 | 18 | 20.0 | -18.2 | -25.0 | -53.8 |
| Passenger car occupants | 284 | 239 | 137 | 79 | 89 | 12.7 | -35.0 | -62.8 | -68.7 |
| Pedestrians | 118 | 99 | 44 | 34 | 22 | -35.3 | -50.0 | -77.8 | -81.4 |
| Others | 39 | 31 | 15 | 19 | 10 | -47.4 | -33.3 | -67.7 | -74.4 |
| Total | 634 | 498 | 255 | 191 | 182 | -4.7 | -28.6 | -63.5 | -71.3 |
Table 10.2. Road fatalities by road user group
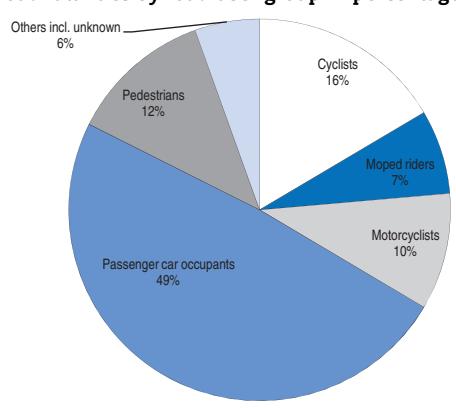
Figure 10.2. Road fatalities by road user group in percentage of total 2014
Road safety by age group
Since 1990, all age groups have shared in the reduction in fatalities. In 2014, fatalities slightly increased among 21-24 year olds and the 65+ age group, but based on the trend in recent decades, it is likely that they decrease in the coming years.
Elderly people are particularly vulnerable as pedestrians and cyclists with a relatively high mortality rate (5.6) compared to other age groups, reflecting the fact that cycling is also a popular transport means among those who are 65 and over. Since 2013, Denmark has seen an increase in the use of E-bikes, in particular among the older population. As a result, the number of fatalities and injuries in the 65+ age group is increasing, although this group still comprises only about 3% of all fatalities and injuries among cyclists.
Road safety by road type
In 2014, 67% of fatalities occurred on rural roads, 25% in urban areas and 8% on motorways. Since 2000, the greatest reduction in fatalities occurred on urban roads (-75%), which can be partly explained by a change in traffic patterns. Another explanation is that automatic speed controls were first introduced in urban areas. In addition, speeds are higher on rural roads, resulting in more severe injuries. It should be noted, however, that the general speed level decreased slightly during 2014.
Table 10.3. Road fatalities by age group
| | | | | 2014 % change from | | | | | | |
|-------|------|------|------|--------------------|------|----------------------------------------------------------|-------|-------|-------|--|
| Age | 1990 | 2000 | 2010 | 2013 | 2014 | 2013 | 2010 | | 1990 | |
| 0-5 | 9 | 8 | 0 | 6 | 2 | | | -75.0 | -77.8 | |
| 6-9 | 15 | 6 | 3 | 3 | 2 | Figures too small
for a meaningful
comparison in % | | -66.7 | -86.7 | |
| 10-14 | 24 | 11 | 6 | 4 | 2 | | | -81.8 | -91.7 | |
| 15-17 | 35 | 30 | 8 | 6 | 3 | | | -90.0 | -91.4 | |
| 18-20 | 46 | 30 | 24 | 14 | 9 | -35.7 | -62.5 | -70.0 | -80.4 | |
| 21-24 | 57 | 55 | 18 | 11 | 13 | 18.2 | -27.8 | -76.4 | -77.2 | |
| 25-64 | 257 | 224 | 129 | 94 | 93 | -1.1
-27.9 | | -58.5 | -63.8 | |
| 65 | 191 | 134 | 67 | 53 | 58 | 9.4 | -13.4 | -56.7 | -69.6 | |
| Total | 634 | 498 | 255 | 191 | 182 | -4.7 | -28.6 | -63.5 | -71.3 | |
Figure 10.3. Road fatality rates by age group Deaths per 100 000 inhabitants in a given age group, 1990-2014
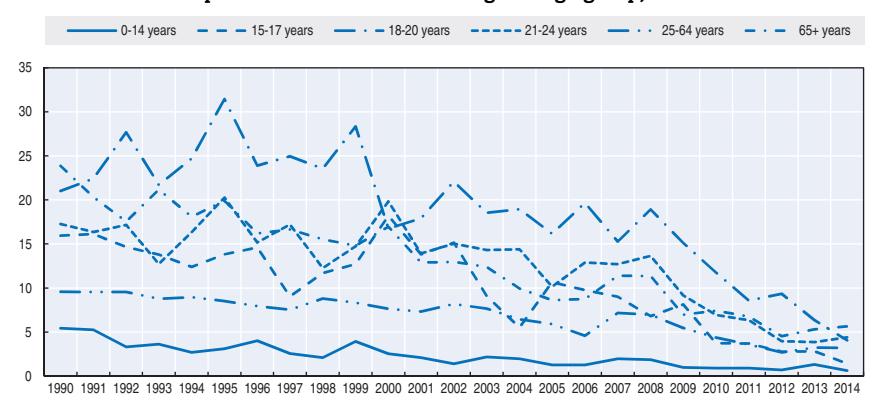
Figure 10.4. Road fatality rate by age and road user group Fatalities per 100 000 inhabitants, 2014
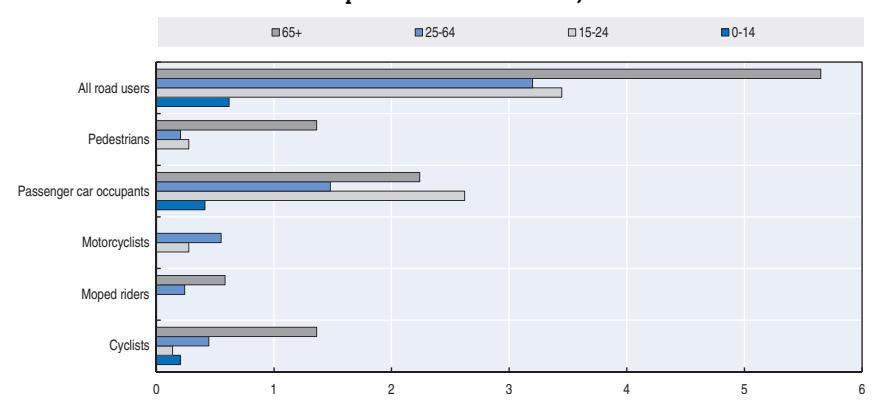
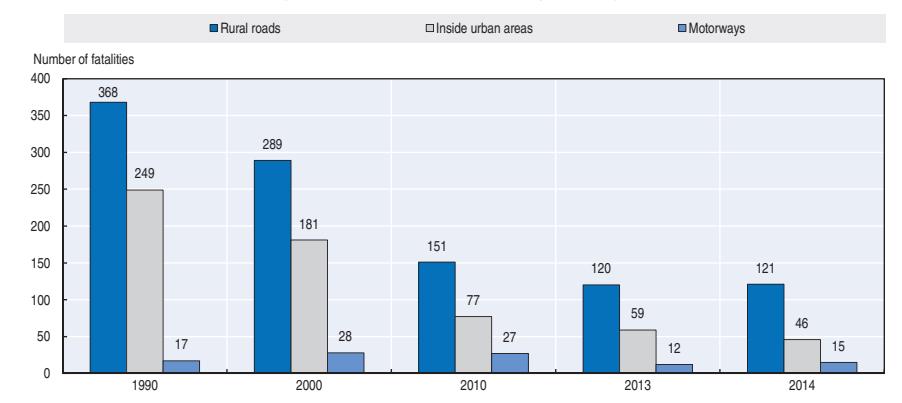
Figure 10.5. Road fatalities by road type
Economic costs of traffic crashes
The socioeconomic costs of road crashes are calculated using so-called transport economic unit prices. These are regularly calculated and updated by the Department of Transport at the Technical University of Denmark.
Unit prices for the socioeconomic costs of road crashes include not only directly measurable expenses – such as hospital and health care charges, the cost of police and emergency services, lost earnings and the costs of material damage – but also the so-called welfare loss, representing a valuation for lost lives and capacity. The welfare loss can be taken as an expression of what road users think it is "worth" to prevent road crashes over and above directly measurable costs (COWI, 2010).
Traffic crashes are estimated on the basis of unit costs for deaths, severely injured persons and slightly injured persons.
In 2010, the cost of traffic crashes was around EUR 1.5 billion.
Table 10.4. Costs of road crashes, 2010
| | Total costs | | |-----------------------------|-----------------------|--| | Fatalities | EUR 600 million | | | Hospitalised persons | EUR 800 million | | | Slight injuries | EUR 100 million | | | Subtotal traffic casualties | | | | Property damage costs | Included in the above | | | Total | EUR 1.5 billion | |
Source: COWI (2010).
Recent trends in road user behaviour
Speed
Speeding is thought to be a contributing factor in around 40% of fatal crashes.
The table below summarises the main speed limits in Denmark. There is no reduced speed limit for young drivers.
Table 10.5. Passenger car speed limits by road type, 2016
| General speed limit | Comments | |
|---|---|---|
| Urban roads | 50 km/h | For heavy vehicles 50 km/h is the maximum limit, even if there is a higher local limit. |
| Rural roads | 80 km/h | |
| Motorways | 130 km/h | About half of the motorway network has a signed speed limit of 110 km/h especially around cities |
The Road Directorate regularly publishes a speed barometer, where the speed development on different road types is monitored. Over time, there is a general decline in the mean speed. There are two specific low points which are due to heavy winter conditions.
Figure 10.6. Development in mean speed by month
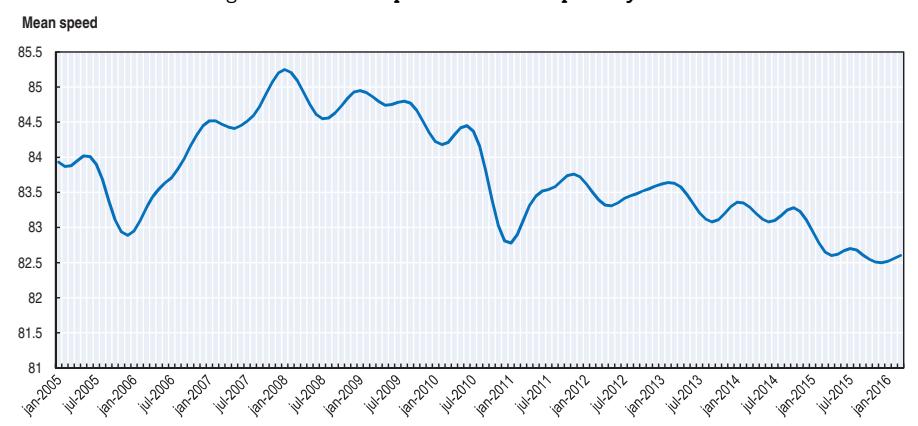
The decrease in mean speed during 2015 and 2016 might be due to the introduction of additional speed cameras.
Drink driving
The maximum authorised blood alcohol content (BAC) is 0.5 g/l for drivers of any motorised vehicle requiring a driving licence (including professional drivers). There is no maximum authorised BAC for cyclists or pedestrians. The penalty is higher for novice drivers who have had their licence for fewer than three years.
Over the past five years alcohol related injury crashes have decreased more than the general decrease. This can be explained to certain extent by ongoing awareness campaigns and a low social acceptance of drunk driving.
Drugs and driving
Since 1 July 2007, the Traffic Act has included a zero tolerance level for driving under the influence of drugs. Since then, there has been an increase in drug-related crashes. This is because before 1 July 2007, police were responsible for proving that the use of drugs had influenced a crash. Police often did not investigate any further or register it in the statistics as drug-related.
Distraction
Distraction is becoming an important factor to be analysed in explaining crash circumstances. In 2014, inattention is thought to have been a contributing factor in 35% of fatal crashes.
The fatal accident investigations and in-depth investigations have shown that distraction is often an issue both inside and outside the vehicle. Therefore external distraction has become a special focus of the new Danish Traffic Safety Action Plan.
Driving while using a hand-held mobile phone is not allowed. The use of hands-free devices is legal.
Sleepiness and fatigue
There is no information available.
Seat belts and helmets
Seat belt use has been compulsory in front seats since the early 1970s and in rear seats since the late 1980s. Rear seat belts are not compulsory in cars made before 1990, and very old cars need not have front seat belts either. Such cars account for a very low share of the Danish car fleet.
Child restraints are also compulsory. Small children, typically up to 3-4 years old have to use special designed "baby-chairs". Children over this age can use a child seat connected to the safety belt. When they reach the height of 140 cm, normal seat belt use is permitted.
Helmets are required to be worn by all motorcycle and moped riders. The compliance rate by motorcyclists was around 97% in 2014. This rate has been constant as of 2006.
There is no mandatory helmet use law for cyclists.
| % | |||
|---|---|---|---|
| 2010 | 2012 | 2014 | |
| Front seat | |||
| General (driver + passengers) | 92 | 94 | 96 |
| Driver | |||
| Passenger | |||
| Urban roads (driver) | 90 | 94 | |
| Rural roads (driver) | 95 | 95 | |
| Motorways (driver) | |||
| Rear seats | |||
| General | 76 | 81 | |
| Children (use of child restraint) |
Table 10.6. Seat belt wearing rate by car occupancy and road type
National road safety strategies and targets
Organisation of road safety
There is no leading agency as such concerning traffic safety in Denmark. The responsibility is in the ministries of transport, justice, interior and health, associated agencies and in the municipalities. Overall, this organisation works well because stakeholders share the same goal and work in close co-operation with each other. The Danish Road Safety Commission is an advisory body working closely with the Danish Road
Safety Council on road safety campaigns. It sets targets and areas for interaction. It does not manage a budget, so it is up to stakeholders to take up the recommendations.
Traffic safety work in Denmark is very locally based.
Road safety strategy for 2011-20
In May 2013, the new Traffic Safety Action Plan was launched with the following slogan "Every accident is one too many – a shared responsibility". The Action Plan includes ten focus areas.
Road safety targets
The Danish Road Safety Commission has set ambitious targets for 2020: no more than 120 deaths, 1 000 serious injuries and 1 000 minor injuries by 2020. This follows the European Union objective to halve the number of fatalities by 2020 in comparison to 2010. This is a more ambitious target than in previous action plans, and the aim is to reach the objective in a shorter timeframe.
Monitoring targets
For each focus areas, a set of suggested measures has been proposed and a performance indicator defined. The 10 focus areas will be reviewed on a regular basis between now and 2020 by establishing measurement points as a basis for necessary actions.
| Focus areas | Indicators |
|---|---|
| 1. Speeding | Proportion of journeys exceeding the speed limit |
| 2. Alcohol and drugs | Number of road users killed and injured in accidents where at least one driver of a motor vehicle has a blood alcohol level over 0.5 g/l |
| 3. Inattention | Proportion of drivers who admit to engaging in distracting actions while driving: |
| 4. Failure to wear seat belts and helmets | Proportion of drivers and passengers who wear seat belts: Proportion of adult cyclists wearing helmets |
| 5. Pedestrians | Number of pedestrians killed and injured |
| 6. Cyclists and moped riders | Number of cyclists and moped riders killed and injured |
| 7. Young drivers under 24 | Number of deaths and injuries in accidents involving at least one car driver under 24 years old |
| 8. Accidents with oncoming traffic | Number of persons killed and injured in accidents with oncoming traffic |
| 9. Single-vehicle accidents | Number of persons killed and injured in single-vehicle accidents |
| 10. Accidents at rural junctions | Number of persons killed and injured in accidents at rural junctions |
Table 10.7. Traffic safety action plan focus areas
Recent and ongoing research
Some research projects are presented below.
- A case study on concordance between self-reported accidents and records by hospital and police: www.trafikdage.dk/papers\_2015/324\_KatrineMeltofte.pdf.
- A Cognitive Analysis of Truck Drivers' Right-hand Turns:
- www.trafikdage.dk/papers\_2015/339\_KristianSletting.pdf.
- Profiling drunk driving recidivists in Denmark:
- http://orbit.dtu.dk/en/publications/profiling-drunk-driving-recidivists-in-denmark(04304505-3852- 4f01-ac94-
2437456b4a).html.
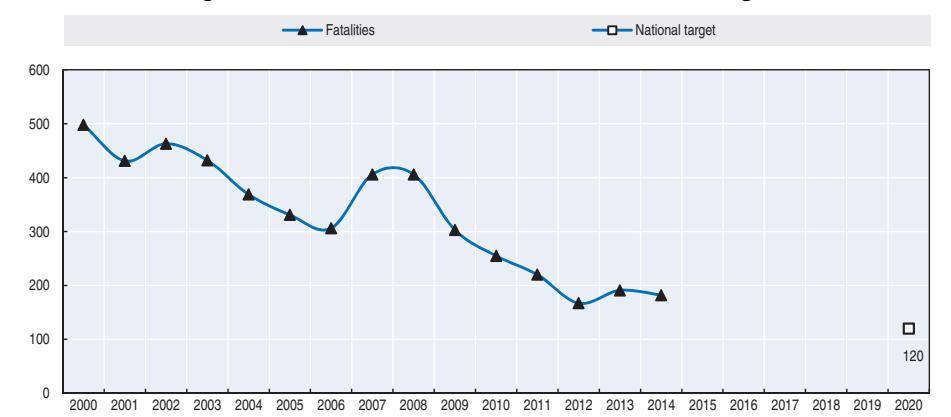
Figure 10.7. Trends in road fatalities towards national target
References
COWI (2010), Værdisætning af transportens eksterne omkostninger (in Danish), COWI and Transportministeriet, Copenhagen, available from www.trm.dk.
Websites
- Danish Road Directorate www.vejdirektoratet.dk.
- Technical University of Denmark www.transport.dtu.dk.
- Aalborg University www.aau.dk/.
- The Danish Road Safety Commission National Action Plan 2013-20 www.faerdselssikkerhedskommissionen. dk/sites/kombelt.dev2.1508test.dk/files/filer/Danish%20National%20Action%20plan%202013-2020 %20%E2%80%9CEvery%20Accident%20is%20one%20too%20many%20%E2%80%93%20a%20shared%20respons ibility.pdf.
Chapter 11
Finland
This chapter presents 2014 road safety data for Finland along with provisional data from 2015. It looks at trends in traffic and road safety from the years 1990 to 2014 and road user behaviour patterns. This includes data on speed, drink driving, drugs and driving, distracted driving, fatigue and seat belt usage. The chapter reviews Finland's road safety strategy and national targets to 2020 and the progress achieved thus far. It also looks at recently implemented safety measures.*
* All data stem from the Finnish Transport Safety Agency (Trafi) and IRTAD unless otherwise noted. For more information please contact: riikka.rajamaki@trafi.fi.
Overall positive safety trend in Finland continued in 2014, showing a decrease in the number of fatalities (-11%) compared to the previous year. The number of injury crashes remained at the same level as 2013. However, while the numbers of fatal crashes involving mopeds, motorcycles and passenger cars have decreased, the number of those killed amongst vulnerable users (cyclists and pedestrians) has increased. The target set for 2014 was nearly met (229 was 10 fatalities above the target). At the current pace, it is estimated that the 2020 target will be reached for injuries but not for fatalities.
Road safety data collection
Definitions applied in Finland
- Road fatality: A person who died immediately in a crash or within the following 30 days. Suicides and presumed suicides are not removed from the statistics.
- Injured person (as defined in police reports): A person not fatally injured in a traffic crash, but requiring medical care or observation in hospital, treatment at home (sick leave) or surgical treatment, such as stitches. Persons who sustain bruises or scratches that do not require the aforementioned treatment are not accounted for as "injured". The classification "injured" is determined by the police officers present at the scene of the crash.
- Seriously injured person: A person who suffers injuries with a score of three or above on the Abbreviated Injury Scale (MAIS3+).
Data on serious injuries have been reported from 2014 onwards and are integrated into the Statistics Finland database. This contains crash data reported by the police, complemented by injury severity information coming from the health care database.
Data collection
Traffic crash data in Finland are collected through two different channels: the police and the insurance companies.
Statistics Finland receives data on road traffic crashes from the police. Local police districts transfer the data to a central register, from which new data are processed and transferred to Statistics Finland three times a month. Statistics Finland verifies the data; make further enquiries to the police districts and, where necessary, supplements the data with data from other registers.
Statistics Finland supplements its annual data with data on deaths derived from statistics on causes of death. The data are also supplemented with information on crash locations from the Finnish Transport Agency's Digiroad information system; data from the Rescue Services' PRONTO statistics on resources and crashes; data on coercive measures from Justice Statistics; and data on fatal drink-driving crashes from the road crash investigation teams. Data on road traffic crashes are also supplemented annually by the Finnish Transport Safety Agency's data on driving licences and motor vehicles.
Statistical coverage of fatal crashes is 100%. Reporting is controlled using death certificates. Due to the comprehensive coverage and severity, the number of traffic fatalities is a more reliable indicator of the trend in road safety than the figure for crashes. Coverage of injury crashes is about 20%. Coverage is worst for cyclists injured in single crashes. Many of the injury crashes are not reported to the police because, in a number of cases, the injuries are slight and compensation is settled between the parties involved.
In addition to statistics based on police reporting, the Traffic Safety Committee of Insurance Companies (VALT) compiles and publishes statistics on crashes investigated by the road crash investigation teams and crashes for which insurance compensation has been paid. The road crash investigation teams investigate nearly all fatal road traffic crashes in Finland. The findings of the teams are assembled into annually published reports, and the data are also used for special studies. The insurance company data are primarily based on information reported by insured policyholders. It is most useful in the case of damage-only crashes, as many minor crashes are reported to the insurance company but not to the police.
Hospitals and health centres also compile statistics on cases of traffic crashes, but the data collected are mainly intended for health-care services and cannot be properly used for traffic safety purposes. These data can be used as supplementary material, as they contain information excluded from other statistics, such as injuries caused in pedestrian and bicycle traffic.
Since 2014, police and hospital data have been linked to facilitate correct estimation of the number of serious injuries (defined as MAIS3+). More information can be found at: http://tieliikenneonnettomuudet.stat.fi/tieliikenneonnettomuudet\_en.html.
Most recent safety data
Road crashes in 2015 – provisional data
Based on provisional data, there were 260 road fatalities in 2015, 31 more than in 2014. This represents a 13% increase in road fatalities in 2015 compared to 2014. The number of reported injury crashes is lower by 3% compared to 2014.
There is no immediate explanation for this increase. Numbers are rather low from a statistical point of view. Nevertheless, it can be noted that traffic volume increased by around 2% on main roads in 2015.
Road crashes in 2014
Overall, a positive safety trend continued in 2014, showing a decrease in the numbers of fatalities (-11%) compared to the previous year. The number of injury crashes remained at the same level as 2013. However, while the numbers of fatal crashes involving mopeds, motorcycles and passenger cars have decreased, the number of those killed amongst vulnerable users, cyclists and pedestrians has increased.
The number of fatal crashes involving heavy trucks continued to decrease in 2014, for the second year in a row. The number of fatal moped crashes has decreased since 2011, when a mandatory training and driving test for moped riders was introduced, reaching a record low of 3 fatalities in 2014.
Trends in traffic and road safety (1990-2014)
Traffic
In the last 25 years (1990-2014), distance travelled has increased by 37%. More recently, over the last 10 years, distance travelled by cars and vans has increased by 6%. In 2012 and 2013, it decreased slightly from the 2011 level, probably as a result of the economic downturn. In 2014 and 2015, distance travelled once again increased.
Road safety
Crashes and casualties
Between 1990 and 2014, the number of deaths decreased by 65.5%. In recent years (2000-14), deaths decreased by 42%. Overall, pedestrian and cyclist fatalities and those in urban areas decreased more than fatalities for car occupants and those in rural areas, with slight variations in the trends for pedestrians and cyclists for some recent years.
No single measure can be identified as the main reason for this positive road safety development. Between 2000 and 2014, a number of measures were implemented including:
- lower speed limits in most urban areas
- construction of pedestrian and bicycle paths
- construction of 260 km of motorways
- installation of automatic speed cameras on nearly 2 000 km of main roads
- reform of driver education
- renewal of the car fleet, with better safety performance and occupant protection than 15 years ago.
Rates
Since 1990, the death rate per 100 000 inhabitants has decreased by 67.8% and the death rate per billion vehicle-kilometres by about 74%. In 2014, the death rates per 100 000 inhabitants as well as per billion vehicle-kilometres were at 4.2.
Analysis of seriously injured data
In 2014, 519 persons injured in a traffic crash reported by the police had an MAIS of 3 or above and were considered seriously injured. This is a lower number than expected. In 2010, there were around 800 seriously injured persons (Trafi, 2014); however the conversion from the International Statistical Classification of Diseases (ICD10) to the Abbreviated Injury Score (AIS) was somewhat different in the 2010 estimation.
Road safety by user group
All user groups have benefited from important safety improvements since the 1990s. Cyclist and pedestrian user groups benefited the most from the progress in safety. There has also been a sharp drop in fatalities among moped riders.
However, the safety situation for motorcyclists has deteriorated since 2000. There were 10 motorcyclists killed in 2000 and 24 in 2013. Motorcycling grew rapidly in the 2000s and the number of registered motorcycles increased by 63% in that 10 year period. However, a positive change was observed in 2014, with 7 fewer motorcyclists killed. The number of injured motorcyclists also increased by 58% between 2000 and 2010, from 404 to 638, but
Table 11.1. Road safety and traffic data
| 2014 % change from | |||||||||
|---|---|---|---|---|---|---|---|---|---|
| 1990 | 2000 | 2010 | 2013 | 2014 | 2013 | 2010 | 2000 | 1990 | |
| Reported safety data | |||||||||
| Fatalities | 649 | 396 | 272 | 258 | 229 | -11.2 | -15.8 | -42.2 | -64.7 |
| Injury crashes | 10 175 | 6 633 | 6 072 | 5 334 | 5 324 | -0.2 | -12.3 | -19.7 | -47.7 |
| Seriously injured persons (MAIS 3+) | 519 | ||||||||
| Deaths per 100 000 inhabitants | 13.0 | 7.7 | 5.1 | 4.8 | 4.2 | -11.6 | -17.3 | -45.1 | -67.8 |
| Deaths per 10 000 registered vehicles | 2.8 | 1.5 | 0.7 | 0.6 | 0.5 | -13.2 | -25.1 | -65.5 | -80.9 |
| Deaths per billion vehicle kilometres | 16.3 | 8.5 | 5.1 | 4.8 | 4.2 | -11.9 | -17.0 | -50.5 | -74.3 |
| Traffic data | |||||||||
| Registered vehicles (thousands) | 2 350 | 2 586 | 3 855 | 4 236 | 4 334 | 2.3 | 12.4 | 67.6 | 84.4 |
| Vehicle kilometres (millions) | 39 750 | 46 710 | 53 815 | 54 170 | 54 580 | 0.8 | 1.4 | 16.8 | 37.3 |
| Registered vehicles per 1 000 inhabitants | 472 | 500 | 720 | 781 | 795 | 1.9 | 10.4 | 59.0 | 68.3 |
1 2 http://dx.doi.org/10.1787/888933385422
Figure 11.1. Road safety, traffic and GDP trends index 1990 = 100
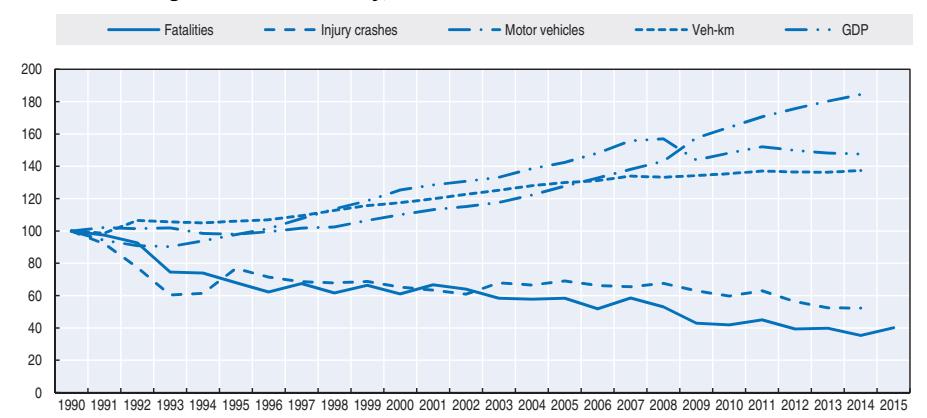
Source: World Bank for Gross Domestic Product (GDP; constant prices).
decreased to 496 in 2014. There is no data on motorcycle traffic volume, and therefore it remains unclear whether the positive trend in motorcycle fatalities and crashes is due to reduced traffic.
Injury crashes involving mopeds more than doubled between 2000 and 2008, probably due to the increase of the moped fleet. The maximum was around 900 crashes in 2009. In 2012, 2013 and 2014, there were significantly fewer moped crashes, around 570 per year, due to new legislation requiring mandatory driving lessons and a driving test for moped riders, along with a decrease in registration of new mopeds.
Road safety by age group
Since 1990, the reduction in fatalities has benefited all age groups, with the most impressive reduction for the youngest groups (0-14), for which fatalities decreased by almost 80%, from 45 in 1990 to 10 in 2014.
Table 11.2. Road fatalities by road user group
| 2013 | 2014 | 2014 % change from | |||||||
|---|---|---|---|---|---|---|---|---|---|
| 1990 | 2000 | 2010 | 2013 | 2010 | 2000 | 1990 | |||
| Cyclists | 101 | 53 | 26 | 20 | 27 | 35.0 | 3.8 | -49.1 | -73.3 |
| Moped users | 27 | 9 | 9 | 5 | 3 | -40.0 | -66.7 | -66.7 | -88.9 |
| Motorcyclists | 28 | 10 | 16 | 24 | 17 | -29.2 | 6.3 | 70.0 | -39.3 |
| Passenger car occupants | 343 | 224 | 159 | 152 | 121 | -20.4 | -23.9 | -46.0 | -64.7 |
| Pedestrians | 105 | 62 | 35 | 34 | 36 | 5.9 | 2.9 | -41.9 | -65.7 |
| Others | 45 | 38 | 27 | 23 | 25 | 8.7 | -7.4 | -34.2 | -44.4 |
| Total | 649 | 396 | 272 | 258 | 229 | -11.2 | -15.8 | -42.2 | -64.7 |
Figure 11.2. Road fatalities by road user group in percentage of total 2014
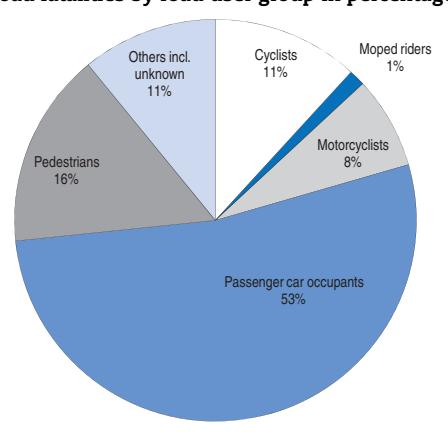
While the 18-20 age group has a mortality rate much higher than the other age groups, it was reduced by half in 2012 compared to 2010 then stabilised in 2013 and 2014, with a fatality rate of 9 killed per 100 000 population in 2014.
Table 11.3. Road fatalities by age group
| 2014 % change from | |||||||||
|---|---|---|---|---|---|---|---|---|---|
| Age | 1990 | 2000 | 2010 2013 |
2014 | 2013 | 2010 | 2000 | 1990 | |
| 0-5 | 12 | 6 | 3 | 1 | 3 | Figures too small | -75.0 | ||
| 6-9 | 15 | 6 | 2 | 2 | 3 | for meaningful | -80.0 | ||
| 10-14 | 18 | 8 | 2 | 3 | 4 | comparisons | -77.8 | ||
| 15-17 | 43 | 16 | 13 | 12 | 12 | 0.0 | -7.7 | -25.0 | -72.1 |
| 18-20 | 66 | 32 | 28 | 15 | 18 | 20.0 | -35.7 | -43.8 | -72.7 |
| 21-24 | 63 | 19 | 20 | 21 | 14 | -33.3 | -30.0 | -26.3 | -77.8 |
| 25-64 | 274 | 203 | 140 | 131 | 119 | -9.2 | -15.0 | -41.4 | -56.6 |
| 65 | 158 | 106 | 64 | 73 | 56 | -23.3 | -12.5 | -47.2 | -64.6 |
| Total | 649 | 396 | 272 | 258 | 229 | -11.2 | -15.8 | -42.2 | -64.7 |
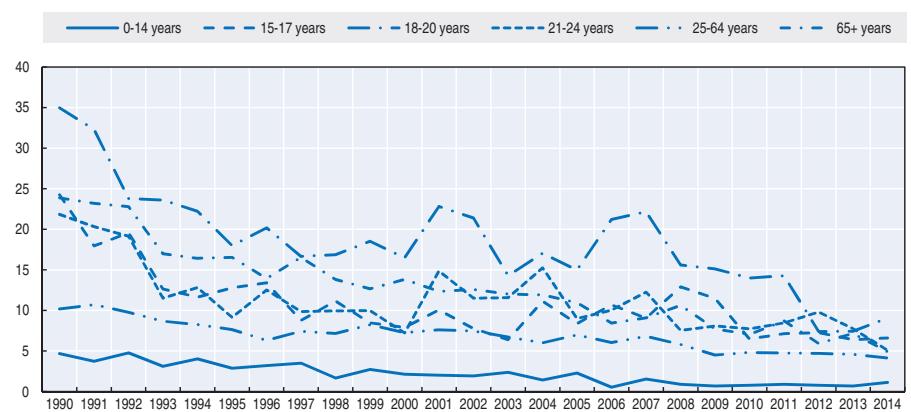
Figure 11.3. Road fatality rates by age group Deaths per 100 000 inhabitants in a given age group, 1990-2014
Figure 11.4. Road fatality rate by age and road user group Fatalities per 100 000 inhabitants, 2014
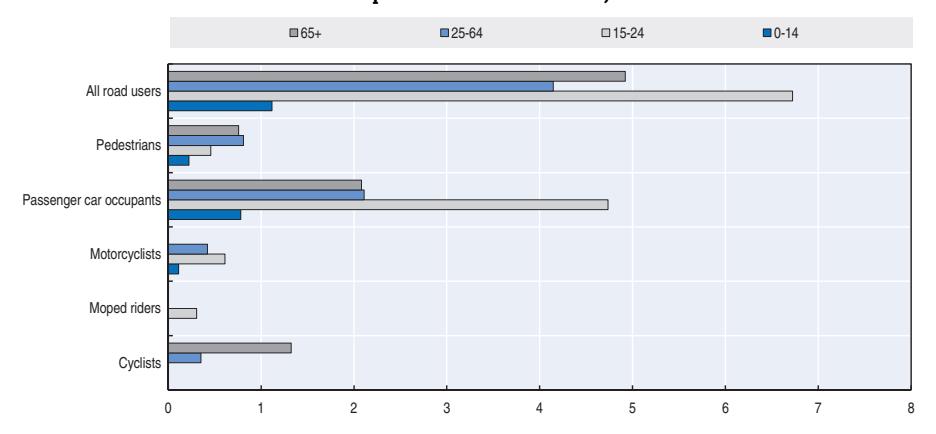
Road safety by road type
In 2014, around 70% of fatalities occurred on rural roads, 27% in urban areas and 3% on motorways. Since 1990, the reduction in deaths has been greater on urban roads.
Approximately one third of fatalities are due to frontal crashes, which typically occur on main roads outside built-up areas. Another third of fatalities are run-off-road crashes, typically on small country roads. Finland only has about 880 km of motorways, and they account for a minor share of crashes. High-risk roads are usually those with a single carriageway, no central fencing and 80 km/h or 100 km/h speed limits.
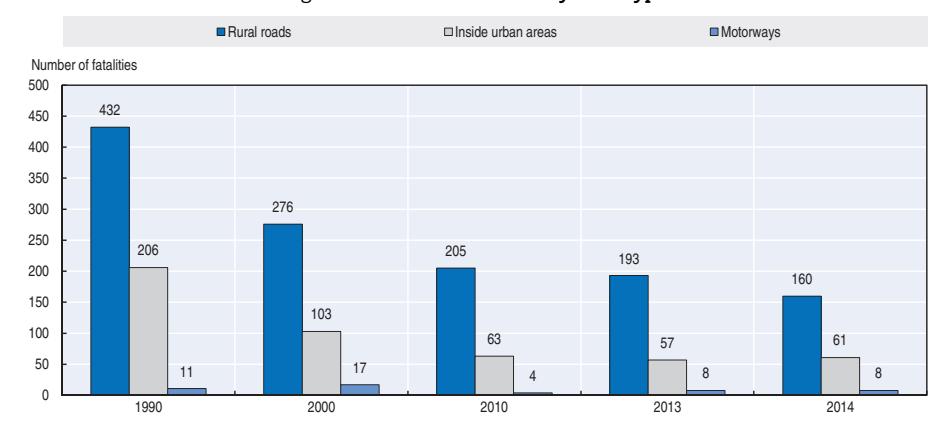
Figure 11.5. Road fatalities by road type
Economic costs of traffic crashes
The economic and social cost of road crashes is estimated based on actual medical and intervention costs (health care, police, fire brigade, etc.); loss of production calculated through an estimate of lost labour time; and loss of human well-being estimated on the basis of a willingness-to-pay method using values from other Nordic countries.
Cost analysis is conducted and updated every five years. In the near future, health care information on crash severity will be integrated to improve the estimates of health costs.
In 2014, the cost of road crashes based on police reported crashes was EUR 2.7 billion. This does not include costs associated with non-reported crashes.
Trafi is currently working in defining a monetary value for MAIS3+.
Table 11.4. Cost of road crashes, 2014
| Unit cost | Total | |
|---|---|---|
| Fatalities | EUR 2 406 200 | EUR 551 million |
| Injuries | EUR 309 100 | EUR 2 072 million |
| Property damage only crashes | EUR 3 200 | EUR 91 million |
| Total | EUR 2.7 billion | |
| Total as % of GDP | 1.4 % |
Source: Finnish Transport Safety Agency (2015).
Recent trends in road user behaviour
According to the report from the road crash investigation teams, speeding or inappropriate speed is a contributing factor in 42% of all motor vehicle fatal crashes.
There have not been any major changes in mean speed over the past 10 years. Reduction of the mean speed by 1-3 km/h has been observed on road sections where speed cameras have been installed. While a high proportion of drivers exceed the speed limit, especially during the winter months when speed limits are lowered, the percentage of drivers speeding 10 km/h above the limit is relatively low: In 2015, 10% of drivers exceeded the speed limits by more than 10 km/h in summer and 14% in winter on main roads.
Speed cameras, implemented mainly during the 2000's, cover around 3 000 km of the main roads.
The table below summarises the main speed limits in Finland.
Table 11.5. Passenger car speed limits by road type, 2016
| General speed limit | Comments | |
|---|---|---|
| Urban roads | 50 km/h | 30, 40 or 60 km/h on a large share of streets |
| Rural roads | 100 km/h (summer) 80 km/h (winter) |
60–80 km/h at intersections or where bad road geometry or high traffic volume. 80 km/h if no speed limit signs. |
| Motorways | 120 km/h | 100 km/h near cities. A large share of motorways have variable speed limits |
Drink driving
The maximum authorised blood alcohol content (BAC) is 0.5 g/l for all drivers. In 2014, it was estimated that 18% of fatal crashes involved a driver with a BAC above the 0.5 g/l limit (this share was 24% in 2010, 25% in 2011, 17 % in 2012 and 22 % in 2013). It is typical in alcohol-related fatal crashes that the driver is strongly intoxicated. In 2014, 70% of drivers responsible for a fatal crash exceeded 1.2 g/l, the limit of aggravated drunk driving.
Those who die in drunk-driving crashes are most often the drunk drivers themselves. From 2013-15, 69% of killed persons were drunk drivers, 25% were their passengers and 6% were others.
The percentage of drivers under the influence of alcohol in traffic has slowly decreased from 0.25% in 1990. In 2013 and 2014, 0.14% of drivers had a BAC above the legal limit (Löytty, 2015).
Drugs and driving
In 2014, 13 drivers involved in fatal crashes were suspected of driving under the influence of drugs (17 drivers in 2013). 5 of them also had a BAC above the 0.5 g/l limit.
Distraction
In Finland, it is forbidden to drive with a hand-held mobile phone, while hands-free devices are tolerated. Around three fatal crashes every year are related to mobile phone use while driving (Jääskeläinen, 2014).
Sleepiness and fatigue
Road accident investigations teams have assessed that falling asleep or a decrease of alertness was the immediate risk factor in 14 fatal crashes in 2014. A total of 34 crashes involved background risks related to fatigue or decrease of alertness.
Seat belts and helmets
Seat belt use has been compulsory for front seats since 1975 and for rear seats since 1987. There has been a significant increase in seat belt use by car drivers since 1980.
Based on monitoring by Liikenneturva the seat belt wearing rate is 96% for front seats on rural roads, 93% for front seats on urban roads, and 88% for rear seats.
According to the road crash investigation teams, 39% of car or van occupants killed were not wearing a seat belt. It is estimated that 100% seat belt usage would have saved 30 lives in 2012.
Under Finnish law, children under 135 cm in height must wear a safety device determined by their weight when in a car.
Table 11.6. Seat belt wearing rate by car occupancy and road type
| % | ||||||
|---|---|---|---|---|---|---|
| 1980 | 2000 | 2010 | 2013 | 2014 | 2015 | |
| Front seat | ||||||
| Urban roads (driver + passengers) | 22 | 80 | 91 | 87 | 89 | 93 |
| Rural roads (driver + passengers) | 89 | 94 | 95 | 94 | 96 | |
| Rear seats | ||||||
| Urban roads | 84 | 86 | 88 | 88 |
Helmet wearing is compulsory for all motorcycle and moped riders.
Although it has been mandatory to wear a helmet while cycling since 2003, this is not enforced. The bicycle-helmet usage rate was 25% in 2004 and reached 41% in 2014. Most small children wear helmets, but teenagers and elderly people tend not to do so. The usage rate in Helsinki is about 60%, but rates in northern Finland are much lower.
National road safety strategies and targets
Organisation of road safety
The Ministry of Transport and Communications is responsible for drafting legislation concerning road safety.
The Ministry's main agencies involved in road safety are:
- The Finnish Transport Agency, which is responsible for road design, construction and maintenance, and for road and traffic signs.
- The Finnish Transport Safety Agency, which is responsible for vehicle registration, supervision of driving schools and driving licence operations, and organisation of matters related to vehicle inspection. The agency's responsibilities also include campaigning for road and traffic safety.
- Liikenneturva (Finnish Road Safety Council) which implements campaigns for road and traffic safety, disseminates information, contributes to road safety education for various age groups and provides further training for drivers.
Road safety strategy for 2011-20
The road safety programme for the years 2012-14 has ended. Preparations for a new programme have started.
Road safety targets
The target for 2020 is based on the target set by the European Commission to reduce by half the number of fatalities by 2020 compared to 2010 level. In addition, there is a target to reduce by 25% the number of persons seriously injured.
The corresponding numerical targets are:
- fewer than 219 fatalities (or 40 fatalities per million inhabitants) by 2014
- fewer than 137 fatalities (or 24 fatalities per million inhabitants) by 2020
- fewer than 5 750 police-reported injuries by 2020
- long-term target of fewer than 100 fatalities by 2025.
Monitoring targets
The target set for 2014 was nearly met (229 was 10 fatalities above the target). At the current pace, it is estimated that the 2020 target will be reached for injuries but not for fatalities.
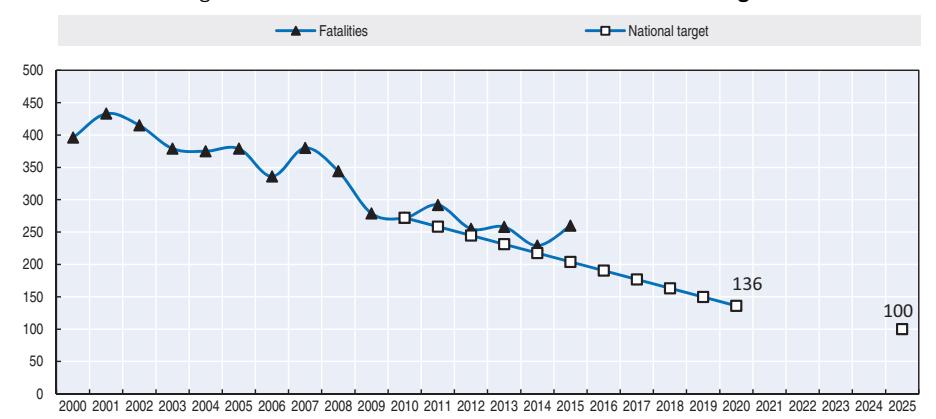
Figure 11.6. Trends in road fatalities towards national target

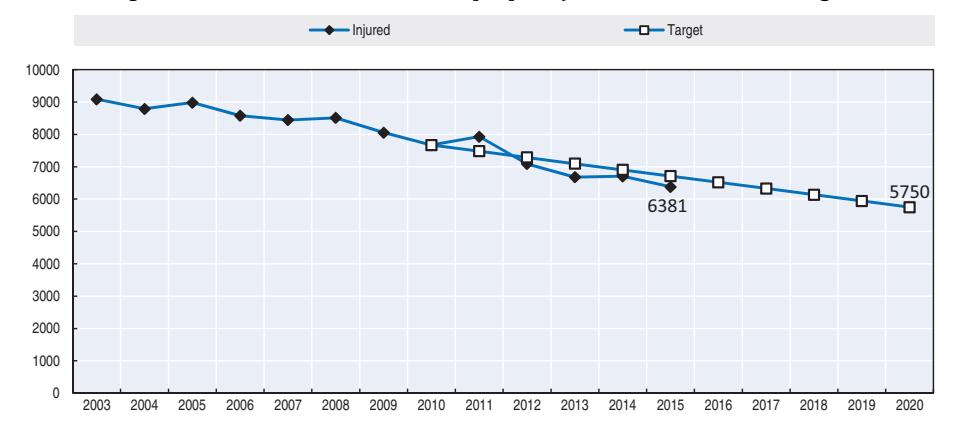
ROAD SAFETY ANNUAL REPORT 2016 © OECD/ITF 2016 167
Implementation of the 2012-14 road safety programme was reviewed. Of the approximately 80 road safety measures included in the programme, nearly half were implemented well, about 40% were implemented partially, and six measures were not implemented at all. Campaigning, education, norms and studies were implemented well, while road improvements and increase of automatic traffic enforcement were implemented poorly. Road improvements lacked adequate funding.
When this programme was planned it was estimated that, if the implementation was extensive and efficient, it would reduce the annual number of road fatalities by 30-40 by 2014. However, the review indicates that only 14-18 fatalities were prevented. The most important measures implemented were the increased use of safety devices (helmets, seat belts, and reflectors), several campaigns and changes in winter maintenance and speed limits. The main shortcomings in the programme implementation were low use of alcolocks, no increase in fixed automatic speed enforcement, slow penalty system development and far fewer roads with median barrier than planned.
In the future, road safety programmes should be better integrated with target setting and steering in the various administrative sectors. Implementation of the programme should be better monitored and content of the programme should be modified when problems arise with fulfilment or changes in road safety.
Recent safety measures (2013-16)
Road safety management
Transport companies
● The Transport Safety Agency is developing a management and practice model for road transport companies to promote safety culture in commercial traffic and a responsible and environmentally friendly operation.
Driving license
● The new law on drivers' licences came into force on 19 January 2013, with changes concerning licences and education. Different licences are now required for light fourwheel vehicles (moped cars) and moped licences.
Road users
Enforcement
- Almost all fixed fines were doubled in September 2015. Now the lowest fine is EUR 20 and the largest EUR 200. Speeding is the most common reason for a fixed fine.
- Installation of plate-recognition devices in police cars started in 2014. As of April 2015 around 100 devices were in use.
Vehicles
● Finland's vehicle fleet is one of the oldest in the European Union. The average age of passenger cars in traffic is 11 years. A trial incentive programme for car scrappage was conducted in 2015 to promote the replacement of old vehicles with modern vehicles. Around 8 000 old cars were replaced by new vehicles producing carbon dioxide emissions of 120 g/km or less.
- At the beginning of 2016, a new classification for new types of very light electric vehicles came into force. Vehicles such as senior scooters and electric skateboards with a maximum speed of 15 km/h and a maximum power of 1 kW are considered as "pedestrians". These devices are allowed on the sidewalk when travelling at walking speed and on bicycle paths when travelling at higher speeds. Vehicles with a maximum speed of 25 km/h and a maximum power of 1 kW power are considered as "bicycles".
- Finland will provide an Arctic intelligent transport system (ITS) test site for automated driving, designed for verifying and validating new ITS solutions and innovations in Arctic conditions with extreme seasonal changes. www.snowbox.fi/.
High capacity vehicles
● Special permits for High Capacity Transport vehicle combinations have been granted since November 2013. At the end of 2015, there were 11 vehicle combinations in use, transporting sea containers, timber and foodstuff.
Recent and ongoing research
Some research projects are presented below.
- Evaluation of the impacts of road traffic automation. The main focus areas in the study were the use and acceptance of the systems and the impacts on traffic flow and the transport system. www.trafi.fi/filebank/a/1421850491/c57dad45a028a573735b6850e24 c89d0/16652-Trafi\_tutkimuksia\_01-2015\_-\_Automaattiajaminen.pdf.
- In Finland, all 120 km/h and most 100 km/h speed limits are reduced by 20 km/h during the winter months. According to a new study, the relative safety effect of lower wintertime speed limits has remained constant since the last evaluation a decade ago. The estimated benefit is a reduction of 15% in injury crashes and 29% in fatalities on these roads. http://www2.liikennevirasto.fi/julkaisut/pdf8/lts\_2015-61\_talviajan\_no peusrajoitusten\_web.pdf.
- A browser-based learning game application for children aged 6 to 10 was launched, for improving the anticipation and observation skills needed when cycling in traffic: www.trafi.fi/filebank/a/1439879581/7f15ee21e2f0cdb69a37b57ea5ef934c/18289-Trafin\_ tutkimuksia\_13\_2015\_Liikenteen\_havainnointia\_opettava\_peli\_lapsipyorailijoille.pdf.
References
Official Statistics of Finland (OSF), Statistics on road traffic accidents, www.stat.fi.
Finnish Transport Safety Agency (Trafi), Finnish Road Traffic 2015: Safety and environmental impacts, http:// katsaukset.trafi.fi/media/katsaukset/tieliikenne/finnish-road-traffic-2015.pdf.
Finnish Transport Safety Agency (Trafi), Finnish Road Traffic 2014: Safety and environmental impacts, http:// pinnalla.trafi.fi/e-julkaisut/finnish\_road\_traffic\_2014/pdf/Trafi\_\_Finnish\_roadtraffic\_2014\_EN.pdf.
Finnish Transport Safety Agency (Trafi) (2014), Tieliikenteessä vakavasti loukkaantuneiden määrän arviointi VAAKKU (Evaluation of the number of people seriously injured in road traffic), www.trafi.fi/filebank/ a/1416923679/b8f9e9b07b0dca1231c3958a3c995e52/16298-Trafin\_tutkimuksia\_10-2014\_-\_Vakavasti\_ loukkaantuneet.pdf.
Websites
● Finnish Transport Safety Agency (Trafi): www.trafi.fi.
- Ministry of Transport and Communications: www.lvm.fi.
- Finnish Transport Agency: www.liikennevirasto.fi.
- Liikenneturva Finnish Road Safety Council: www.liikenneturva.fi.
- Statistics Finland: www.stat.fi/index\_en.html.
Chapter 12
France
This chapter presents 2014 road safety data for France along with provisional data from 2015. It looks at trends in traffic and road safety from the years 1990 to 2014 and road user behaviour patterns. This includes data on speed, drink driving, drugs and driving, distracted driving, fatigue and seat belt and helmet use. The chapter reviews France's road safety strategy and national targets to 2020. It also looks at the most recently implemented safety measures and on-going research.*
* All data stem from the Observatoire national interministériel de la sécurité routière (ONISR) and IRTAD unless otherwise noted. Data presented in this report concern the French metropolitan area. For more information please contact: onisr-dscr@interieur.gouv.fr.
France, with its road network of one million kilometres, reduced its fatality rate by another 15% between 2010 and 2014. In December 2015 the government confirmed its 2020 target of 2000 deaths or less per year. However, both 2014 and 2015 have seen an increase in fatalities of 3.5% and 2.4% respectively. Favourable weather conditions and increased mobility are factors contributing to the 2014 increase; and a dramatic truck and coach accident in 2015 with 41 fatalities also needs to be taken into account. A new 22-point action plan was announced in October 2015 aiming in part to further protect vulnerable users and combat dangerous driving.
Road safety data collection
Definitions applied in France
- Road fatality: Person who died within 30 days of a road crash. Before 2005, fatalities were counted within six days. For international comparisons, a correction factor of 1.069 is applied for the years before 2005.
- Hospitalised: Non-fatal casualty who stayed longer than 24 hours in hospital. Before 2005, this category used the duration of more than 6 days for the hospital stay.
- Slightly injured: Non-fatal casualty who received medical care but did not stay in hospital longer than 24 hours (or 6 days before 2005).
- Seriously injured: Person who is injured with at least one injury ranking three or more on Maximum Abbreviated Injury Scale (MAIS3+), not including those who died within 30 days.
Data collection
French official road safety information comes from the National Road Traffic Accident (RTA) database and presents results for mainland France only, unless specified that data from overseas areas are included.
Road traffic accidents leading to injury are recorded by police force into their own software programme according to a dedicated format Injury Accident Analysis Bulletin (BAAC, Bulletins d'analyse d'accident corporel). These files are then gathered centrally through a web-based programme and constitute the National RTA database. This process is managed by the French Road Safety Observatory (ONISR, Observatoire national interministériel de la sécurité routière), with the assistance of technical teams from the French Research Centre on Risks, Environment, Mobility and Planning (CEREMA, Centre d'études et d'expertise sur les risques, l'environnement, la mobilité et l'aménagement) and the network of local observatories to check and complement the information as necessary.
Proven suicides and intentional murders are not registered as road traffic accidents.
Monitoring the quality of data is ensured partially by comparing it with the Rhone registry, i.e., information gathered from hospitals of the Rhone county on all road traffic crash victims who went to hospital for medical care. Information on the number of fatalities is very accurate. Serious injury crashes are usually recorded accurately as well, except for single vehicle crashes of powered two-wheelers and cyclists. There are some variations across the country over the way slight injury accidents are recorded. The French Institute of Science and Technology for Transport, Development and Networks (IFSTTAR) estimates that the number of injured people is significantly under-estimated and could be four times greater than the registered number.
Based on the expertise developed by using both the Rhone registry and the National RTA database, IFSTTAR has been tasked with providing a national estimate for MAIS3+ victims to provide the relevant information requested by the European Commission for their 2014 baseline.
Most recent safety data
Road crashes in 2015 – provisional data
Based on provisional data, it is estimated that 3 464 persons lost their lives on French roads in 2015. This is 80 more than in 2014, i.e. a 2.4% increase. This is the second consecutive year with an increase in the number of road fatalities.
Between 2010 and 2015, estimates show a decrease in road fatalities for motorcyclists (-12%), pedestrians (-5%), moped riders (-40%) and car occupants (-15%). By contrast, fatalities among cyclists increased by 3% increase compared to 2010. The number of people killed in collective road transport, usually well under 10 persons each year, included in 2015 the 41 coach passengers killed in the dramatic crash of October between a coach and a truck.
Road crashes in 2014
In 2014, 3 384 people were killed on French roads, a 3.5% increase when compared with 2013. This increase needs to take into account the favourable weather conditions in France in 2013, with a very cold and wet first semester. There was a 15% decrease in fatalities between 2010 and 2014, a decrease similar to the period 2006 to 2010.
In 2014, temperatures were the warmest since 1900, enhancing personal mobility. However, the very rainy 2014 summer limited motorcycle outings and contributed to a significant decrease in the usual high number of summer motorcyclist fatalities.
In 2014, among the 3 384 road fatalities, it was registered that:
- three quarters were male
- 64% died on roads outside built-up areas
- nearly a quarter were less than 24 years old
- nearly a quarter died in a crash involving a driver with a licence not older than two years.
- a quarter were motorcyclists or moped users.
Trends in traffic and road safety (1990-2015)
Traffic
Between 1990 and 2014, the number of motorised vehicles increased by 38% and the overall vehicle kilometres driven by 31%. Light vehicle traffic increased consistently from 1990 to 2003 and then remained more or less stable until 2009 and then increased again by 3% over the next 5 years. Utility vehicle traffic increased regularly until 2005; then remained stable; it increased again by 9% between 2009 and 2014. After a regular increase from 1990 to 2007, heavy goods vehicle (HGV) traffic dramatically dropped by 18.5 % between 2007 and 2009 due to the economic downturn. It has been fairly stable since 2009.
Road safety
Crashes and casualties
The number of road fatalities peaked in 1972 with about 18 000 fatalities. France had a fatality rate of 35 deaths per 100 000 inhabitants. Since then, the number of fatalities has followed a downward trend, with fluctuations from year to year. Between 1990 and 2015, the number of road fatalities decreased by more than 70%.
Between 1990 and 2000, important measures include:
- In 1989 the publication of the White Paper on Road Safety paved the way for road safety policies on improving and enhancing enforcement that would come into effect 10 years later.
- The maximum speed limit in built-up areas was set at 50 km/h in 1990, and the maximum allowable blood alcohol content level (BAC) was lowered to 0.5 g/l.
- The demerit point system was introduced in 1992.
- Most motorway network construction was achieved during this period.
- Most vehicles were equipped with airbags.
- The educational continuum was implemented.
Despite these measures, fatalities only decreased by 20% in the decade, as traffic increased by 20%. In 2000, there were 15 people killed per billion vehicle kilometres driven and 14 per 100 000 inhabitants.
In July 2002, French President Jacques Chirac declared road safety to be one of his four main priorities. Between 2000 and 2010 important safety changes included:
- The first permanent automated speed cameras were introduced in 2003.
- A Road Safety National Council was established for public and private stakeholders to meet and present action proposals to the government.
- Probationary licences were introduced in 2004.
- A driver caught exceeding the maximum blood alcohol concentration level would lose six demerit points out of 12 (or 6 out of 6 for drivers in their probation period).
These changes made it possible to break through the symbolic level of 5 000 fatalities per year in 2006. Fatalities fell by 51 % over the 10 year period. Experts attribute 75% of the improvement to a reduction in average speed and 11% to improved vehicle safety. At the same time, traffic was up 7%.
Between 2010 and 2012, fatalities decreased by 8.5%, in line with the trend observed at the end of the 2000s.
As a result of favourable weather conditions in particular, 2013 was marked by an accelerated decline in the number of fatalities, with a 10.5% decrease compared to 2012.
In 2014, the increase of car occupant fatalities compensated the decline. The increase among car occupant fatalities continued fuelling the upward trend in 2015.
Rates
In 2014, the fatality rate expressed in terms of deaths per 100 000 inhabitants was 5.3 and the fatality risks, expressed in terms of deaths per billion vehicle-kilometres was 5.9. In 1990 the respective rates were 15.8 and 25.2, which means that the risk of dying on a French road was divided by about four between 1990 and 2014. During the same period, the number of vehicles per 1 000 inhabitants increased by 22%.
Analysis of seriously injured data
IFSTTAR estimates the number of people in road traffic crashes with a MAIS3+ injury. This modelling work is currently being evaluated. Based on these estimates, 43% of persons injured with a MAIS of 3 or above were powered two-wheelers riders, 28% were car occupants, 14% cyclists and 12% pedestrians. This means that nearly 70% of those seriously injured are vulnerable road users.
These data also show a slower reduction in the number of people seriously injured compared to the number of fatalities, and wide variation for different road users. Between 2000 and 2012, the number of fatalities decreased by 55%, while the number of seriously injured decreased by 43 %. Between 2006 and 2012, the decrease was 22% for fatalities and 19% for MAIS3+ injuries. The table below show the reduction in fatalities and seriously injured for various road user groups.
Table 12.1. Estimated evolution in the number of killed and seriously injured (MAIS3+), 2012 percentage change from 2002
| Fatalities % | Seriously injured (MAIS3+) % | |
|---|---|---|
| All road users | -53 | -40 |
| Car occupants | -62 | -59 |
| Powered two wheelers riders | -41 | -29 |
| Pedestrians | -44 | -35 |
| Cyclists | -27 | -4 |
Source: ONISR, IFSTTAR.
Table 12.2. Road safety and traffic data
| 1990 | 2000 | 2010 | 2013 | 2014 | 2014 % change from | ||||
|---|---|---|---|---|---|---|---|---|---|
| 2013 | 2010 | 2000 | 1990 | ||||||
| Reported safety data | |||||||||
| Fatalities | 10 999 | 8 079 | 3 992 | 3 268 | 3 384 | 3.5 | -15.2 | -58.1 | -69.8 |
| Injury crashes | 162 573 | 121 223 | 67 288 | 56 812 | 58 191 | 2.4 | -13.5 | -52.0 | -64.2 |
| Injured persons hospitalised | 30 393 | 25 966 | 26 635 | 2.6 | -12.4 | ||||
| Deaths per 100 000 inhabitants | 19.8 | 13.7 | 6.4 | 5.1 | 5.3 | 3.1 | -16.8 | -61.4 | -73.3 |
| Deaths per 10 000 registered vehicles | 3.9 | 2.3 | 1.0 | 0.8 | 0.8 | 3.2 | -19.8 | -64.6 | -78.1 |
| Deaths per billion vehicle kilometres | 25.2 | 15.8 | 7.1 | 5.8 | 5.9 | 2.7 | -17.0 | -60.9 | -77.0 |
| Traffic data | |||||||||
| Registered vehicles (thousands) | 30 869 | 35 874 | 40 181 | 42 342 | 42 476 | 0.3 | 5.7 | 18.4 | 37.6 |
| Vehicle kilometres (millions) | 436 000 | 518 200 | 560 400 | 567 800 | 572 400 | 0.8 | 2.1 | 10.5 | 31.3 |
| Registered vehicles per 1 000 inhabitants | 546 | 609 | 640 | 665 | 665 | -0.1 | 3.8 | 9.0 | 21.8 |
1 2 http://dx.doi.org/10.1787/888933385435
Road safety by user group
The reduction in road deaths since 2000 did not benefit all categories of users in the same manner. The greatest reductions were observed for car occupants (-69%) and moped riders (-64%). The number of motorcyclists killed decreased by 33%. The number of pedestrians and cyclists killed decreased by 41%. These gains were achieved mainly in the first half of the period. A stagnation has been observed since 2007 for cyclists and since 2009 for pedestrians.
Powered two-wheelers (moped riders and motorcyclists) are overrepresented in road fatalities. While they account for less than 2% of distance travelled, they represent 23% of
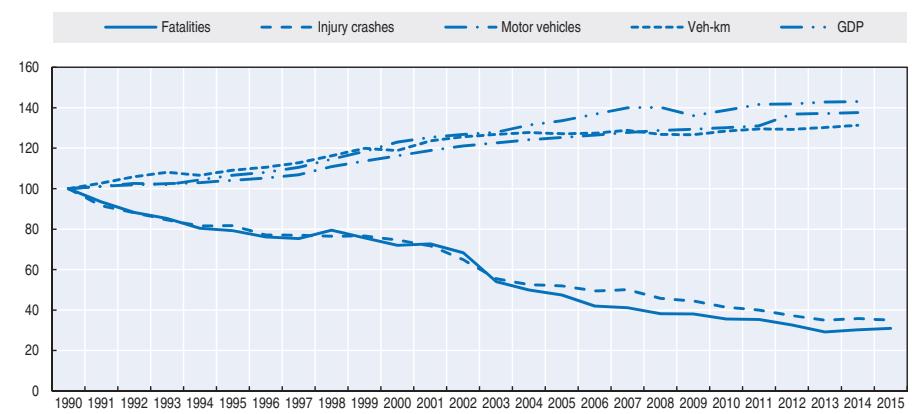
Figure 12.1. Road safety, traffic and GDP trends index 1990 = 100
Source: World Bank for Gross Domestic Product (GDP; constant prices).
total fatalities and 43% of the seriously injured. The risk of fatality per kilometre driven is 19 times higher for a motorcyclist than for a car occupant. However, some progress is being observed, in part attributed to a decrease in speed of passenger cars and to a lesser extents of motorcyclists themselves. The implementation of speed cameras able to record the rear motorcycle plate has contributed to an annual average reduction of 3.5% of motorcyclists killed since 2005 (with strong annual fluctuations due to weather conditions)
In 2014, pedestrians and cyclists represented about 20% of all fatalities, and their mortality has increased since 2013 by 7 and 8% respectively.
| 2014 % change from | |||||||||
|---|---|---|---|---|---|---|---|---|---|
| 1990 | 2000 | 2010 | 2013 | 2014 | 2013 | 2010 | 2000 | 1990 | |
| Cyclists | 429 | 273 | 147 | 147 | 159 | 8.2 | 8.2 | -41.1 | -63.6 |
| Moped users | 702 | 461 | 248 | 159 | 165 | 3.8 | -33.5 | -63.8 | -77.0 |
| Motorcyclists | 1 011 | 947 | 704 | 631 | 625 | -1.0 | -11.2 | -33.3 | -39.4 |
| Passenger car occupants | 6 729 | 5 351 | 2 117 | 1 612 | 1 663 | 3.2 | -21.4 | -68.6 | -75.8 |
| Pedestrians | 496 | 848 | 485 | 465 | 499 | 7.3 | 2.9 | -40.5 | -67.5 |
| Others | 1 632 | 290 | 291 | 254 | 273 | 7.5 | -6.2 | -5.2 | -57.0 |
| Total | 10 999 | 8 170 | 3 992 | 3 268 | 3 384 | 3.5 | -15.2 | -58.1 | -69.8 |
Table 12.3. Road fatalities by road user group
Road safety by age group
The 18-29 year olds are the most affected by road crashes, as young men are more often prone to risky behaviour (in particular driving at high speed), and the majority of novice drivers are also in this age group. In 2014, they represented 28% of all fatalities but only 14% of the population. The 15-17 year-old group are also associated with a high number of injured hospitalised in the BAAC file, but their mortality is now moderate following a strong decrease in the number of moped riders in the 2000s.
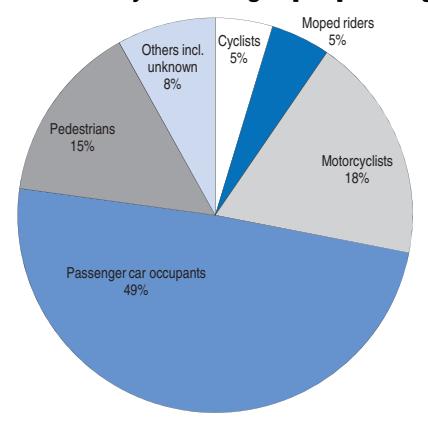
Figure 12.2. Road fatalities by road user group in percentage of total 2014
Between 2000 and 2014, the different age groups followed different trends. This is the result of both an evolution in individual risk and demographic change. Regarding the impact of demographic changes, the population aged 65 and above has increased significantly since 2011. To a lesser extent, the upward trend for the 45-64 age group (the baby boomers) and those 75 and over is continuing. As the population ages, improvement in road safety for the older generation is becoming an important focus.
As a consequence between 2000 and 2014, the number of fatalities among these age groups declined more slowly than for the average population. Strongest decreases were observed for the 0-14 (-71%), the 15-17 (-67%) and the 18-24 (-66%), while fatalities among the population aged 75 and above only decreased by 51%. Between 2010 and 2014, fatalities among the 65-75 age group increased by 7%.
The repartition of road fatalities by travel mode is largely influenced by age, given the minimum age required to drive certain vehicles. Thus the 15-17 age group represents the largest share of fatalities among moped riders, despite a decrease from 37% to 27%. Children under 14 and those above 65 are particularly vulnerable as pedestrians and cyclists. In 2014, children under 14 represented 10% of cyclist fatalities. People aged 65 years old and over represented 43% of cyclist fatalities and 51% of pedestrian fatalities but only 18% of the population.
Road safety by road type
In 2014, France counted more than 1 million kilometres of roads. When fatalities per billion vehicle-kilometres travelled are broken down by type of road, the risk on country roads is much higher. Motorways are the safest network, since they absorb 25% of the traffic and account for 7% of fatalities.
Since 2000, the decrease in the number of fatalities in built up areas and rural roads has been of the same magnitude, about 60%. On the motorway network, the number of fatalities decreased more than on the rest of the network up to 2008 but mortality has stagnated since.
Table 12.4. Road fatalities by age group
| 2014 % change from | |||||||||
|---|---|---|---|---|---|---|---|---|---|
| Age | 1990 | 2000 | 2010 | 2013 | 2014 | 2013 | 2010 | 2000 | 1990 |
| 0-5 | 204 | 125 | 45 | 44 | 46 | 4.5 | 2.2 | -62.9 | -75.3 |
| 6-9 | 124 | 68 | 27 | 24 | 18 | -25.0 | -33.3 | -73.5 | -85.7 |
| 10-14 | 207 | 173 | 58 | 29 | 48 | 65.5 | -17.2 | -71.9 | -77.3 |
| 15-17 | 463 | 354 | 161 | 102 | 116 | 13.7 | -28.0 | -66.9 | -75.4 |
| 18-20 | 1 131 | 867 | 370 | 253 | 252 | -0.4 | -31.9 | -70.6 | -78.1 |
| 21-24 | 1 563 | 879 | 461 | 383 | 330 | -13.8 | -28.4 | -62.0 | -79.3 |
| 25-64 | 5 672 | 4 204 | 2 105 | 1 745 | 1 802 | 3.3 | -14.4 | -56.7 | -68.8 |
| 65 | 1 607 | 1 358 | 764 | 688 | 771 | 12.1 | 0.9 | -42.5 | -52.9 |
| Total | 10 999 | 8 170 | 3 992 | 3 268 | 3 384 | 3.5 | -15.2 | -58.1 | -69.8 |
Figure 12.3. Road fatality rates by age group Deaths per 100 000 inhabitants in a given age group, 1990-2014
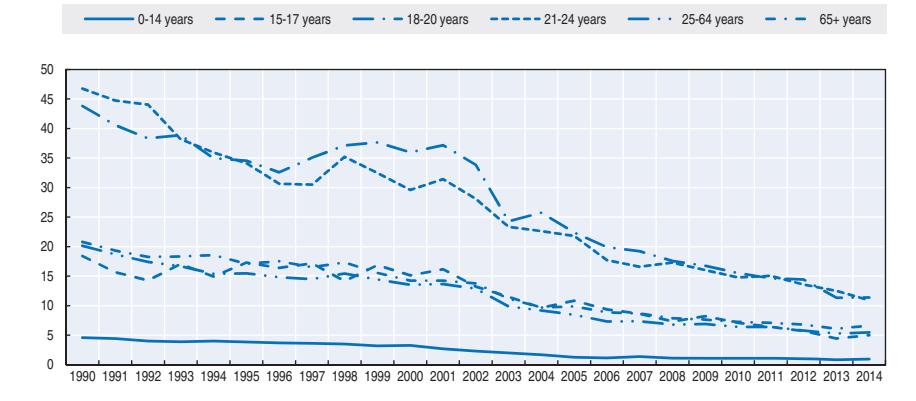
Figure 12.4. Road fatality rate by age and road user group Fatalities per 100 000 inhabitants, 2014
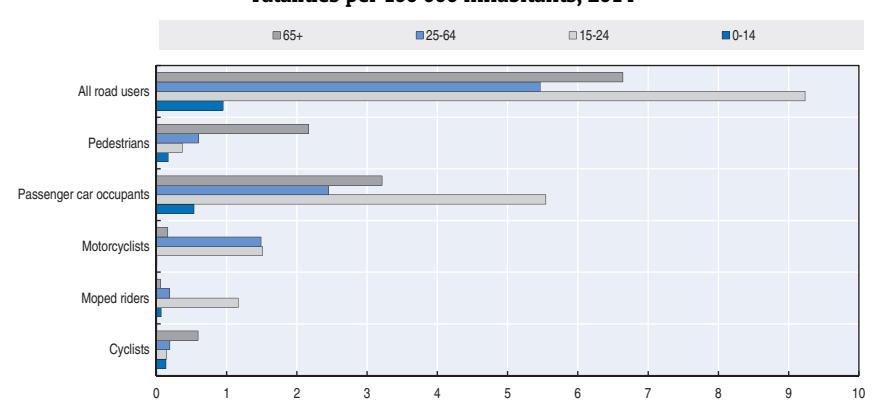
In 2014, 64% of fatalities occurred on rural roads, 29% on urban roads and 7% on motorways. More than half of all road deaths are on a 90 km/h speed limit road, outside built-up areas. In 2014, road mortality decreased only on the motorway network (-7%), but it is still 2% above the 2010 level. Moreover, initial estimates for 2015 indicate a very marked increase of fatalities on motorways.
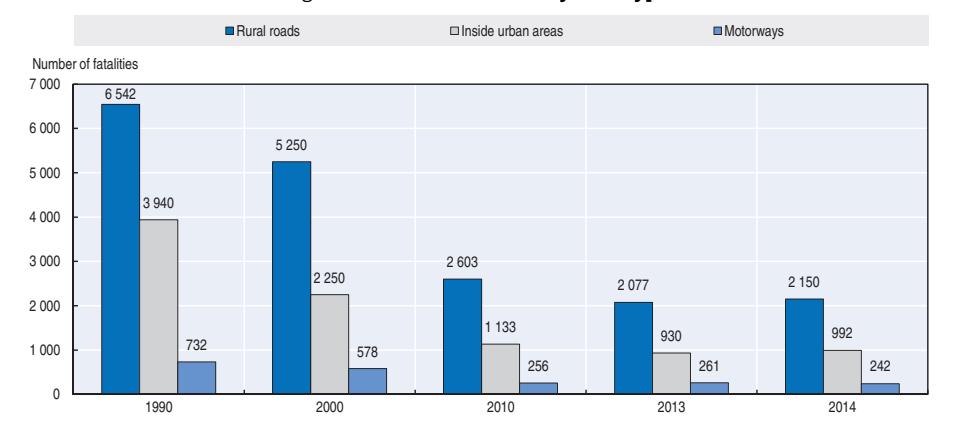
Figure 12.5. Road fatalities by road type
Economic costs of traffic crashes
Road traffic crashes represent a significant cost for society. Based on reported crashes, the cost was estimated in 2014 at about EUR 37.3 billion, or 1.5% of GDP. These costs cannot be directly compared to the costs published for previous years, as unit values for a road fatality, injured person and property damage have been rebased following a 2014 instruction on the socio economic evaluation of projects following recommendations from the OECD (CGSP, 2013).
Costs of road crashes take into account production losses, affective loss for the relatives, medical costs and the loss of quality of life.
| | Unit cost | Total | | |---------------------------------------------|-------------------|-------------------|--| | Fatalities | EUR 3 163 million | EUR 10.7 billion | | | Hospitalised persons | EUR 395 317 | EUR 10.5 billion | | | Slight injuries | EUR 15 113 | EUR 0.7 billion | | | Property damage costs of injury crashes | EUR 4 849 | EUR 0.3 billion | | | Property damage costs of non-injury crashes | | EUR 15. 3 billion | | | Total | | EUR 37.3 billion | | | Total as % of GDP | | 1.5% | |
Table 12.5. Costs of road crashes, 2014
The total costs could actually be much higher, when taking into account non-reported crashes. IFSTTAR estimates that the number of injured people could be four times greater than the registered number, and the number of hospitalised nearly twice as great. This could lead to a global total of EUR 50 billion, representing 2% of the GDP of France.
Recent trends in road user behaviour
Speed
In 2014, inappropriate or excessive speed was the main cause in 26% of fatal crashes.
Between 2000 and 2011, average speeds during daytime decreased by 10 km/h or more on all non-urban networks. Car speeds decreased the most, as cars were the first targeted by automatic speed cameras. HGV speeds started decreasing later in the period and in a more moderate way. Motorcycle average speeds have also decreased, but they remain nearly 10% higher than car average speeds.
However, speed measurements undertaken in 2015 revealed that the average speed increased by 4 km/h on the motorway network (speed limit: 130 km/h) compared to 2012. The average speed also increased by 2 km/h on the dual carriageway network (speed limit: 110 km/h).
The table below summarises the main speed limits in France.
| General speed limit | Comments | |
|---|---|---|
| Urban roads | 50 km/h | |
| Rural roads | 90 km/h | 80 km/h in wet weather or for novice drivers |
| Dual carriageways | 110 km/h | 100 km/h in wet weather or for novice drivers |
| Motorways | 130 km/h | 110 km/h in wet weather or for novice drivers |
Table 12.6. Passenger car speed limits by road type, 2016
Drink driving
The maximum authorised blood alcohol content (BAC) is 0.5 g/l for all drivers (including cyclists). For bus and coach drivers the maximum authorised BAC is 0.2 g/l. Since 1 July 2015 the maximum authorised BAC is 0.2 g/l for novice drivers during their probation period. The use of alcolocks should be extended for drivers found guilty of drink-driving offences by court.
It is estimated that alcohol is the main cause of 19% of fatalities and a contributing factor in 28% of fatal crashes. This proportion has remained stable, around 30%, since 2000.
Drinking and driving involves all age groups, except the older generation.
Drugs and driving
A study among drivers estimated that 3% of crashes could be attributed to the consumption of prescription drugs. Benzodiazepines (anxiolytic or hypnotic) and antidepressants, widely used in France, are associated with a significant increase in the risk of causing a road crash.
Since 2010 between 21% and 26% of fatal crashes have involved use of illegal drugs. In 2014, it was estimated that illegal drugs were a factor in 23% of fatalities. It is estimated that illegal drugs are the main cause of more than 5% of fatal crashes.
The 18-35 year-old group are the most affected by drug impaired driving, representing 67% of drivers testing positive for drugs. Among drivers tested with a BAC above the legal limit of 0.5 g/l, at least one-third also tested positive in a drug test.
Since 2003, driving under the influence of substances or plants classified as narcotics constitutes an offence. Testing is approved for the following categories: cannabinoids, amphetamines, cocaine and opiates. It is planned to conduct more random drug tests, using a saliva-testing kit, which is less expensive than blood tests.
Distraction
Some international studies show that between 25% and 50% of injury crashes are due to a lack of attention, but these incidents are difficult to report. In police files, the factor "distracted attention" was mentioned in 271 fatal cases in 2014 (8% of fatalities), 240 due to drivers' lack of attention and 33 due to pedestrians' lack of attention.
It is forbidden to drive with a hand-held mobile phone, but the use of hands-free mobile phones is tolerated. A study undertaken in 2010 estimated that 10% of injury crashes could be attributed to phone use while driving.
While phoning when driving is a growing concern, the concern is even greater over the expanding number of communication functions offered by a smartphone.
Since 1 July 2015, drivers are prohibited from using any device attached to the ear while driving, whether used for phone calls or for listening to music or the radio (headphones, headsets).
Sleepiness and fatigue
According to police records, sickness/fatigue is a contributing factor in 9% of fatal crashes. Its prevalence is greater on motorways, where it is reported as a contributing factor in 18% of fatal crashes.
Seat belts and helmets
Seat belt wearing has been compulsory in front seats in urban areas at night and urban motorways since 1975 and at all times since 1979. They have been compulsory in rear seats since 1990. Children under 10 must be seated in a rear seat and be adequately restrained, taking into account their weight and height.
The seat belt wearing rate is among the highest in OECD countries; however, there is still room for improvement, especially for rear seats. In 2014, 21% of car occupants killed and 31% of utilitarian vehicle occupants killed were not wearing a seat belt or the seat belt was not well buckled when the crash occurred, 11% of front-seat passengers and 17% of rear seat passengers were not wearing a seat belt, 41% of fatalities involving a driver under the influence of alcohol were not wearing a seat belt and 30% of road users killed at night were not wearing a seat belt.
It is estimated that 150 lives could have been saved if all vehicle occupants had worn their seat belts.
% 2005 2012 Front seat Urban roads 94.2 95.8 Motorways 98.3 98.6 Rear seats Adults – Urban roads 66 71 Adults – Motorways 73 84 Children (use of child restraint) – Urban roads 85 89 Children (use of child restraint)– Motorways 82 94
Table 12.7. Seat belt wearing rate by car occupancy and road type
ROAD SAFETY ANNUAL REPORT 2016 © OECD/ITF 2016 181
Wearing a helmet was made compulsory in 1973 for motorcyclists with engines over 125cc and for moped riders and motorcyclists with engines of 50cc to 125cc in rural areas. This obligation was extended to urban areas in 1975. The helmet-wearing rate of powered two-wheelers (it is difficult to discriminate between mopeds and motorcycles during observations) is almost 100% during week days but only 90% during the weekend. In 2014, 36 of the moped or motorcycle riders killed (18 motorcyclists killed (3%) and 18 moped riders killed (12%) were not wearing a helmet.
There is no mandatory helmet use law for cyclists so far. However, recent research by IFSTTAR has demonstrated that the risk of severe injury was considerably reduced when wearing a helmet. In particular the chance of a severe head injury (MAIS3+) was reduced by 66% in urban areas and by 97% outside urban areas. Mandatory wearing of bicycle helmets for children up to 12 should be in effect by the end of 2016.
National road safety strategies and targets
Organisation of road safety
Since the change of government in 2012, the lead agency for road safety (Road Safety Inter-ministerial Directorate) reports to the Minister of the Interior. The Minister of the Interior chairs the Inter-ministerial Road Safety Committee, an assembly of ministries' representatives in which decisions are taken. The ONISR observatory reports to the road safety director and is in charge of managing the road traffic accident database, analysing road safety performance and organising research to prepare for new measures. The National Road Safety Council, composed of 50 members from public service, enterprises, victims and road users' representatives, is in charge of presenting road safety action proposals to the government. Its mandate terminated in 2015. It should be renewed in 2016 for the period 2016-19.
Road safety strategy for 2011-20
In order to reduce the number of road deaths by half over the period 2011-20, which would mean fewer than 2 000 persons killed on French roads at the end of the decade, the government has tasked the National Road Safety Council to work on new road safety measures. In the meantime, the Ministry of Interior works with other ministries on more technical measures that are required and assesses the feasibility and implementation of what the National Road Safety Council proposes.
The key priorities identified by the government are to:
- reduce fatalities among young people and novice drivers
- reduce fatalities among motorised two-wheelers
- combat the main crash-contributing factors of speed and impaired (alcohol/drug) driving.
The Minister of Interior announced on 26 January 2015 an action plan with 26 road safety measures, aimed in particular at reducing injuries among vulnerable road users as they represent 70% of the seriously injured. Nineteen measures were implemented as of 31 December 2015.
The Inter-ministerial Road Safety Committee (CISR) met on 2 October 2015 for the first time since May 2011. A 22-point action plan was announced, accompanied by 33 additional measures, articulated around the following objectives:
● to increase the fight against dangerous behaviour on the roads
- to protect vulnerable road users
- to bring road safety into the digital era
- to strengthen legal equality for all road users
Road safety targets
The current target of the French government is to reduce the number of road fatalities to below 2 000 by 2020, which is in line with the European Commission goal of halving the number of fatalities by 2020.
Monitoring
Since 2013, national indicators have been calculated for each local jurisdiction over a three-year period, and progress on the overall fatality numbers is benchmarked against the 2010 baseline. Since 2015, dashboards are issued on a quarterly basis to all county executives to assist them in the management of their local safety action plans.
At the end of 2014, it was estimated that France is one year behind schedule to achieve the 2020 target.
The government confirmed its aim to decrease the number of fatalities to 2 000 or less by 2020 when it published its action plan in December 2015. A pre-evaluation was conducted to assess which impact these measures may have (gains for road safety, socioeconomic consequences).
The progress towards the 2020 target is measured using national indicators and published each year in the French Road Safety Observatory (ONISR) annual report. The projections of road fatalities produced through the simulation models of population dynamics are also considered a tool for the management of implemented policies. The assessment of the impact of road safety policies identifies issues and priorities, therefore influencing the choice of new measures to be implemented.
The new Sustainable Development Goals have encouraged consideration of an important component of road safety: sustainable mobility. The strong political will from the government to facilitate sustainable transport and mobility is manifested in various policies: the development of "active mobility" (cycling or walking), public transport projects and shared use of vehicles (carpooling, auto-sharing).
Recent safety measures (2013-16)
Road safety management
- The expert committee advising the National Road Safety Council produced a first report in 2013 advising on measures to reduce the number of fatalities, including a reduced speed limit on single carriageways, the use of alcolocks, a reduced number of road side obstacles and strengthened road safety management. A specific report on road users with a higher risk (cyclists, motorcyclists, young people and seniors) was finalised in 2014.
- The National Road Safety Council issued 17 recommendations to the government. Some of them have already been implemented (e.g. signs to announce fixed speed cameras, communication rather than enforcement around the use of self-alcohol testing, promoting accompanied driver education). Others were among the 26 measures announced in January 2015 by the Minister of Interior (e.g. regulations for motorcyclists driving between two lanes, forbidding the use of ear pieces and audio headsets,
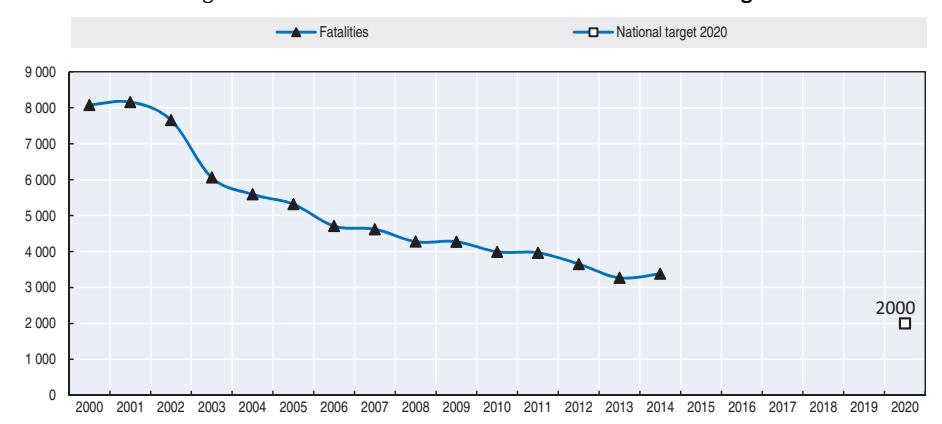
Figure 12.6. Trends in road fatalities towards national target
standardising powered two-wheeler number plates, defining auditing methods for local road networks to deal with road side obstacles, experimenting with some reduction in speed limits on single carriageways).
Road users
Driving license
- As a result of a European Directive, since January 2013 new driving licence categories have been created to implement progressive access to more powerful motorised two-wheelers: AM for mopeds and A2 for motorcycles of average power.
- The principle of progressive access to powered two-wheelers, in the form of the A2 licence, currently only concerns users under 24. The Inter-ministerial Road Safety Committee (CISR) announced the generalisation of the graduated licensing for all age levels in order to prevent quick access to powerful powered two-wheelers for new motorcyclists, which shall come into force in 2016.
- Since 1 November 2014, accompanied driving practice is possible from the age of 15 (instead of 16 before). Young people can take the driving license examination at 17½, although they will not be driving on their own before they turn 18.
Speed management
- In 2014, the speed camera fleet was strengthened with new automated speed cameras including control of average speeds. Other new automated cameras enforce stops at train crossings and traffic lights.
- In 2015, France experimented with new speed management devices: fixed speed cameras that detect excess speed in both directions; speed cameras that take pictures of both the front and rear of the vehicle; traffic light radars to determine if they can be adapted to capturing excessive speed as well, and autonomous speed cameras for road works sections.
At the end of 2015, there were 2 180 fixed speed cameras (and 239 discriminating speed cameras), 809 mobile speed cameras (including 259 next generation radars and
22 autonomous speed cameras) and 712 traffic light radars. Fixed speed cameras are spread across all networks: 13% on motorways, 25.5% on trunk roads, 57, 5% on county roads and 3% on local roads. Traffic light radars are spread evenly (a third each) across major cities (with more than 500 000 inhabitants), middle cities (between 100 000 and 500 000 inhabitants) and minor cities (fewer than 100 000 inhabitants).
The inter-ministerial action plan defined a strategy for 2016 for automated speed control. The current objective is to modernise the cameras already in place and to multiply by four the number of controlled areas. It is planned for 10 000 mock speed cameras and 500 real ones to be installed within a three year period, bringing the overall total to 4 700 devices as compared to 4 200 today.
In accordance with the Safe System approach, traffic calming measures have been widely adopted in the urban space, such as "zone 30". Since 2015, the mayor has the power to lower speed limits in all or part of urban and residential areas to 30 km/h.
Protective equipment for motorcyclists
- A guide was released in 2012 to promote the benefits of individual protective equipment. In 2014 and 2015, a partnership with insurance companies, protective equipment providers and bikers' associations set up an incentive scheme for users of motorised twowheelers to purchase personal protective equipment as a package deal (gloves, boots, clothing and possibly an airbag suit).
- In 2015, the Inter-ministerial Road Safety Committee (CISR) made it compulsory for motorcyclists to have technical checks for motorised two-wheelers on the occasion of a sale, and to wear certified gloves.
- Wearing the safety vest is mandatory for motorcycle users in case of emergency stop.
Education and awareness
- National advertising campaigns to combat alcohol and drug consumption when driving were widely disseminated (with the well-known character "Sam", who drives and does not drink). A campaign was launched on the 10-year anniversary of "Sam", www.lebureaudecom.fr/securiteroutiere/cp\_emailing\_sam\_10ans\_dec2015.html (accessed 25 April 2016).
- At Christmas and New Year, a message is diffused to encourage a person who has been drinking to refrain from driving ("Quand on tient à quelqu'un, on le retient"). www.securiteroutiere.gouv.fr/medias/campagnes/quand-on-tient-a-quelqu-un-on-le-retient2 (accessed 25 April 2016).
- A new initiative concerning text messaging while driving was launched ("When you look at your smartphone while driving, who looks at the road?"). "Driving mode", a mobile application, was also created to put the phone into standby mode while driving.
Important advertising campaigns for motorised two-wheeler users are conducted each year. To make motorcyclists more aware of crash circumstances, the slogan was: "With motorcycles, the danger is in thinking that there isn't any!" The film won an award at the 2013 Global Road Safety Festival. French cinema continues to be mobilised in favour of road safety with the release of the short-film "When love will be dead" ("Lorsque l'amour sera mort") in 600 movie theatres and on the internet. www.securite-routiere.gouv.fr/medias/ campagnes/lorsque-l-amour-sera-mort-le-nouveau-film-d-erick-zonca (accessed 25 April 2016).
In 2015, a fact-checking platform ("A l'épreuve des faits") was launched online to respond to common beliefs about, and enable citizens to acquire a better understanding of, road safety issues. www.securite-routiere.gouv.fr/en-parler-agir/a-l-epreuve-des-faits (accessed 25 April 2016).
A new programme entitled Shockwave ("Onde de choc") was introduced to propose a new approach to road safety risks. The goal is to boost awareness that road crashes impact not only the victims, but also their family, their friends and the people they work with. www.lebureaudecom.fr/securiteroutiere/cp\_emailing3\_janv2016.html (accessed 25 April 2016).
Infrastructure
- New motorways are being equipped with rumble strips on the edges of road markings to prevent crashes due to drowsiness.
- As one of the 26 priority measures of January 2015, additional yellow "No Entry" signs can be installed on exit slip roads to prevent accessing the motorway the wrong way.
Vehicles
● To improve understanding of crash mechanisms, the French government is supporting the European initiative to look into the feasibility of standardising CAN bus data in vehicles and making them available for research purposes.
Recent and ongoing research
Some research projects are presented below.
Mobility
- Cycling and Walking Action Plan *(*PAMA): in 2014, 25 measures were announced by the Minister of the Environment with a view to encouraging cycling for both utility and recreational purposes. Its objective is to create a supportive framework to share public space and secure "active mobility". A second phase was launched with the preparation of new measures by the beginning of 2016. www.certu-catalogue.fr/plan-d-actions-pour-lesmobilites-actives-pama.html (accessed 25 April 2016).
- Pedestrian accidents on rehabilitated roads with dedicated lanes for public transport: this study focused on identifying pedestrian safety issues caused by the modernisation and sophistication of urban spaces. It analysed impact of urban development, the design of tramway platforms and bus lanes, and pedestrian behaviour (distraction, alcohol, decision-making criteria for crossing). www.territoires-ville.cerema.fr/IMG/pdf/150616- Rapport-Pi\_TC-1erephase-V2\_cle0eee6c.pdf (accessed 25 April 2016).
Powered two-wheel vehicles
● Emergency braking of motorcycles: an experiment led by CEREMA and UTAC-CERAM (car, motorcycle and bicycle technical union), demonstrated that, in the case of emergency braking, braking distances are longer for motorcycles than those estimated for passenger cars (Rapport CEREMA "Freinage d'urgence motos vs voitures particulières").
Ageing of the population
- Studies on the mobility of senior citizens: several studies were carried out to identify indicators of cognitive and functional fragility (fatigue, slow movement, concentration problems) and how older population adapt their driving behaviour.
- This subject was developed at the Entretiens Jacques-Cartier (www.territoires-ville.cerema.fr/ les-aines-et-la-securite-routiere-a1025.html), and at a seminar in 2014 www.mobiliteinclusive. com/wp-content/uploads/2015/11/La-mobilite%CC%81-des-seniors-en-France.pdf (accessed 25 April 2016).
Infrastructure
- Saving lives by return of analysis on accidents (SVRAI): this research highlights the contribution of crash analysis to road infrastructure and diagnosis of driver behaviour. www.ouest.cerema.fr/IMG/pdf/2011-10-11\_Projet\_SVRAI.pdf (accessed 25 April 2016).
- Prevention of lane departures by use of audio rumble strips (ROADSENSE): the ROADSENSE project aims to define, conceive, deploy and validate experimentally the use of audio rumble strips installed at the edge the road which produce a sound alert and vibration when driving over it. This alert is intended to correct lane departures of distracted, disoriented or tired drivers. https://hal.archives-ouvertes.fr/hal-00810905/document (accessed 25 April 2016).
- Impact of visual information on driving behaviour (I2V): this study identified and measured visual information (reading process, legibility, visual perception) and its impact on driving behaviour (decision-making process), to facilitate conception of traffic calming measures. http://actions-incitatives.ifsttar.fr/orsi-mobilites/encours/i2v/ (accessed 25 April 2016).
On-going research (3 or 4 year research programmes)
- Evaluation of road safety policies (EPSR): the main objective of this study is to provide a systematic evaluation of road safety policies. It will offer a framework for assisting in the decision-making process (ex ante) and assessing the impact of road safety measures (ex post).
- Scientific knowledge of motorcycles (COSMOS): this study based on the theory of commitment aims at inciting drivers to reduce speed with an engaging awareness and communication measure.
- Estimation of the real number of seriously injured people in road crashes (REG-TRAUMA): this project is a continuation of previous work based on the linkage of the BAAC and the Rhone county hospital files to assess the real number of people seriously injured. Results are then extrapolated to estimate the number of people injured on the whole territory of France.
- An improved understanding of injuries of road traffic accident victims based on the TraumaBase registry: a trauma registry entitled TraumaBase was created in the Ile-de-France region. This study aims at identifying potential statistical data and information on injuries from the TraumaBase registry, compared to those provided by the BAAC and the Rhone registry.
Business phone use during driving (TelProf): this exploratory analysis seeks to identify and learn more about the use of the telephone and nomadic systems by professionals. This study aims to provide ergonomic recommendations for the development of specific systems for professionals.
Senior citizens' driving: accountability and adaptation (Cosera): the aim of this study is to improve knowledge of the road risk incurred by older road users due to their greater physical frailty and age-related cognitive impairment. Its second objective is to propose potential areas for improvement of interventions and educational activities.
Accessibility of the driving test for the deaf (Acosur): the aim of this research is to elaborate and assess a unique type of support, based on graphic visualisations and video content to facilitate learning the Highway Code for members of the public with linguistic difficulties.
References
CGSP (2013), L'évaluation socioéconomique des investissements publics. Commissariat général à la stratégie et à la prospective (CGSP), Paris.
Websites
- ONISR The French Road Safety Observatory: www.securite-routiere.gouv.fr/la-securite-routiere/lobservatoire-national-interministeriel-de-la-securite-routiere.
- ❖ Road Safety in France: 2014 Annual Report. www.securite-routiere.gouv.fr/la-securite-routiere/lobservatoire-national-interministeriel-de-la-securite-routiere/accidentalite-routiere
- ❖ French Road Safety Results- Provisional 2015. www.securite-routiere.gouv.fr/la-securite-routiere/lobservatoire-national-interministeriel-de-la-securite-routiere/english-version/road-safety-annual-reportsin-france.
- IFSTTAR The French Institute of Science and Technology for Transport, Development and Networks: www.ifsttar.fr/.
- CEREMA The French Research Centre on Risks, Environment, Mobility and Planning www.cerema.fr.
- Health and Driving: This website gathers information from the latest news and scientific papers driving ability. http://medecins.inserr.org/.
Chapter 13
Germany
This chapter presents 2014 road safety data for Germany along with provisional data from 2015. It looks at trends in traffic and road safety from the years 1991 to 2014 and road user behaviour patterns. This includes data on speed, drink driving, drugs and driving, distracted driving, fatigue and seat belt and helmet use. The chapter reviews Germany's road safety strategy and national targets to 2020 and the progress achieved thus far. It also highlights the most recently implemented safety measures and current research work.*
* All data stem from BASt, the Federal Highway Research Institute of Germany, and IRTAD unless otherwise noted. For more information please contact: schoenebeck@bast.de
Germany, with its 81.5 million inhabitants, is the most populous country in the European Union. Following the good performance seen over the previous two years, 2014 saw 3 377 road deaths, a small increase of just over 1%. Preliminary data from 2015 show an additional increase of 3%. The milder winters and an increased volume of traffic linked to an improved economic situation are both factors to be taken into consideration. Cyclists and motorcyclists remain the most affected by these increases. Over the next five years, Germany's road safety strategy will focus on safety for motorcyclists and car passenger occupants on rural roads, and measures to protect vulnerable users such as pedestrians and cyclists in urban areas.
Road safety data collection
Definitions applied in Germany
Data in this report correspond to the consolidated set of police data.
- Road fatality: Road death which occurs within 30 days of a road crash.
- Injury crash: Road crash resulting in at least one injured or killed person.
- Seriously injured: Any person immediately taken to hospital after a road crash for inpatient treatment of at least 24 hours.
- Slightly injured: Any other person injured in a road crash.
According to directives from the European High Level Group on Road Safety all European Union member states are requested to estimate their number of critically injured persons, defined as those with injuries rated as Maximum Abbreviated Injury Scale of 3 or more (MAIS3+) from 2014 onwards. In Germany, the number of MAIS3+ is extrapolated from data from the German In-Depth Accident Study (GIDAS)
Data collection
In Germany, crash data are collected by the police agencies of the different federal states (Bundesländer) and then consolidated at a federal level.
As the crash data is collected by the police, only accidents which are known to the police are registered. For fatalities, the reporting rate is suspected to be nearly 100%. No information is available on the percentage of crash injuries that are not reported.
Most recent safety data
Road crashes in 2015 – provisional data
In 2015, 3 475 people died on roads in Germany representing an increase of almost 3% compared to the previous year. The number of injury crashes increased by 1%. The number of injured road users increased as well by 1% for the same time period.
This is the second consecutive year with an increase in the number of road fatalities and crashes. This increase was observed more particularly in fatalities on urban roads (6.6%) and on motorways (10.4%). The increase in 2014 was strongly characterised by the fatality numbers for cyclists (+12%) and motorcyclists (+19 %) whereas the rising numbers for 2015 concerned in particular car occupants, with an increase of 3%, which is not that spectacular on a percentage basis, but equates in absolute numbers to nearly 50 fatally injured car users. While the number of fatally injured cyclists, following the rise in 2014, slightly decreased in 2015, by 3%, the number of fatally injured motorcyclists again increased by nearly 9%.
While other factors play an important role in the long-term development of fatality and crash figures, once again in 2015, as in 2014, the relatively mild winter and warm and early spring is likely to have resulted in an increase in the number of road users. The good economic performance in Germany in 2015 led to a higher increase in the annual mileage than previous years.
Road crashes in 2014
Following two years of reductions in road fatality numbers, 3 377 people died on roads in Germany in 2014, representing an increase of slightly more than 1% compared to the previous year. Due to the increase in the number of vehicle kilometres the fatality rate remains stable at 4.6 deaths per billion vehicle kilometres. The numbers of injured persons increased by nearly 6% for seriously injured and 4% for slightly injured. The number of injury crashes in 2014 was higher than the preceding two years and increased by nearly 4% compared to 2013.
Taking into account the development of the accident and fatality numbers of the last years, the Mid-Term Review of the 2011-2020 Road Safety Programme identified two key areas of action for the second half of the Road Safety Programme. On rural roads the main focus will be on users of passenger cars and motorcyclists and on urban roads the priority will be on measures to protect pedestrians and cyclists in particular.
Trends in traffic and road safety (1990-2015)
Traffic
Between 1991, the first year following German reunification, and 2014, the number of motorised vehicles increased by 22.5% and vehicle kilometres driven rose by 29%.
Provisional figures for 2015 indicate that the overall traffic volume increased by 2.3%.
Road safety
Crashes and casualties
Between 1991 and 2014, the number of fatalities decreased by 70%, whereas the number of injury crashes fell by only 21.5%. In recent years (2000-2014), the number of fatalities decreased by 55%, while the number of seriously injured decreased only by 34%.
The decrease in the number of crashes and fatalities is due to various changes in all fields of road safety: traffic safety-related behaviour and education as well as infrastructure and vehicle safety. The improvements in road safety are due to several measures taken and regulations introduced in the past 10 years. Some highlights include:
- road safety education in schools
- accompanied driving programme and alcohol prohibition for novice drivers
- road safety audits
treatment of accident black spots
improvements in passive and active vehicle safety
identifying special fields of road safety and finding solutions, such as requiring child restraint systems, protecting trees on the roadside and adding underrun protection for guard rails to prevent serious motorcycle accidents.
Rates
Since 1991, the death rate per 100 000 inhabitants has decreased by more than 70%, while the number of vehicles registered per 1 000 inhabitants has increased by more than 22%.
Analysis of seriously injured data
In 2014, 21.6 % of all hospitalised road accident casualties are MAIS3+ which equals 14 645 critically injured persons.
Table 13.1. Road safety and traffic data
| 2014 % change from | |||||||||
|---|---|---|---|---|---|---|---|---|---|
| 1991 | 2000 | 2010 | 2013 | 2014 | 2013 | 2010 | 2000 | 1991 | |
| Reported safety data | |||||||||
| Fatalities | 11 300 | 7 503 | 3 648 | 3 339 | 3 377 | 1.1 | -7.4 | -55.0 | -70.1 |
| Injury crashes | 385 147 | 382 949 | 288 297 | 291 105 | 302 435 | 3.9 | 4.9 | -21.0 | -21.5 |
| Injured persons hospitalised | 131 093 | 102 416 | 62 620 | 64 057 | 67 732 | 5.7 | 8.2 | -33.9 | -48.3 |
| Seriously injured (MAIS3+) | 14 645 | ||||||||
| Deaths per 100 000 inhabitants | 14.2 | 9.1 | 4.5 | 4.1 | 4.2 | 0.8 | -6.2 | -54.2 | -70.5 |
| Deaths per 10 000 registered vehicles | 2.5 | 1.4 | 0.7 | 0.6 | 0.6 | 0.2 | -12.0 | -56.5 | -75.6 |
| Deaths per billion vehicle kilometres | 19.7 | 11.3 | 5.2 | 4.6 | 4.6 | -0.9 | -11.9 | -59.7 | -76.8 |
| Traffic data | |||||||||
| Registered vehicles1 (thousands) | 44 925 | 53 106 | 52 289 | 54 480 | 55 011 | 1.0 | 5.2 | 3.6 | 22.5 |
| Vehicle kilometres (millions) | 574 100 | 663 302 | 704 800 | 725 700 | 740 500 | 2.0 | 5.1 | 11.6 | 29.0 |
| Registered vehicles per 1 000 inhabitants | 563 | 646 | 639 | 677 | 681 | 0.7 | 6.6 | 5.4 | 20.9 |
1. Registered vehicles including mopeds.
1 2 http://dx.doi.org/10.1787/888933385449
Figure 13.1. Road safety, traffic and GDP trends index 1991 = 100
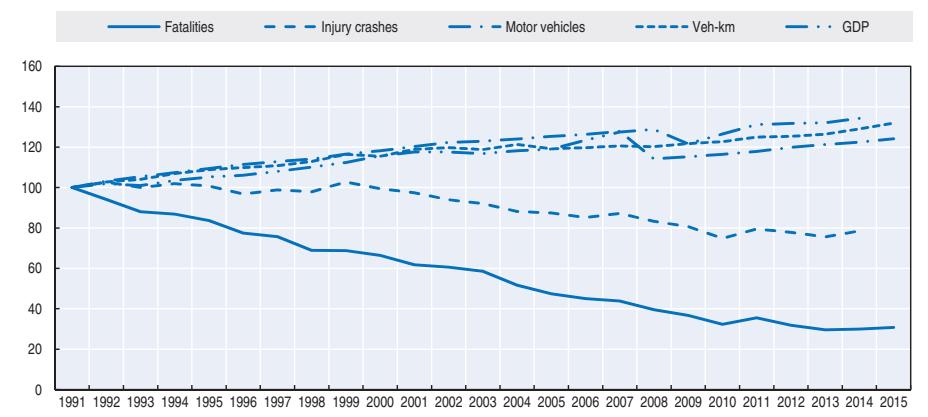
Source: World Bank for Gross Domestic Product (GDP; constant prices).
Road safety by user group
Germany is one of the world's most highly motorised countries. Motor vehicle occupants account for the large majority of traffic fatalities that occur each year on German roads. Fatalities among motor vehicle occupants and pedestrians have gradually decreased since 1991, with the reduction being strongest for passenger car occupants (-77%).
In 2014, Reduction in the number of fatalities was observed for pedestrians (-6%) and car occupants (-1%). The increase in fatalities affected, in particular, cyclists (+11.9 %) and motorcyclists (+3.3 %). This increase is mainly due to relatively warm and dry months at the beginning of the year leading to early use of bicycles and motorcycles. The seasonal trend of rising crash numbers for two-wheelers in spring started one or two months earlier than in previous years.
For the first time in 2014, official crash statistics made a distinction between cyclists using bicycles without electronic assistance and pedelecs (Ebikes). In 2014, nearly 10% of cyclists killed were using a pedelec.
| 2014 % change from | |||||||||
|---|---|---|---|---|---|---|---|---|---|
| 1991 | 2000 | 2010 | 2013 | 2014 | 2013 | 2010 | 2000 | 1991 | |
| Cyclists | 925 | 659 | 381 | 354 | 396 | 11.9 | 3.9 | -39.9 | -57.2 |
| Moped users | 243 | 157 | 74 | 73 | 87 | 19.2 | 17.6 | -44.6 | -64.2 |
| Motorcyclists | 992 | 945 | 635 | 568 | 587 | 3.3 | -7.6 | -37.9 | -40.8 |
| Passenger car occupants | 6 801 | 4 396 | 1 840 | 1 588 | 1 575 | -0.8 | -14.4 | -64.2 | -76.8 |
| Pedestrians | 1 918 | 993 | 476 | 557 | 523 | -6.1 | 9.9 | -47.3 | -72.7 |
| Others | 421 | 353 | 242 | 199 | 209 | 5.0 | -13.6 | -40.8 | -50.4 |
| Total | 11 300 | 7 503 | 3 648 | 3 339 | 3 377 | 1.1 | -7.4 | -55.0 | -70.1 |
Table 13.2. Road fatalities by road user group
Figure 13.2. Road fatalities by road user group in percentage of total 2014
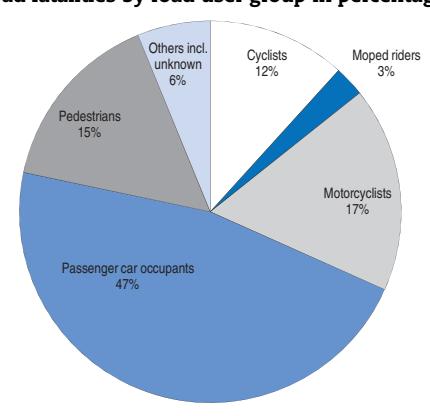
Road safety by age group
Since 2000, the number of fatalities decreased in all age groups. But while the number of fatalities decreased by 50% and more for the age groups less than 65 years, the 25% reduction for the over 65s is the smallest. This is largely attributed to demographic change, as the older population is growing quickly.
In 2014, road fatalities increased for nearly all age groups. Only the age group of novice drivers again decreased. The 65+ age group showed a very slight decrease after a strong increase the year before.
The number of fatalities decreased in 2014 for the 18-20 age group (-4%) and those above 65 (-1%). Despite this improvement, the 18-20 year olds still have a mortality rate more than double that of the general population. Graduated licensing and accompanied driving programmes are important measures to counter driver inexperience, particularly among those aged 18 to 20 years old.
| 2014 % change from | |||||||||
|---|---|---|---|---|---|---|---|---|---|
| Age | 1991 | 2000 | 2010 | 2013 | 2014 | 2013 | 2010 | 2000 | 1991 |
| 0-5 | 201 | 58 | 39 | 19 | 27 | 42.1 | -30.8 | -53.4 | -86.6 |
| 6-9 | 140 | 63 | 21 | 13 | 14 | 7.7 | -33.3 | -77.8 | -90.0 |
| 10-14 | 170 | 119 | 44 | 26 | 30 | 15.4 | -31.8 | -74.8 | -82.4 |
| 15-17 | 415 | 336 | 101 | 89 | 91 | 2.2 | -9.9 | -72.9 | -78.1 |
| 18-20 | 1 204 | 933 | 327 | 246 | 236 | -4.1 | -27.8 | -74.7 | -80.4 |
| 21-24 | 1 545 | 803 | 363 | 247 | 260 | 5.3 | -28.4 | -67.6 | -83.2 |
| 25-64 | 5 754 | 3 876 | 1 842 | 1 698 | 1 732 | 2.0 | -6.0 | -55.3 | -69.9 |
| 65 | 1 853 | 1 311 | 910 | 999 | 987 | -1.2 | 8.5 | -24.7 | -46.7 |
| Total | 11 300 | 7 503 | 3 648 | 3 339 | 3 377 | 1.1 | -7.4 | -55.0 | -70.1 |
Table 13.3. Road fatalities by age group
Figure 13.3. Road fatality rates by age group Deaths per 100 000 inhabitants in a given age group, 1991-2014
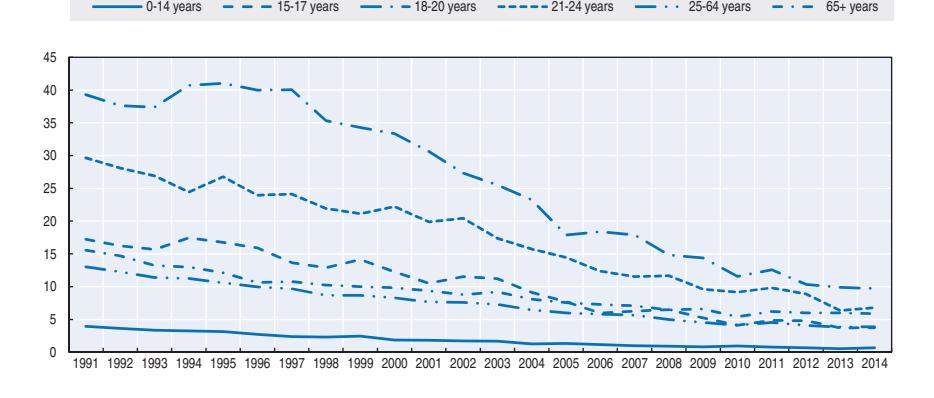
Road safety by road type
Rural roads are the most dangerous for road users, as nearly 60% of fatalities occur on this network. However, many improvements have been realised since the 1990s, such as construction of roundabouts to manage intersections and underrun protection for guard rails to prevent serious injuries to motorcyclists.
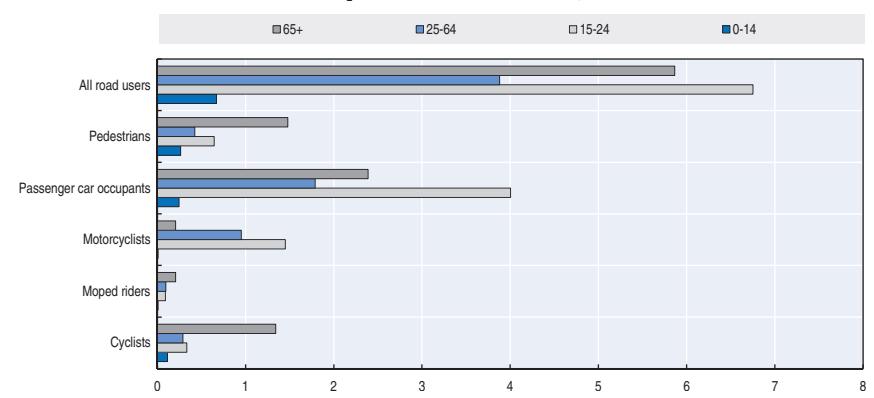
Figure 13.4. Road fatality rate by age and road user group Fatalities per 100 000 inhabitants, 2014
In 2014, following the increase in the number of fatalities seen on motorways in 2013, the number fell again in 2014 by 12.4%, with the increase registered mainly on rural roads (+4.4%). The number of fatalities on urban roads remained almost unchanged compared to 2013.
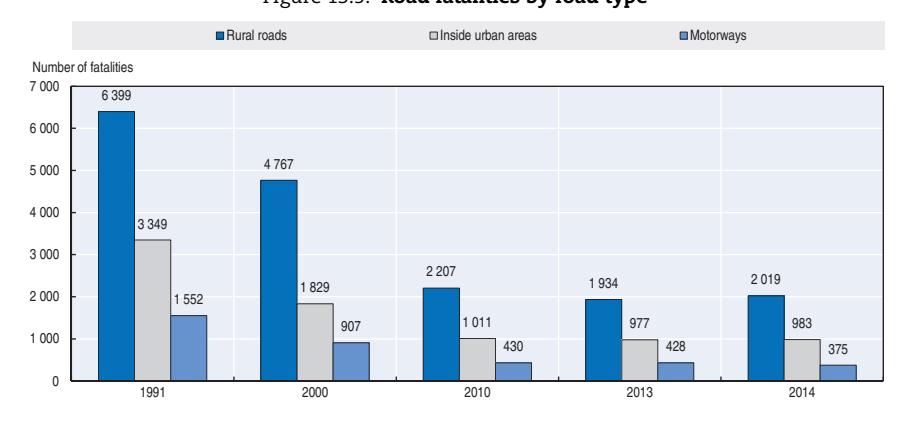
Figure 13.5. Road fatalities by road type
Economic costs of traffic crashes
The Federal Highway Research Institute (BASt, Bundesanstalt für Straßenwesen) calculates the cost of road crashes on an annual basis. The cost of road traffic crashes to Germany's national economy is based on the capital approach, encompassing costs for personal injuries and damage to goods. Calculated costs include:
● direct costs (medical treatment, vehicle repair/replacement)
- indirect costs (police services, legal system, insurance administration, replacement of employees)
- lost potential growth (including the shadow economy);
- lost added value of housework and voluntary work
- humanitarian costs
- costs of travel time lost due to accidents on motorways.
Traffic crashes represent a significant cost for society, estimated in 2014 at around EUR 33 billion, or 1.1% of Germany's GDP. It is estimated that since 2005 crash costs have increased by 4%. These figures do not include an estimation of costs of non-reported crashes.
The most recent information on costs for road accidents in Germany can be downloaded from the website of the Federal Highway Research Institute (www.bast.de).
| | Unit cost | Total | | |-----------------------|---------------|-------------------|--| | Fatalities | EUR 1 191 397 | EUR 4.03 billion | | | Hospitalised persons | EUR 120 921 | EUR 8.23 billion | | | Slight injuries | EUR 5 014 | EUR 1.71 billion | | | Property damage costs | n.a. | EUR 18.80 billion | | | Total | | EUR 32.77 billion | | | Total as % of GDP | | 1.1% | |
Table 13.4. Costs of road crashes, 2014
Recent trends in road user behaviour
Speed
Inappropriate speed was a factor in nearly 34% of fatal crashes and about 15% of injury crashes in 2014. Speed is often cited as a factor in combination with other high-risk behaviours, such as drink-driving.
The table below summarises the main speed limits in Germany.
Table 13.5. Passenger car and truck speed limits by road type, 2016
| General speed limit Passenger cars | General speed limit trucks > 3.5 t | |
|---|---|---|
| Urban roads | 50 km/h | 50 km/h |
| Rural roads | 100 km/h | 60 km/h |
| Motorways | 130 km/h (recommended) | 80 km/h |
Drink driving
In Germany, driving with blood alcohol content (BAC) over 0.5g/l is punishable by a fine, licence suspension and possibly jail. In addition, drivers with a BAC between 0.3g/l and 0.5g/l can have their licence suspended if their driving ability is impaired. Since 2007, as part of Germany's graduated licensing programme, a zero BAC is required for drivers under 21 and those in their probationary period.
In 2014, alcohol use was cited as a contributing factor in 7.8% of all fatal crashes, defined as those where a driver had any alcohol in the blood. The number of alcohol related crashes as well as alcohol related fatalities has decreased continuously over recent years by 10% and 24% respectively since 2010
Drugs and driving
Driving under the influence of drugs is considered an offence. A driver is considered "under the influence" if drugs can be found in his blood – irrespective of the amount or concentration. This regulation refers to a selected list of drugs. Drugs used as medication and administered as intended are exempted.
In 2014, there were 1 540 drug related crashes in Germany causing 42 fatalities and 2 113 injuries. The figures have risen from the 2000 level of 1 015, both from possible increased drug use as well as better education within the police agencies on detecting the influence of drugs.
Distraction
Using a hand-held mobile phone is prohibited while driving a motor vehicle or riding a bicycle. Motor vehicle violators are fined EUR 60 and 1 demerit point; cyclists are fined EUR 25. In 2011, 450 000 vehicle users violated this law, of whom 27% were female and 73% male.
Estimation of fatalities due to the use of mobile phones, based on the official accident statistics, is not possible, since mobile phone use is not assessed in the course of the collection of crash data by the police agencies.
Sleepiness and fatigue
According to the official accident statistics, 0.6% of injury crashes are attributed to fatigue. The number is expected to be underreported as it is difficult for police to identify fatigue as a cause of a crash.
Seat belts and helmets
Seat belt use has been compulsory for front seats since 1976 and rear seats since 1984. Fines for not wearing seat belts were introduced in the mid-1980s and led to a sharp increase in seat belt use. In recent years the seat belt wearing rates of adult car occupants are consistently high at 97%.
Children under the age of 12 and less than 150 cm tall must be restrained in motor vehicles by an approved system suitable for the child's height and weight. While the overall securing rate for children remains high at 98%, the use of specific child restraint systems is increasing slightly.
| % | |||
|---|---|---|---|
| 2000 | 2013 | 2014 | |
| Front seat | |||
| General (driver + passengers) | |||
| Driver | 94 | 97 | 98 |
| Passenger | 95 | 98 | 98 |
| Urban roads (driver) | 90 | 96 | 98 |
| Rural roads (driver) | 95 | 97 | 98 |
| Motorways (driver) | 98 | 98 | 99 |
| Rear seats | |||
| General | 82 | 97 | 98 |
| Children (use of child restraint) | 94 | 98 | 99 |
Table 13.6. Seat belt wearing rate by car occupancy and road type
ROAD SAFETY ANNUAL REPORT 2016 © OECD/ITF 2016 197
All riders of powered two-wheelers (PTWs) are required to wear helmets. Helmets are not mandatory for cyclists (including electric cycles with pedal assistance up to 25 km/h). The helmet wearing rate of riders of PTWs is high at 99%.
National road safety strategies and targets
Organisation of road safety
The Federal Ministry of Transport, Building and Urban Affairs is responsible for transport policy and road safety at the national level. It develops the national road safety strategy, including the national road safety action programme, and sets and monitors national targets.
Each of the 16 federal states has its own Ministry of Transport. These ministries can formulate road safety programmes independently and are usually responsible for improvements in road infrastructure in their own state. Police forces are organised at the state level, and enforcement of traffic laws is the responsibility of each federal state.
Road safety strategy for 2011-2020
The 2011-2020 road safety programme was launched in the last quarter of 2011. The principal aim of the programme is to enable safe, ecologically sensitive and sustainable mobility for all road users in Germany. It has a wide range of road safety measures addressing users, vehicles and the infrastructure.
The programme addresses new challenges, such as demographic change and the mobility of senior citizens, and it aims at safeguarding the efficiency of the road network. It reflects recent technological developments in vehicles such as driver assistance systems, co-operative vehicle systems and new engine concepts. In these latter areas, the main focus lies on ensuring that the development of vehicle technology does not induce safety risks. Activities also focus on rural roads and on reducing the number of serious injuries as well as fatalities.
Road safety targets
The quantitative target for 2020 is a reduction by 40% in the number of fatalities. The target was defined on the basis of research regarding the expected development of road safety up until the year 2020. This target was established taking into account the -50% target of the European Commission and the level of road safety in Germany. There are also specific targets in individual federal German states.
A model was developed to predict the number of crashes and casualties in Germany for the years 2015-2020 and for different road types (motorways, rural and urban roads). The risks of crashes and injuries were subdivided for each mode of traffic and age of road user. The time series model assumes that efforts to improve road safety continue as they have in the past. The forecast, based on the model and an estimation of future traffic conditions in Germany, shows a considerable decrease (-30%) in the number of casualties.
Monitoring targets
Monitoring and assessment of road safety measures and progress toward the target is achieved with the Road Accident Prevention Report, which is prepared every two years and submitted to the German parliament (Bundestag). The report discusses the general development of road safety and contains a comprehensive collection of measures implemented in the two years following the last report, as well as major ongoing and concluded research, and planned projects and measures.
The detailed status of the implementation of the 2011-20 Road Safety Programme is regularly documented in a Federal government report published every two years. The latest report was published in 2014.
In addition the Road Safety Programme 2011-20 was subject to a mid-term review which was published in October 2015 (www.bmvi.de/SharedDocs/EN/Publikationen/mid-termreview-of-the-2011-2020-road-safety-programme.pdf?\_\_blob=publicationFile [accessed 3 May 2016]). The mid-term review takes stock of the achievements of recent years and looks ahead to the next five years in order to identify measures with the greatest potential for further enhancing road safety. Various measures in the fields of infrastructure, automotive engineering and human factors as well as cross-cutting measures have been proposed for the period until 2020 – e.g. stepping up the nationwide publicity and information campaigns, further measures to improve the preparation of novice drivers, optimising road infrastructure safety management, enhancing road safety by means of automated driving or promoting the market penetration of vehicle safety systems.
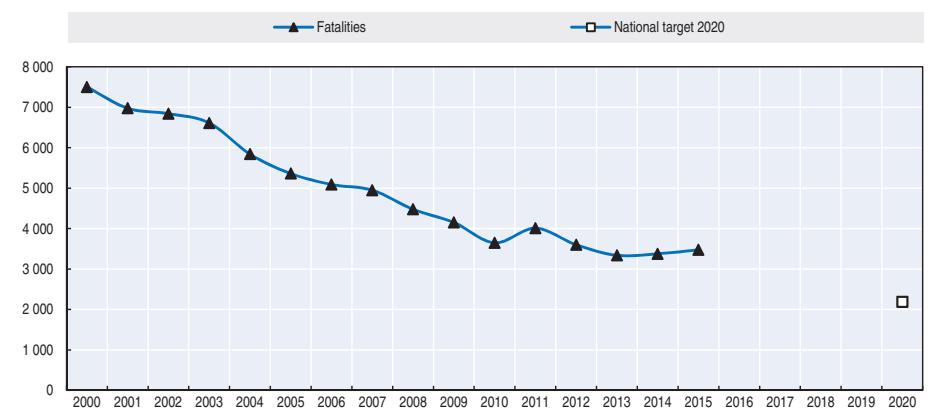
Figure 13.6. Trends in road fatalities towards national target
Recent safety measures (2013-16)
Road safety management
● The German demerit point system for drivers has been fully restructured and modernised. The new demerit point system entered into force on 1 May 2014. It was designed to increase the acceptability of the system and decrease bureaucracy. Demerit points are focused on traffic offences which impact on road safety, the higher the impact, the more demerit points, up to a maximum of three for an offence. Drivers can accumulate up to eight points at which point their driving licence is withdrawn. Under some conditions, demerit points can be reduced if the driver completes a voluntary seminar aimed at improving knowledge on road safety regulations and increasing their acceptance.
Road users
Protective equipment for motorcyclists
● The conditions for motorcycle driving tests changed in May 2014. During the test candidates mandatorily wear appropriate protective clothing consisting of a well-fitting motorcycle helmet, motorcycle gloves, a tight-fitting motorcycle jacket, a back protector (if not integrated in the jacket), motorcycle trousers and motorcycle boots with sufficient ankle protection.
Education and awareness
● The longstanding campaign "Runter vom Gas" (Slow Down!) has different modules, such as poster images and other media addressing a wide spectrum of problematic driver behaviour as well as the main issue of driving speed. In 2015, distraction was chosen as the main topic of the various activities. The campaign also advertised a sensible riding speed for motorcyclists as well as wearing a helmet while cycling (http://runtervomgas.de/).
Infrastructure
● The toll for Heavy Goods Vehicles (HGVs) with a permissible gross weight of 12 tonnes or over has been in force on German motorways and selected national roads since 2005. On 1 July 2015, the HGV toll was expanded to an additional 1 100 km of selected national roads. This was followed by the lowering of the permissible gross weight of HGVs under the law to 7.5 tonnes. The revenues must be used for the preservation and extension of the road infrastructure in Germany.
Vehicles
● Since July 2014, a high visibility vest must be available in all cars, goods vehicles and buses. Motorcycles are exempt.
Post-crash measures
● Since January 2013, digital rescue data sheets detailing specific information about vehicles (such as airbag locations, fuel type) are available to all emergency rescue personnel, improving the rescue chain in terms of efficiency and speed. Rescue personnel use an online license plate look-up service to call up the pertinent rescue data sheet for a vehicle that has been involved in an accident. As many rescue data sheets are already available in multiple languages, the system can be easily transferred to other countries around the globe. Moreover, the relevant software (DAT FRS: Deutsche Automobil Treuhand/ Feuerwehr Rettungsdaterblatt System [Fire Rescue System data sheet]) was designed to allow for integration of the rescue sheets in the future European automatic emergency call system eCall.
Recent and ongoing research
Some research projects are presented below:
● Follmer, R., A. Geis, D. Gruschwitz, J. Hölscher, D. Raudszus and A. Zlocki (2015), "Market penetration of vehicle safety systems" (Berichte der Bundesanstalt für Straßenwesen, Mensch und Sicherheit Heft M 258, Bergisch Gladbach), http://bast.opus.hbz-nrw.de/volltexte/ 2015/1538/.
- Fimm, B., A. Blankenheim and S. Poschadel (2015), "Dementia and road safety" (Berichte der Bundesanstalt für Straßenwesen, Mensch und Sicherheit Heft M 255, Bergisch Gladbach), http://bast.opus.hbz-nrw.de/frontdoor.php?source\_opus=1538&la=en.
- Schömig, N., S. Schoch, A. Neukum, M. Schumacher and B. Wandtner (2015), "Distraction effects of non-driving related activities – simulator studies" (Berichte der Bundesanstalt für Straßenwesen, Mensch und Sicherheit Heft M 253, Bergisch Gladbach), http:// bast.opus.hbz-nrw.de/frontdoor.php?source\_opus=835&la=de.
- Wagner, A., R. Segura, J. Mühlbauer, T. Fuchs, S. Peldschus and D. Freßmann (2015), "Agerelated adaptation of human body models for passive vehicle safety" (Berichte der Bundesanstalt für Straßenwesen, Mensch und Sicherheit Heft F 101, Bergisch Gladbach), http://bast.opus.hbz-nrw.de/frontdoor.php?source\_opus=1292&la=en.
- Schmidt, E.A., H. Hoffmann, R. Krautscheid, M. Bierbach, A. Frey, J. Gail and C. Lotz-Keens (2015), "Camera-monitor systems as a replacement for exterior mirrors in cars and trucks" (Berichte der Bundesanstalt für Straßenwesen, Mensch und Sicherheit Heft F 112, Bergisch Gladbach), http://bast.opus.hbz-nrw.de/frontdoor.php?source\_opus=1655&la=en.
- Schreck, B. and P. Seiniger (2015), Driver assistance system for right-turning (Berichte der Bundesanstalt für Straßenwesen, Mensch und Sicherheit Heft F 104, Bergisch Gladbach), http://bast.opus.hbz-nrw.de/frontdoor.php?source\_opus=1222&la=en.
- Alrutz, D., W. Bohle and S. Busek (2015), "Use of cycle paths in the opposite direction Improvements in safety" (Berichte der Bundesanstalt für Straßenwesen, Mensch und Sicherheit Heft V 261, Bergisch Gladbach), http://bast.opus.hbz-nrw.de/frontdoor.php? source\_opus=1610&la=en.
References
Websites
- Federal Ministry of Transport, Building and Urban Affairs: www.bmvi.de/EN/Home/home\_node.html.
- Road safety programme 2011-2020: www.bmvi.de/SharedDocs/EN/Artikel/LA/road-safety.html.
- Federal Highway Research Institute (BASt): www.bast.de/EN/Home/home\_node.html; Research reports: www.bast.de/EN/Publications/Reports/Reports\_node.html; Electronic BASt-archive: http://bast.opus.hbznrw.de/.
- German Federal Statistical Office's accident statistic reports: www.destatis.de/DE/ZahlenFakten/ Wirtschaftsbereiche/TransportVerkehr/Verkehrsunfaelle/Verkehrsunfaelle.html.
- German Road Safety Council e.V.: www.dvr.de/.
- German In-Depth Accident Study (GIDAS): www.gidas.org.
Chapter 14
Greece
This chapter presents 2014 road safety data for Greece along with provisional data from 2015. It looks at trends in traffic and road safety from the years 1990 to 2014 and road user behaviour patterns. This includes data on speed, drink driving, drugs and driving, distracted driving, fatigue and seat belt usage. The chapter reviews Greece's road safety strategy and national targets to 2020 and the progress achieved thus far. It also looks at recently implemented safety measures.
* All data stem from the National Technical University of Athens (NTUA) and IRTAD unless otherwise noted. For more information please contact: geyannis@central.ntua.gr
Greece saw its fifth consecutive year of significant decreases in fatalities in 2014, with a 10% decrease over 2013, i.e. 795 deaths. This has resulted in an overall decrease in fatalities for the period 2009-14 of 45%. In 2014, Greece had a mortality rate of 7.3 road deaths per 100 000 inhabitants, which is less than 40% of the rate of 2000. The deep economic crisis in Greece is one of the main contributing factors to these improvements. The country is on track to achieve its road safety targets for 2020, and aims to continue reducing fatalities by 50 each year from 2016 to 2020.
Road safety data collection
Definitions applied in Greece
- Injury crash: Any crash involving at least one road motor vehicle in motion on a public road or square to which the public has access (excluding yards, industrial sites or vehicle depots for public transport), resulting in at least one injured or killed person. Property damage only crashes are not included.
- Road fatality: Any person killed immediately or dying within 30 days as a result of an injury crash. (This national definition has applied since 1996. For the years prior to 1996 a conversion factor is applied to the fatality data in the International Road Traffic and Accident Database.)
- Seriously injured person: Any person who sustained an injury as result of an injury crash, such as brain damage, mutilation or other injuries that may result in lack of awareness or which are life-threatening.
Data collection
From the early 1960s, the Hellenic Statistical Authority (EL.STAT) has maintained Greece's official road crash database. This contains disaggregated road crash data and detailed information concerning drivers, road crash casualties and the vehicles involved. Data is coded on the basis of the Road Accident Data Collection Form, which is filled in by traffic police for every road crash with casualties.
Traffic Police respond to all crashes with casualties. Officers are responsible for filling in the Road Accident Data Collection Form and for finalising information concerning casualties within 30 days of the crash. Data are forwarded to EL.STAT and are also stored in the traffic police database. The EL.STAT database includes reliable and detailed information on road crashes, persons and vehicles as well as additional elements such as causes and conditions of the vehicles.
The Ministry of Infrastructure, Transport and Networks is responsible for vehicle registration and driver licensing. It maintains databases of registered vehicles and of licensed drivers. The registered vehicles database includes disaggregate information on vehicle characteristics, such as vehicle type and use, year of first registration, length, weight, engine size, fuel type, manufacturer, etc. This database does not include mopeds. Scrapped vehicles are systematically removed from the database. The driver license database includes disaggregate information on driver characteristics, such as license type and year, the related vehicle type, license renewal or modification, age, gender, etc. However, deceased drivers are not systematically removed from the database.
Data on the severity of injuries are not systematically collected by hospitals; only road fatalities are properly reported. Consequently, it is not currently possible to have data on serious injuries according to the definitions of the Maximum Abbreviated Injury Scale (MAIS).
Most recent safety data
Road crashes in 2015 – provisional data
Based on provisional data, it is estimated that there were 805 road deaths in 2015, recording a slight increase of 1.3% compared to 2014. This is the first increase since 2004, ending an impressive 49% road fatality decrease during the period 2008-14 which was strongly affected by the economic downturn.
The economic downturn is not yet over, but Greece has probably reached the point at which the drop in road fatalities has levelled off. There is a need for strengthened efforts to further improve road safety, with systematic action from the authorities and serious engagement from society.
Road crashes in 2014
The crash data for 2014 show a 10% decrease in fatalities compared to 2013. This was the fifth consecutive year with a significant (generally above 10%) decrease in fatalities, resulting in an overall decrease for the period 2009-14 of 45%. The fatality rate for Greece (7.3 deaths per 100 000 inhabitants) is for the first time closer to the EU average than to the least performing EU countries. As in the five preceding years, the decrease is mainly attributed to the joint effect of:
- more systematic initiatives from the relevant authorities, including intensification of enforcement, construction and upgrade of 2 500 km of motorways, urban mobility plans, educational campaigns, training and monitoring
- the deep economic crisis, which resulted in fewer vehicle-kilometres travelled (VKT), less speeding and less aggressive driving behaviours.
No specific studies are available yet to assess the relative contribution of these factors.
Trends in traffic and road safety (1990-2014)
Traffic
Since 1990, the number of motor vehicles (including mopeds) has more than tripled in Greece. During the decade 2000-09 an annual increase of about 5% was observed. Since 2009, the annual increase in the vehicle fleet has been less than 1%, although the number of motorcycles is increasing about 2% annually.
Between 2009 and 2014, traffic volume decreased by 20% on urban roads and 35% on toll motorways.
Road safety
Crashes and casualties
The number of fatalities reached a peak in 1995 with 2 411 road deaths. The 795 deaths in 2014 are 67% below the 1995 peak.
During the last decade, an important improvement was observed in road fatalities for young people, as well as in fatalities outside urban areas and in the number of people killed in crashes involving heavy goods vehicles. There was less improvement on motorways and for elderly road users, motorcyclists, foreign drivers and female drivers.
Over the last five years (2010-14), the number of fatalities decreased by about 37%. Since mid-2008, there have been some road safety developments such as the new Highway Code and new motorways, but the economic crisis has been the most important factor bringing a further significant decrease in road fatalities.
Rates
In 2014, Greece had a mortality rate of 7.3 road deaths per 100 000 inhabitants, which is less than 40% of the rate of 2000, but still above the EU average of 5.1.
| 2014 % change from | |||||||||
|---|---|---|---|---|---|---|---|---|---|
| 1990 | 2000 | 2010 | 2013 | 2014 | 2013 | 2010 | 2000 | 1990 | |
| Reported safety data | |||||||||
| Fatalities | 2 050 | 2 037 | 1 258 | 879 | 795 | -9.6 | -36.8 | -61.0 | -61.2 |
| Injury crashes | 19 609 | 23 001 | 15 032 | 12 109 | 11 690 | -3.5 | -22.2 | -49.2 | -40.4 |
| Deaths per 100 000 inhabitants | 20.3 | 18.7 | 11.2 | 8.0 | 7.3 | -8.9 | -35.3 | -61.1 | -64.1 |
| Deaths per 10 000 registered vehicles | 5.5 | 3.1 | 1.3 | 0.9 | 0.8 | -9.6 | -36.9 | -72.7 | -84.6 |
| Traffic data | |||||||||
| Registered vehicles1 (thousands) | 3 746 | 6 622 | 9 451 | 9 455 | 9 459 | 0.0% | 0.1% | 42.8% | 152.5% |
| Registered vehicles per 1 000 inhabitants | 275 | 464 | 721 | 730 | 737 | 0.9 | 2.2 | 58.7 | 168.1 |
Table 14.1. Road safety and traffic data
1 2 http://dx.doi.org/10.1787/888933385458
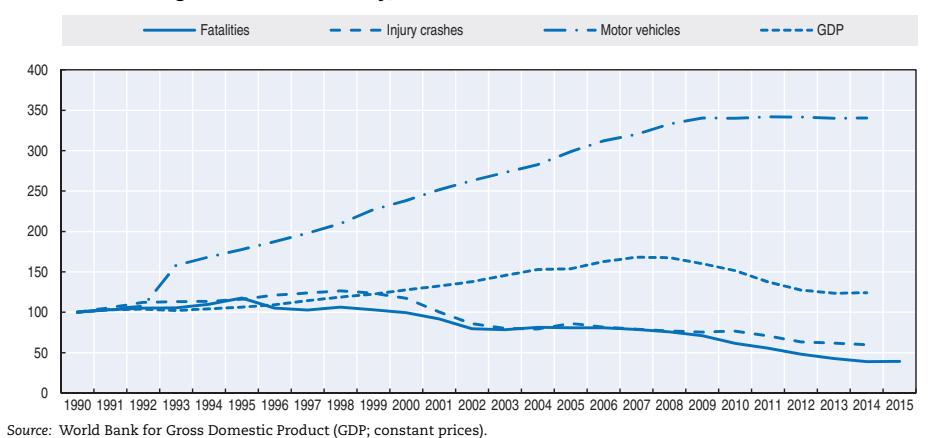
have benefited from the overall improvement in road safety. Between 1990 and 2014, the
Figure 14.1. Road safety, traffic and GDP trends index 1990 = 100
Since the peak in fatalities in 1995, all road users, with the exception of motorcyclists,
Road safety by user group
1. Registered vehicles including mopeds.
number of moped riders killed decreased by 90% mainly due to the lack of popularity of this form of transport, whereas the number of motorcyclists killed decreased by only 1%. Pedestrian fatalities decreased by 76%.
Since 2010, there has been less progress in reducing the number of fatalities among cyclists, a fact which might be attributed to the not negligible increase of cycle traffic in Greek cities.
Between 2013 and 2014, fatalities decreased for most user groups except cyclists and motorcyclists for whom fatalities slightly increased.
| 2014 % change from | |||||||||
|---|---|---|---|---|---|---|---|---|---|
| 1990 | 2000 | 2010 | 2013 | 2014 | 2013 | 2010 | 2000 | 1990 | |
| Cyclists | 26 | 22 | 23 | 15 | 19 | 26.7 | -17.4 | -13.6 | -26.9 |
| Moped users | 192 | 90 | 36 | 25 | 20 | -20.0 | -44.4 | -77.8 | -89.6 |
| Motorcyclists | 274 | 412 | 372 | 271 | 278 | 2.6 | -25.3 | -32.5 | 1.5 |
| Passenger car occupants | 712 | 891 | 542 | 347 | 289 | -16.7 | -46.7 | -67.6 | -59.4 |
| Pedestrians | 524 | 375 | 179 | 151 | 125 | -17.2 | -30.2 | -66.7 | -76.1 |
| Others | 322 | 247 | 106 | 70 | 64 | -8.6 | -39.6 | -74.1 | -80.1 |
| Total | 2 050 | 2 037 | 1 258 | 879 | 795 | -9.6 | -36.8 | -61.0 | -61.2 |
Table 14.2. Road fatalities by road user group

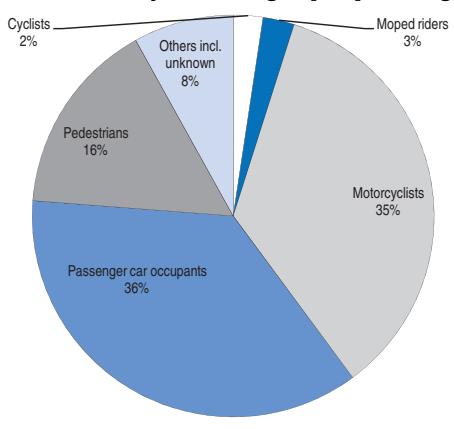
Road safety by age group
Since the peak in 1995, all age groups have benefited from a drop in fatalities, with the best performance seen for the 6-9 and 10-14 age groups.
Between 2010 and 2014, the 10-14 age group showed the highest decrease in the number of fatalities (-75%) followed by the 15-17 age group (-51%). However, with regard to the fatality rate per 100 000 inhabitants, young people have a much higher risk than other age groups, with the 18-24 year old group having a rate of over 13.
Between 2013 and 2014, fatalities decreased among all age groups.
ROAD SAFETY ANNUAL REPORT 2016 © OECD/ITF 2016 207
| 2014 % change from | |||||||||
|---|---|---|---|---|---|---|---|---|---|
| Age | 1990 | 2000 | 2010 | 2013 | 2014 | 2013 | 2010 | 2000 | 1990 |
| 0-5 | 22 | 16 | 12 | 5 | 4 | Figures too small for | -75.0 | -81.8 | |
| 6-9 | 40 | 9 | 6 | 2 | 3 | meaningful comparison | -66.7 | -92.5 | |
| 10-14 | 33 | 15 | 12 | 10 | 3 | -70.0 | -75.0 | -80.0 | -90.9 |
| 15-17 | 76 | 60 | 39 | 27 | 19 | -29.6 | -51.3 | -68.3 | -75.0 |
| 18-20 | 183 | 156 | 73 | 33 | 45 | 36.4 | -38.4 | -71.2 | -75.4 |
| 21-24 | 249 | 219 | 113 | 79 | 69 | -12.7 | -38.9 | -68.5 | -72.3 |
| 25-64 | 1 051 | 1 107 | 711 | 468 | 460 | -1.7 | -35.3 | -58.4 | -56.2 |
| 65 | 392 | 428 | 268 | 234 | 187 | -20.1 | -30.2 | -56.3 | -52.3 |
| Total | 2 050 | 2 037 | 1 258 | 879 | 795 | -9.6 | -36.8 | -61.0 | -61.2 |
Table 14.3. Road fatalities by age group
Figure 14.3. Road fatality rates by age group Deaths per 100 000 inhabitants in a given age group, 1990-2014
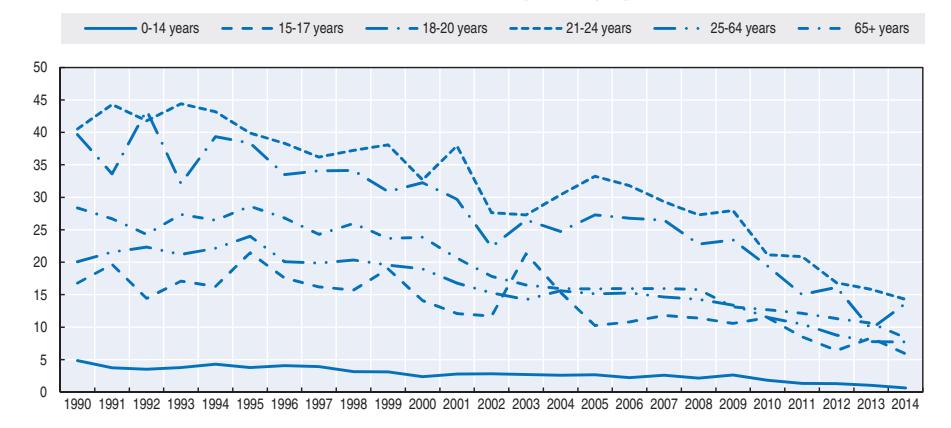
Road safety by road type
In 2014, 50% of fatal crashes occurred in urban areas (mainly due to the increased motorcycle and pedestrian traffic), 43% on rural roads and 7% on motorways.
Since 2000, there has been a 74% decrease in road deaths on the rural network, as almost 1 200 -km of the national interurban network were upgraded to motorways.
Economic costs of traffic crashes
Traffic crashes represent a significant cost for society, estimated in 2011 at around EUR 3.41 billion, representing almost 1.5% of Greece's GDP (Hellenic Institute of Transportation Engineers, 2012). This calculation uses a combination of the lost production methodology and the willingness-to-pay methodology.
The cost is almost tripled if the real numbers of injuries and of "material damage only" crashes are taken into account.
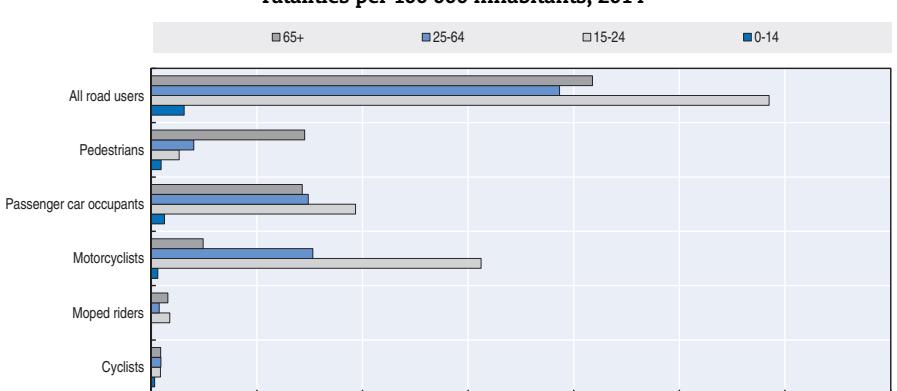
Figure 14.4. Road fatality rate by age and road user group Fatalities per 100 000 inhabitants, 2014
Figure 14.5. Road fatalities by road type
0 2 4 6 810 12 14
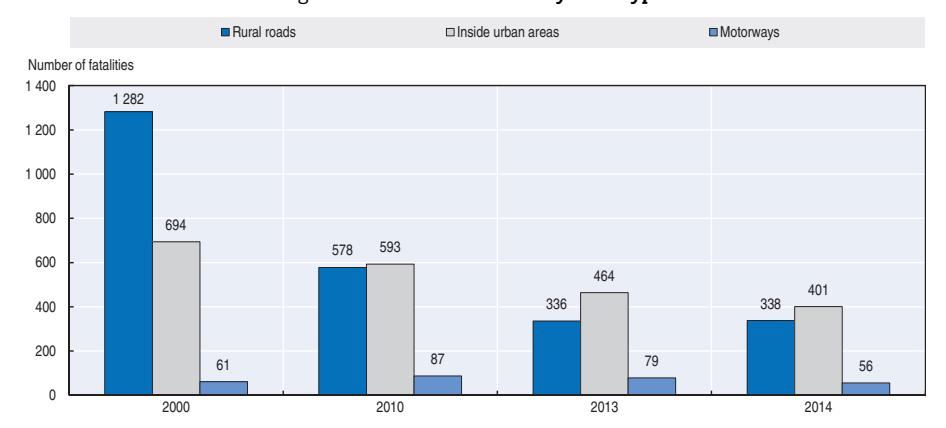
Table 14.4. Costs of road crashes, 2011
| Unit cost | Total | |
|---|---|---|
| Fatalities | EUR 2.32 billion | |
| Injury and disability | EUR 1.09 billion | |
| Total | EUR 3.41 billion | |
| Total as % of GDP | 1.45 |
Recent trends in road user behaviour
Speed
Speeding is perhaps the most critical factor for road crashes in Greece. Speeding enforcement varied during the last decade, with a direct impact on the progress of road safety trends. The recent important decline of road fatalities and speeding may be a result of the economic crisis encouraging more ecological driving.
The table below summarises the main speed limits in Greece.
Table 14.5. Passenger car speed limits by road type, 2016
| General speed limit | Comments | |
|---|---|---|
| Urban roads | 50 km/h | |
| Rural roads | 90 km/h | |
| Motorways | 130 km/h | Variable speed limits are implemented when variable message signs are available |
Drink driving
According to the Greek Highway Code, the maximum permissible blood alcohol content (BAC) is 0.5 g/l when measured by blood sample, and 0.25 mg/l when measured by breath testing.
Since 2007, a lower limit (0.2 g/l) has applied to professional drivers (heavy goods vehicles, school buses and coaches), motorcycles and moped riders.
Studies demonstrate that drivers over the legal limit are seven times more likely to be involved in a road crash.
It is estimated that, in 2014, almost 30% of road fatalities were attributed to drinkdriving. The share of alcohol-related fatalities has dropped by 9% since 2010 and a significant decrease of 22% was recorded between 2000 and 2014.
Drugs and driving
Driving under the influence of drugs is prohibited under Greece's Road Code. No data are available for drug related crashes.
Distraction
In Greece, it is forbidden to use a hand-held phone or headphones while driving. Only wireless, hands-free devices are permitted.
According to an observational study by the National Technical University of Athens (NTUA) in 2009, 9% of passenger-car drivers and 2% of powered two-wheeler riders use mobile phones while driving.
The mobile phone use rate increases inside built-up areas and for young drivers (16-24), especially for young female drivers of passenger cars (16%) and powered two-wheelers (12%).
Sleepiness and fatigue
No studies on the effect of fatigue on road safety were carried out in Greece.
Seat belts and helmets
The use of seat belts has been compulsory since 1987 in front seats and since 2003 in rear seats.
Children under 12 must be seated in a rear seat and be adequately restrained, taking into account their weight and height.
According to 2009 data, the seat belt use rate was 77% for drivers, 74% for a front seat passenger and 23% in rear seats. The percentage of seat belt use by the driver was 72% in urban areas, 78% on rural roads and 95% on motorways.
All riders of powered two-wheelers (PTWs) are required to wear helmets. The helmetwearing rate is 75% for drivers and 46% for passengers. Helmet use by the driver is 73% in urban areas, 85% on rural roads and 98% on motorways. There is no mandatory helmet use law for cyclists.
| % | |
|---|---|
| 2009 | |
| Front seat | |
| Driver | 77 |
| Passenger | 74 |
| Urban roads (driver) | 72 |
| Rural roads (driver) | 78 |
| Motorways (driver) | 98 |
| Rear seats | |
| General | 23 |
Table 14.6. Seat belt wearing rate by car occupancy and road type
National road safety strategies and targets
Organisation of road safety
The co-ordination of all the ministries involved in road safety management is ensured by the Inter-Ministry Committee on Road Safety, chaired by the Minister of Citizen Protection. However, his role remains limited, as the corresponding co-ordination secretariat has never been properly operational. Some stakeholder consultation takes place at the National Road Safety Council. Regional and local authorities implement road safety activities, mainly on road infrastructure and vehicle control; however, there is no process to integrate national and regional activities and there is no reporting from the regional to the national level.
Despite the three strategic plans adopted during the last decade, mobilisation of the authorities and of society remained limited and road safety is still not a recognised policy area. There is no identifiable budget for road safety.
Quite a few non-government organisations (NGOs) are strong advocates for road safety, with the Road Safety Institute Panos Mylonas, having a very active role. Road safety problems and solutions are well known in Greece through research studies; however, implementation of measures is limited. Furthermore, there is no official monitoring of road safety actions, no benchmarking and little evaluation of the road safety interventions.
Road safety strategy for 2011-20
The third National Road Safety Strategic Plan, developed by the NTUA, was approved by the Ministry of Infrastructure, Transport and Networks in September 2011. The aim of this strategic plan is the development of a strong road safety culture. The plan foresees a national road safety management structure comprising the Inter-Ministry Committee, the Parliamentary Committee, the National Advisory Committee as well as a framework for efficient implementation, monitoring and evaluation of road safety level and measures. The strategic plan is composed of six pillars: road safety education, road safety enforcement, safe road users, safe road infrastructure, safe vehicles and post-crash management.
Road safety targets
The strategic plan adopts the European target of reducing the number of road fatalities by 50% between 2010 and 2020. Intermediate targets include a reduction by 80 road fatalities per year between 2010 and 2015, which has been achieved partly due to the economic crisis, and a reduction of 50 road fatalities per year between 2016 and 2020.
Specific actions by the central and regional governments have been identified as necessary to reach the target. A prerequisite is a strong political will and support at the highest political level. The Inter-Ministry Committee, re-established twice (in 2010 and in 2014 under the chairmanship of the Prime Minister), is expected to play a critical role. The current challenge for road safety is to benefit from the major structural changes taking place in the public administration due to the economic crisis.
Monitoring targets
A significant reduction in road fatalities since 2010, attributed in part to the deep economic crisis in Greece, has brought the country close to its goals for road safety.
Even though the strategy has clearly defined the targets, the programmes and the implementation framework, some important barriers remain, such as the lack of systematic implementation of the measures and a lack of co-ordination and monitoring. The co-ordination instruments to support the Inter-Ministry Committee were never fully operational and the necessary resources were never allocated to the related road safety actions.
At the midway point of the decade, no special evaluation has been made. In addition, no new initiatives or strategies have so far been considered to enable achievement of the new Sustainable Development Goals. This is also the result of the political instability in 2015.
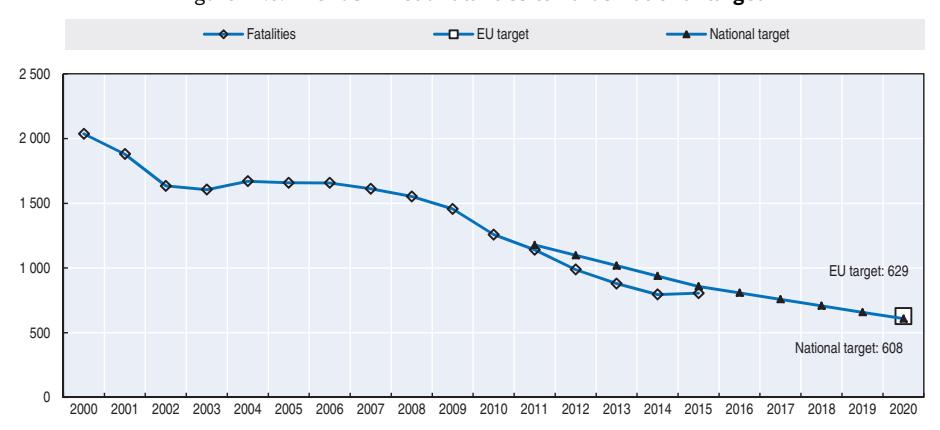
Figure 14.6. Trends in road fatalities towards national target
Recent safety measures (2013-16)
The unprecedented economic crisis during the last five years has resulted in a limited budget for road safety initiatives in Greece.
Some road safety measures are being implemented focusing on road safety police enforcement (for speeding, drink driving and use of seat belts and helmets) and through road safety education and information campaigns conducted mainly by private companies such as motorway concessionaires and NGOs. Greek universities and research institutes carry out many road safety research projects, thus supporting road safety actions in Greece.
Road safety management
- Following a new law, the Inter-Ministry Committee on Road Safety was re-established a first time in 2010 and a second time in 2014, this time under the chairmanship of the Prime Minister. However, this Inter-Ministry Committee has not met for the last three years.
- Road safety management is the responsibility of both national and regional authorities. During the last decade, more and more regional and local authorities have established and implemented regional road safety plans, sometimes within their urban mobility plans, which are starting to bring results.
Road users
● During the last five years, Greek drivers have improved their driving behaviour, becoming less aggressive and speeding less, as a consequence of the personal budget limitations brought by the economic crisis. This has resulted in significant safety improvements. The improved driver behaviour is expected to remain following the crisis, despite potential increase in traffic volumes.
Speed management
● The update of the Road Code is still under discussion and includes consideration of speed limit reviews for both traffic safety and efficiency reasons. Higher gas prices due to the crisis had a direct impact on average speed reduction and consequently to traffic safety improvement.
Education and awareness
● National, regional and local authorities regularly conduct campaigns and training on user behaviours like speeding, impaired driving, seat belt and helmet misuse, etc. However the impact of these efforts on traffic safety is unknown as no monitoring programme exists.
Infrastructure
● Due to the difficult economic conditions, the budget for road maintenance and safety intervention has been significantly reduced. Nevertheless, the major motorway development programme totalling 2 500 km of toll motorways (including the construction of 1 300 km of new motorways) restarted in 2013 and will gradually deliver all motorway sections between 2016 and 2018.
Vehicles
● All European Union regulations on vehicles are properly transposed into Greek legislation, resulting in higher safety standards for all new vehicles entering into circulation in Greece. Improved passive and active safety is one of the reasons for the significant reduction of persons killed and seriously injured in traffic crashes.
Recent and ongoing research
- The National Technical University of Athens (NTUA) and the Hellenic Institute of Transport (HIT/CERTh) are the two main road safety research organisations in Greece. Current research involves road crash analysis, road safety management, vehicle safety, driver behaviour and intelligent transportation systems.
- At the 6th national road safety conference, which took place in Athens on March 2015, several of these research results were presented. More information is available at www.nrso.ntua.gr/roadsafety2015/?page\_id=63 (accessed 16 May 2016).
References
Hellenic Institute of Transportation Engineers (2014), HITE position on Road Safety in Greece, HITE, 2014. Hellenic Institute of Transportation Engineers (2012), HITE position on Road Safety in Greece, HITE, 2012.
Websites
- Hellenic Statistical Authority: www.statistics.gr.
- Ministry of Infrastructure, Transport and Networks: www.yme.gr.
- Road Safety Observatory of the National Technical University of Athens: www.nrso.ntua.gr.
- Road Safety Institute Panos Mylonas: www.ioas.gr.
- Road Safety Resources in Greece: www.nrso.ntua.gr/links.
Chapter 15
Hungary
This chapter presents detailed 2014 road safety data for Hungary along with an overview of results from 2015. It looks at Hungary's road safety history and reviews trends in traffic and road safety from the years 1990 to 2014 along with road user behaviour patterns. This includes data on speed, drink driving, drugs and driving, distracted driving, fatigue and seat belt usage. The chapter reviews Hungary's road safety strategy and national targets to 2020 and the progress achieved thus far. It also highlights the most recently implemented safety measures.*
* All data stem from the Institute for Transport Sciences (KTI) and IRTAD unless otherwise noted. For more information please contact: Prof. Dr Péter Holló, hollo.peter@kti.hu
Hungary, with its population of 9.8 million, benefited from a seven-year period of decreasing road deaths from 2007 to 2013. This downward trend appears to have seen a reversal over the last two years with a total of 626 fatalities in 2014, an increase of 6%, followed by an additional increase of 3.4% in 2015 with 647 fatalities. This equals a rate of 6.5 deaths per 100 000 inhabitants in 2015. This could partly be attributed to economic recovery as both vehicles registered and kilometres travelled increased during this period.
Road safety data collection
Definitions applied in Hungary
- Road fatality: Person who dies within 30 days as a result of a traffic crash.
- Seriously injured person: Any person who, due to the crash, sustained an injury which meets one of the following criteria:
- ❖ necessitates hospitalisation for more than 48 hours within seven days of the accident;
- ❖ caused a fracture (except for finger, toe, nose fractures);
- ❖ caused cuts that resulted in serious bleeding or nerve, muscle or tendon injuries;
- ❖ caused injury of inner organs;
- ❖ caused a burn of second or third degree or a burn affecting more than 5% of body surface.
Data collection
Data on personal injury crashes are collected by the police and form the basis of the official Hungarian road crash statistics.
In Hungary, the provision of road traffic crash data is governed by the government decree on the National Statistical Data Collection Programme, in line with the Act on Statistics. It takes into account Council Decision 93/704/ EC, which stipulates that the member states provide their safety data to the European Commission for the elaboration of a European community database ("CARE"). The Hungarian national data collection system has been adjusted to be compatible with the Common Accident Data Set (CADaS) structure. Variables are divided into four categories: Accident, Road, Traffic Unit, and Person.
The European Commission and the International Road Traffic and Accident Database (IRTAD) have recommended that Hungary collect data on serious injuries based on the Maximum Abbreviated Injury Scale of 3 or more (MAIS3+). Experts are working on options to translate codes of the International Classification of Diseases, which are used in hospitals to define the nature and severity of injuries, into codes on the Abbreviated Injury Scale. In the short run, translation seems to be the main realistic option to collect MAIS3+ data. It is now planned that the severity of a crash will be determined by health care staff and not by the police. However, this requires some adjustments in the legislation.
The quality and completeness of police reported data is good for fatal crashes and casualties. However, based on previous research, it is estimated that only 85% of those seriously injured (based on the national definition) and 60% of those slightly injured are reported in police records.
Most recent safety data
Road crashes in 2015 – final data
In 2015, there were 647 road fatalities, a 3.4% increase when compared to 2014. This is the second consecutive year with an increase in the number of fatalities, after a seven-year period of continuous decrease. Recovery of the economy could explain this increase.
Road crashes in 2014
After a seven-year period of improvement (2007-13) the number of fatalities in 2014 increased by almost 6% compared to 2013, with 626 persons killed. The biggest increase was observed among vulnerable road users – cyclists and pedestrians.
Trends in traffic and road safety (1990-2014)
Traffic
The annual distance travelled (vehicle-kilometres) on the state road network decreased by 10% between 2008 and 2012. The decrease concerned both light and heavy vehicles. In 2013 the number of vehicle-kilometres was practically the same as in 2012, but in 2014 traffic volume increased by 4.2% over 2013, probably as a result of the economic recovery.
Road safety
Crashes and casualties
According to Prof. Dr Péter Holló, the history of Hungarian road safety can be divided into the following periods:
- 1976-86: Relatively stable period. The 30-day definition for road accident fatalities was introduced in 1976.
- 1987-90: Strong deterioration, similar to all countries where the political, social and economic systems changed following the collapse of the Soviet bloc. This political change was accompanied by negative side effects for road safety, due to weak police control, less political attention to road safety, a false interpretation of freedom, explosion in the size and changes in the structure of the vehicle fleet, etc. The worst year for Hungarian road safety was in 1990, with nearly 2 500 people killed.
1991-2000: Important improvements and major initiatives:
- ❖ 1993: Adoption of the first Hungarian National Road Safety Programme with a quantitative target. Road safety measures were implemented such as lower speed limits in built-up areas, mandatory daytime running lights and rear seat safety belt use outside built-up areas, intensified police control and road safety campaigns, more severe sanctions, etc.
- ❖ 2000 was the most successful year until 2008, with a reduction of more than 50% in the number of people killed (1 200) compared to 1990. Some demographic and economic factors contributed to the positive trend: a decrease in the number of novice drivers and an increase in vehicle operating costs.
2001-06: Deterioration, mainly outside built-up areas. In 2001, the speed limits outside built-up areas were raised. The level of police enforcement was insufficient, as was the organisation and funding of road safety activities.
2007-13: After several years of increasing road fatalities, the 2007 performance was back to that of 2000. In 2008, there was a remarkable decrease in fatalities – less than 1 000. In 2013 the number of road fatalities was as low as that of 50 years earlier. The improvement in the passive safety of vehicles is considered to be an important factor contributing to these positive results.
In 2014 and 2015, the number of fatalities increased.
Rates
In 2014, Hungary recorded 6.3 fatalities per 100 000 inhabitants, a rate almost four times lower than the maximum in the 1990s. However this rate has increased compared to 2013 by more than 6%. Based on the population data of 1 January 2015, the rate was 6.5 in 2015.
Fatalities per 10 000 registered motor vehicles (excluding mopeds) were divided by almost seven between 1990 and 2014 and by a factor of 2.5 since 2000. The rate was 1.61 fatalities in 2013 which increased slightly to 1.66 in 2014 and 2015.
| 2014 % change from | |||||||||
|---|---|---|---|---|---|---|---|---|---|
| 1990 | 2000 | 2010 | 2013 | 2014 | 2013 | 2010 | 2000 | 1990 | |
| Reported safety data | |||||||||
| Fatalities | 2 432 | 1 200 | 740 | 591 | 626 | 5.9 | -15.4 | -47.8 | -74.3 |
| Injury crashes | 27 801 | 17 493 | 16 308 | 15 691 | 15 847 | 1.0 | -2.8 | -9.4 | -43.0 |
| Deaths per 100 000 inhabitants | 23.4 | 11.7 | 7.4 | 6.0 | 6.3 | 6.3 | -14.2 | -46.0 | -73.0 |
| Deaths per 10 000 registered vehicles | 11.2 | 4.4 | 2.0 | 1.6 | 1.7 | 1.5 | -18.5 | -62.6 | -85.3 |
| Traffic data | |||||||||
| Registered vehicles1 (thousands) | 2 163 | 2 706 | 3 640 | 3 622 | 3 778 | 4.3 | 3.8 | 39.6 | 74.7 |
| Registered vehicles1 per 1 000 inhabitants | 208 | 265 | 363 | 366 | 382 | 4.6 | 5.2 | 44.5 | 83.5 |
Table 15.1. Road safety and traffic data
1 2 http://dx.doi.org/10.1787/888933385466
Road safety by user group
All user groups have benefited from important safety improvements since 1990, with the largest benefits for vulnerable road users: pedestrians (-81%), cyclists (-69%) and moped users (-82%)
In 2014, safety deteriorated for almost all road user groups, with the exception of powered two-wheeler riders. The situation in particular worsened for cyclists, with a 44% increase in the number of fatalities. This sharp increase might be related to a change in legislation, whereby it is no longer a traffic violation to ride a bicycle under the influence of alcohol.
Road safety by age group
Since 1990, the reduction in fatalities has benefited all age groups.
In 2014, there was an improvement among the 15-17 and 21-24 age groups, against a background of overall increase in fatalities by 5.9%. A marked deterioration was observed for the 18-20 age group, for which the number of fatalities more than doubled from 11 in 2013 to 24 in 2014.
1. Registered vehicles excluding mopeds.
20 40 80 100 120 140 160 180 200 1990 1991 1992 1993 1994 1995 1996 1997 1998 1999 2000 2001 2002 2003 2004 2005 2006 2007 2008 2009 2010 2011 2012 2013 2014 Fatalities Injury crashes Motor vehicles GDP
Figure 15.1. Road safety, traffic and GDP trends index 1990 = 100
Note: Registered motor vehicles excluding mopeds.
Source: World Bank for Gross Domestic Product (GDP; constant prices).
Table 15.2. Road fatalities by road user group
| 2014 % change from | |||||||||
|---|---|---|---|---|---|---|---|---|---|
| 1990 | 2000 | 2010 | 2013 | 2014 | 2013 | 2010 | 2000 | 1990 | |
| Cyclists | 313 | 182 | 92 | 68 | 98 | 44.1 | 6.5 | -46.2 | -68.7 |
| Moped users | 95 | 33 | 19 | 24 | 17 | -29.2 | -10.5 | -48.5 | -82.1 |
| Motorcyclists | 143 | 52 | 49 | 58 | 58 | 0.0 | 18.4 | 11.5 | -59.4 |
| Passenger car occupants | 974 | 500 | 330 | 254 | 256 | 0.8 | -22.4 | -48.8 | -73.7 |
| Pedestrians | 803 | 346 | 192 | 147 | 152 | 3.4 | -20.8 | -56.1 | -81.1 |
| Others | 104 | 87 | 58 | 40 | 45 | 12.5 | -22.4 | -48.3 | -56.7 |
| Total | 2 432 | 1 200 | 740 | 591 | 626 | 5.9 | -15.4 | -47.8 | -74.3 |
Figure 15.2. Road fatalities by road user group in percentage of total 2014
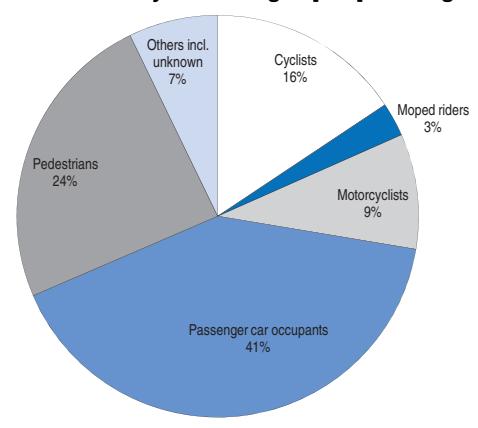
The 65 and over age group has the highest fatality rate, with 9 deaths per 100 000 inhabitants.
| 2014 % change from | |||||||||
|---|---|---|---|---|---|---|---|---|---|
| Age | 1990 | 2000 | 2010 | 2013 | 2014 | 2013 | 2010 | 2000 | 1990 |
| 0-5 | 28 | 17 | 6 | 1 | 3 | 200.0 | -50.0 | -82.4 | -89.3 |
| 6-9 | 39 | 9 | 3 | 3 | 3 | 0.0 | 0.0 | -66.7 | -92.3 |
| 10-14 | 40 | 18 | 11 | 3 | 7 | 133.3 | -36.4 | -61.1 | -82.5 |
| 15-17 | 99 | 18 | 10 | 14 | 7 | -50.0 | -30.0 | -61.1 | -92.9 |
| 18-20 | 162 | 64 | 33 | 11 | 24 | 118.2 | -27.3 | -62.5 | -85.2 |
| 21-24 | 191 | 114 | 40 | 39 | 35 | -10.3 | -12.5 | -69.3 | -81.7 |
| 25-64 | 1 365 | 736 | 488 | 383 | 392 | 2.3 | -19.7 | -46.7 | -71.3 |
| 65 | 498 | 203 | 137 | 135 | 155 | 14.8 | 13.1 | -23.6 | -68.9 |
| Total | 2 432 | 1 200 | 740 | 591 | 626 | 5.9 | -15.4 | -47.8 | -74.3 |
Table 15.3. Road fatalities by age group

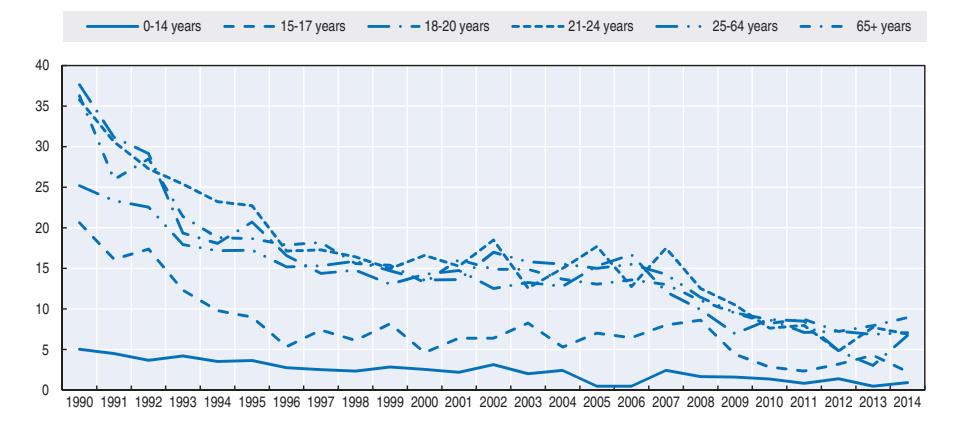
Road safety by road type
In 2014, 58% of road fatalities occurred on rural roads, 38% in urban areas and 4% on motorways. In 2014, the situation deteriorated on the whole road network except motorways, where fatalities were reduced by 10% when compared to 2013. Since 1990, road safety improvements have benefited all roads, with most progress seen on roads in urban areas.
Economic costs of traffic crashes
Traffic crashes represent a significant cost for society, estimated in 2013 at around EUR 1.88 billion. This estimation is calculated using both a willingness to pay and a "human capital" approach (Hollo, 2013), based on a methodology by McMahon and Dahdah (2008).
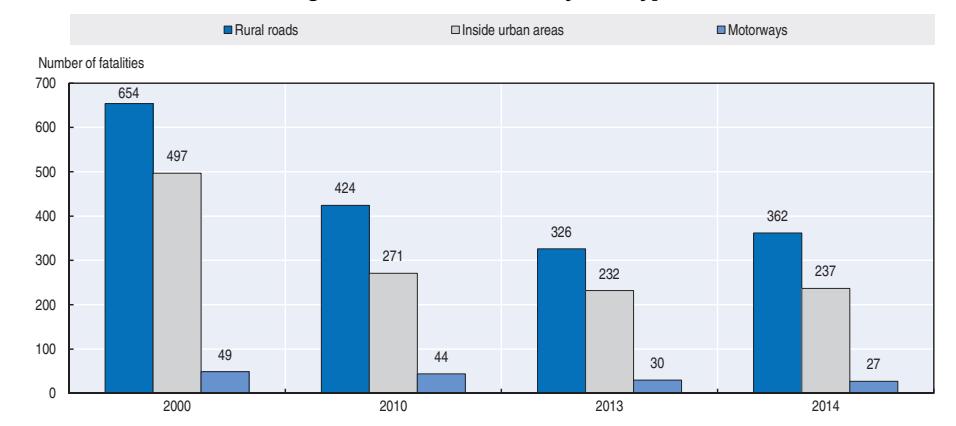
Figure 15.4. Road fatalities by road type
Recent trends in road user behaviour
Speed
According to on-site police investigations, speeding is a contributing factor in about 40% of fatal crashes. Automatic speed cameras are being introduced. The table below summarises the main speed limits in Hungary.
Table 15.5. Passenger car speed limits by road type, 2016
| General speed limit | |
|---|---|
| Urban roads | 50 km/h |
| Rural roads | 90 km/h |
| Motorways | 130 km/h 110 km/h on motor roads |
Drink driving
In Hungary, drivers are forbidden to drive under the influence of alcohol. The theoretical maximum blood alcohol content (BAC) is 0.0 g/l. In practice, drivers are convicted only if their BAC is above 0.2 g/l. However, the law was softened in July 2011 and the driving licence can be withdrawn on the spot only when the driver is "seriously" under the influence of alcohol.
In Hungary, the person responsible for a road crash is tested for blood alcohol concentration. Crash opponents who are not at fault are usually not tested. A crash is recorded as alcohol related when the person responsible for the crash is under the influence of alcohol.
In 2014, 10% of all injury crashes were caused by a driver under the influence of alcohol.
Drugs and driving
Driving under the influence of drugs is defined in the Act of Criminal Code and is listed among the potential crash contributing factors in accident forms. Unlike alcohol, there is no per se limit regarding drug consumption.
Saliva tests are not yet in use in Hungary, which makes drug driving enforcement very difficult. Drivers may be tested (from blood or urine samples) when they are suspected of impairment and when the alcohol test is negative. This happens very rarely and no random testing is being carried out, partly due to the costs of toxicology tests. Therefore, statistics on drug driving fatalities are not representative of the reality. In 2015, driving under the influence of drugs was reported as a contributing factor in five cases.
Distraction
Hungary recognises distracted driving in fatal and injury crashes. Mobile phone use or texting while driving are not identified specifically in the category of distracted behaviour.
The use of hand-held mobile phones while driving is not authorised. The penalty for using a hand-held mobile phone while driving is HUF 10 000 in urban areas, HUF 15 000 outside urban areas and HUF 20 000 on motorways.
According to a roadside survey undertaken in 2015, more than 5% of drivers are regularly using a hand-held mobile phone while driving.
Sleepiness and fatigue
Based on expert estimations, 10 to 15% of all road fatalities are due to sleepiness and fatigue.
Seat belts and helmets
Seat belt use has been compulsory in front seats since 1976. Outside urban areas they have been compulsory in rear seats since 1993 and in urban areas since 2001.
Dedicated child restraint use is compulsory for children of 150 cm or less.
In 2015, 83% of front-seat occupants and 39% of adult rear-seat occupants wore a seat belt, which is low in comparison to best performing countries. In addition, these rates have lowered since the last survey in 2013, when they were at 87% and 57% respectively.
| 2000
2013
2015
Front seat
General (driver + passengers)
86
81
Driver
87
82
Passenger (front seat)
49
87
83
Urban roads (driver)
35
85
75
Rural roads (driver)
48
83
80
Motorways (driver)
62
90
Rear seats
General
57
39
Children (use of child restraint)
90
79 | | |
|---------------------------------------------------------------------------------------------------------------------------------------------------------------------------------------------------------------------------------------------------------------------------------------------------------------------------------------------------------------|--|--|
| | | |
| | | |
| | | |
| | | |
| | | |
| | | |
| | | |
| | | |
| | | |
| | | |
| | | |
Table 15.6. Seat belt wearing rate (%) by car occupancy and road type
Helmet wearing has been compulsory since 1965 for motorcyclists, since 1997 for moped riders outside built-up areas, and since 1998 for moped riders inside built-up areas. The compliance rate by motorcyclists is nearly 100%.
There is no mandatory helmet use law for cyclists.
National road safety strategies and targets
Organisation of road safety
In Hungary, the Ministry of the Interior and the Ministry of National Development are responsible for road safety. Overall responsibility rests with the deputy state secretary of the Ministry of National Development.
The Hungarian Transport Strategy and the Road Safety Action Programme 2014-16
The Road Safety Action Programme 2014-16 is integrated into the Hungarian Transport Strategy. The primary aim of the programme for 2014-16 is to improve road user behaviour, increase the level of compliance with traffic rules, develop individual responsibility and establish partnership in road traffic. Detailed road safety action plans are developed for each year.
The National Transport Strategy builds on the previous Hungarian Transport Policy 2003-2015, which included targets to reduce the number of injury crashes and road fatalities by 30% from 2001 to 2010 and by 50% by 2015.
Road safety targets
The Hungary Transport Strategy includes a road safety target aiming at decreasing by 50% the number of road fatalities between 2010 and 2020. It also includes an interim target of fewer than 518 road deaths by 2016.
In addition to the national target, Hungary adopted the European Commission's target to reduce by 50% the number of road fatalities by 2020, in comparison with 2011 level.
Monitoring targets
KTI continuously monitors the road safety situation and each year publishes a detailed evaluation based on outcome indicators (number of deaths and injury crashes) and also on a set of safety performance indicators (such as the use of seat belts, child restraints, daylight running lights, etc.). Based on the evaluation of the previous programme, KTI recommends dedicating further efforts to increasing the use of seat belts and child seats, installing more speed cameras and better protecting vulnerable road users.
Considering the increase in 2015 to 647 fatalities, it seems unlikely that Hungary will reach the interim target set by the Hungarian Road Safety Action Programme for 2014-16 of 518 fatalities.
Recent safety measures (2013-16)
Road safety management
- As of 1 September 2014 the Highway Code was modified:
- ❖ Drivers are forbidden to overtake buses transporting children at stops where children get on and off.
- ❖ Application rules for child restraints in the front seats of passenger cars are more precise.
- ❖ Reduced speed limits around educational institutes only apply during school hours.
Speed management
● A new "intelligent" camera system (VÉDA) was installed in 2014. The system will enable better detection of traffic violations.
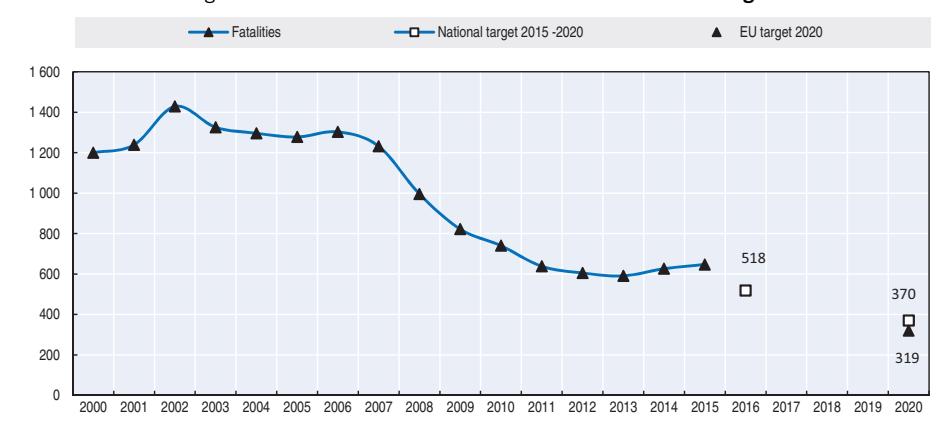
Figure 15.5. Trends in road fatalities towards national target
Infrastructure
● A new road category, "fast roads", has been agreed. The roads in this category have dual carriageways and a central barrier, but, unlike motorways, they allow for intersections, traffic control signals and roundabouts. The speed limit will be 110 km/h.
Recent and ongoing research
KTI is conducting a number of road safety research projects (SENSOR, ROSEE, PRO SAFE, Safety Tunes projects). More information can be found at: www.kti.hu.
References
McMahon, K. and S. Dahdah (2008), The true cost of road crashes: Valuing life and the cost of a serious injury, www.irap.net (accessed 8 April 2016).
Further reading
Holló, P. and D.S. Kiss (2015), "How to Deliver the Necessary Data about Serious Injuries to the European Union", Journal of Traffic and Transport Engineering, Volume 3, Number 4, pp. 247-253. April 2015 (Serial Number 7).
Török, Á. (2015), "Case Study on the Relationship between Road Safety and Economy in Hungary". American Journal of Vehicle Design, 3(1) pp. 1-5. (2015).
Török, Á. (2015), "Introduction to the Road Safety Situation in Hungary", PERIODICA Polytechnica-Transportation Engineering, 43(1) pp. 15-21. (2015).
Websites
- Institute for Transport Sciences (KTI): www.kti.hu.
- Road Safety in South East European Regions (ROSEE): www.rosee-project.eu.
- South East Neighbourhood Safe Routes (SENSOR): www.sensorproject.eu.
- Safety Tunes: www.safetytunes.eu/web/.
Chapter 16
Iceland
This chapter presents 2014 and 2015 road safety data for Iceland. It looks at trends in traffic and road safety from the years 1990 to 2015 and road user behaviour patterns. This includes data on speed, drink driving, drugs and driving, distracted driving, fatigue, and seat belt and helmet use. The chapter reviews Iceland's road safety strategy and national targets to 2022 along with interim targets to help monitor progress. It also highlights the most recently implemented safety measures and ongoing research.*
* All data stem from the Icelandic Road and Coastal Administration and IRTAD unless otherwise noted. For more information please contact: audur.th.arnadottir@vegmagerdin.is.
Iceland, with its low population of just over 330 000 inhabitants, has seen consistent improvement in its road safety record over recent years. In 2014 there were only 4 fatalities, a rate of 1.2 per 100 000 inhabitants. However, the number of foreign tourists has tripled since the year 2000, reaching a peak of 1.3 million in 2015. This has had an impact on road safety as a large number of visitors rent cars. In 2015, out of the 16 fatalities, 5 were overseas visitors to the country. Improving road safety for foreign tourists has become a priority in Iceland.
Road safety data collection
Definitions applied in Iceland
- Road fatality: Person who dies within 30 days as a result of a traffic crash.
- Serious injuries are defined by an old European definition: "Fractures, concussion, internal lesions, crushing, severe cuts and laceration, severe general shock requiring medical treatment and any other serious lesions entailing detention in hospital."
Iceland is working towards using the Maximum Abbreviated Injury Scale of three or more (MAIS3+) to define a serious injury. A central accident database including non-traffic accidents is being developed for the healthcare system in which a MAIS score for each accident will be found.
Data collection
Crash data is based on police reports. Reports are made by police at the scene and sent to the Icelandic Transport Authority. Information on the cause and type of crash is added to the files along with detailed information on location, vehicles and other factors.
All fatal crashes are recorded in the database. An in-depth study is undertaken for each fatal crash. By law, every injury crash must be reported to the police and therefore it will be included in the database. In practice, some injury crashes are not reported and others may be misreported.
From 1999, crash forms have been transferred electronically, which has led to a much better reporting rate. Comparing recent injury crash data with that from years before 2000 is not recommended.
The Icelandic Transport Safety Board studies all fatal crashes.
As the number of fatalities in Iceland is low, fatality data is not compared between single years, but between series of five consecutive years.
Most recent safety data
Road crashes in 2015
In 2015, 16 people were killed in road traffic, 12 more than in 2014. The five-year average for 2011-15 was 11.2 killed per year, while 16.6 were killed per year for the previous five-year period (2006-10), thus reflecting a reduction in the number of people killed on the road. However, the high number of road deaths in 2015 is an important concern.
Among the 16 people killed five were foreign tourists. The number of foreign tourists visiting Iceland has grown rapidly in recent years. In 2015, almost 1.3 million tourists came to Iceland via the international airport in Keflavik, about half a million more than just two years previously in 2013. More people visit and drive in Iceland during winter time when the roads are icy; however, most tourists do not have experience of driving in these conditions. In addition, many foreign tourists do not wear seat belts.
The five-year annual average for injury crashes (excluding fatal crashes) for 2011-15 was 816. With 969 per year for the previous five-year period (2006-10), the number of injury crashes also decreased for the five-year period.
Improving the safety of foreign tourists has become a priority in Iceland. Traffic signs will be improved, in particular at narrow (i.e. one-lane) bridges. Safety recommendations will be given at car rental desks.
Trends in traffic and road safety (1990-2015)
Traffic
Since 1990, the number of registered vehicles and vehicle kilometres has increased by more than 100%. Road traffic measured in vehicle-kilometres slightly decreased between 2010 and 2012 but is again increasing as the economy recovers from the financial crisis and due to the expansion of tourism in Iceland.
The current transport plan promotes the use of alternatives to cars, such as public transport, cycling and walking. In recent years, Iceland has improved the infrastructure for cyclists within the capital and has provided special lanes for buses.
Road safety
Crashes and casualties
The peak in road fatalities in Iceland was 37, in 1977. Since then fatalities have been declining while motorisation has significantly increased.
Between 1990 and 2015, the number of fatalities overall followed a decreasing trend, fluctuating as high as 32 in 2000 and as low as four in 2014.
Between 1990 and 2015, the number of injury crashes increased by 59%. The reason for this apparent sizeable increase is largely explained by better reporting. Until 1998/99, crash reports were sent by paper; since then reports have been sent electronically, leading to a much better reporting rate. Comparing injury data for the years prior to 2000 is not recommended.
Rates
In 2014, the mortality rate (expressed in terms of deaths per 100 000 inhabitants) was 1.2. The lowest rate among IRTAD countries. The mortality rate in 2014 was exceptionally low and in 2015 it was up again to 4.9.
Road safety by user group
In Iceland, most traffic casualties are passenger car occupants.
Road safety by age group
The table below shows a breakdown of fatalities by age group.
Table 16.1. Road safety and traffic data
| 2014 % change from | |||||||||
|---|---|---|---|---|---|---|---|---|---|
| 1990 | 2000 | 2010 | 2013 | 2014 | 2013 | 2010 | 2000 | 1990 | |
| Reported safety data | |||||||||
| Fatalities | 24 | 32 | 8 | 15 | 4 | Figures too small for meaningful comparisons. |
|||
| Injury crashes | 564 | 979 | 876 | 808 | 805 | -0.4 | -8.1 | -17.8 | * |
| Deaths per 100 000 inhabitants | 9.5 | 11.5 | 2.5 | 4.7 | 1.2 | ||||
| Deaths per 10 000 registered vehicles | 1.7 | 1.8 | 0.3 | 0.6 | 0.1 | Given the low number of road fatalities, | |||
| Deaths per billion vehicle kilometres | 14.9 | 13.8 | 2.5 | 4.7 | 1.2 | there is wide fluctuation between years. | |||
| Traffic data | |||||||||
| Registered vehicles1 (thousands) | 138 | 173 | 257 | 267 | 271 | 1.5 | 5.4 | 56.6 | 96.4 |
| Vehicle kilometres (millions) | 1 612 | 2 316 | 3 168 | 3 185 | 3 269 | 2.6 | 3.2 | 41.1 | 102.8 |
| Registered vehicles per 1 000 inhabitants | 544 | 620 | 809 | 830 | 832 | 0.3 | 2.8 | 34.2 | 53.0 |
* Due to a change in the registration process, comparing injury data for the years prior to 2000 is not recommended. 1 2 http://dx.doi.org/10.1787/888933385475
Figure 16.1. Road Safety, Traffic and GDP Trends index 1990 = 100
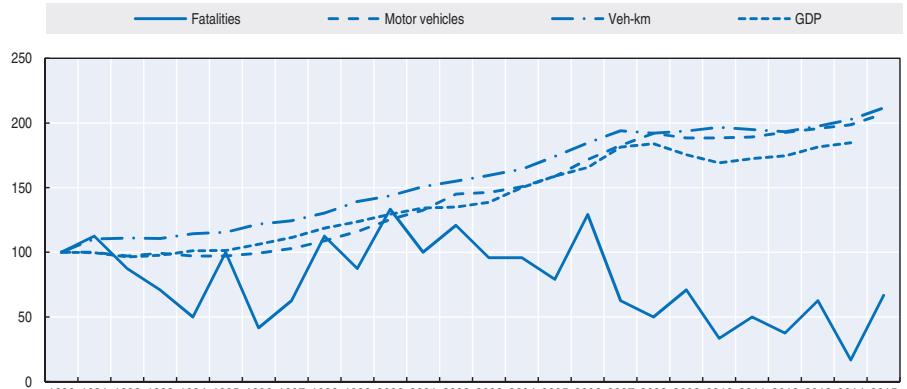
Source: World Bank for Gross Domestic Product (GDP ; constant prices). 1990 1991 1992 1993 1994 1995 1996 1997 1998 1999 2000 2001 2002 2003 2004 2005 2006 2007 2008 2009 2010 2011 2012 2013 2014 2015
Table 16.2. Road fatalities by road user group
| | | | | | | | 2015 % change from
2014
2010
2000
1990
Figures too small for meaningful
comparisons | | | | | |
|-------------------------|------|------|------|------|------|------|-------------------------------------------------------------------------------------------------------|--|--|--|--|--|
| | 1990 | 2000 | 2010 | 2013 | 2014 | 2015 | | | | | | |
| Cyclists | 0 | 0 | 0 | 0 | 0 | 1 | | | | | | |
| Moped users | 0 | 0 | 0 | 0 | 0 | | | | | | | |
| Motorcyclists | 3 | 1 | 1 | 1 | 0 | 1 | | | | | | |
| Passenger car occupants | 15 | 25 | 4 | 11 | 3 | 12 | | | | | | |
| Pedestrians | 6 | 1 | 2 | 1 | 0 | 1 | | | | | | |
| Others | 0 | 5 | 1 | 2 | 1 | 1 | | | | | | |
| Total | 24 | 32 | 8 | 15 | 4 | 16 | | | | | | |
Table 16.3. Road fatalities by age group
| 2015 % change from | ||||||||||
|---|---|---|---|---|---|---|---|---|---|---|
| Age | 1990 | 2000 | 2010 | 2013 | 2014 | 2015 | 2014 | 2010 | 2000 | 1990 |
| 0-5 | 1 | 0 | 0 | 1 | 0 | 2 | ||||
| 6-9 | 1 | 0 | 0 | 0 | 0 | |||||
| 10-14 | 1 | 0 | 0 | 1 | 0 | |||||
| 15-17 | 2 | 5 | 0 | 3 | 1 | |||||
| 18-20 | 4 | 4 | 2 | 0 | 1 | 4 | Figures too small for meaningful comparisons | |||
| 21-24 | 3 | 1 | 1 | 2 | 0 | 1 | ||||
| 25-64 | 9 | 16 | 3 | 6 | 2 | 4 | ||||
| 65 | 3 | 6 | 2 | 2 | 0 | 5 | ||||
| Total | 24 | 32 | 8 | 15 | 4 | 16 |
Road safety by road type
In 2014, no one was killed on roads inside urban areas and four were killed on roads outside urban areas. In 2015; these figures were respectively 3 and 13.
4 4 3 14 25 4 11 4 13 5 10 15 25 1990 2000 2010 2013 2014 2015 Number of fatalities Inside urban areas Outside urban areas
Figure 16.2. Road fatalities by road type
Economic costs of traffic crashes
A 2014 report (Sigthorsson and Hilmarsson, 2014) on the economic costs of traffic crashes in Iceland reviewed the history of traffic crash cost estimation and presented an overview of methodologies used in other countries.
In 2013, it was estimated that road crash costs amounted to EUR 254 million, or 2% of Iceland's GDP.
Table 16.4. Cost of road crashes, 2013
| Unit cost EUR | Total EUR | |
|---|---|---|
| Injury or fatal crashes | 252 667 | 207 692 274 |
| Property damage only crashes | 9 333 | 46 767 663 |
| Total | 254 459 937 | |
| Total as % of GDP | 2% |
Source: Sigthorsson and Hilmarsson (2014).
Recent trends in road user behaviour
Speed
Speed has been a major problem on Icelandic roads. However, from 2004 Iceland recorded a positive trend, with a decrease and then stabilisation in the mean speed. Iceland has increased enforcement (both traditional and automatic speed controls), but budgets have limited the ability to increase the number of automatic speed cameras more rapidly. The graph below shows the development of the average speed and the 85th percentile speed (V85, the speed at or below which 85% of vehicles travel) on main roads (rural roads with a speed limit of 90 km/h).
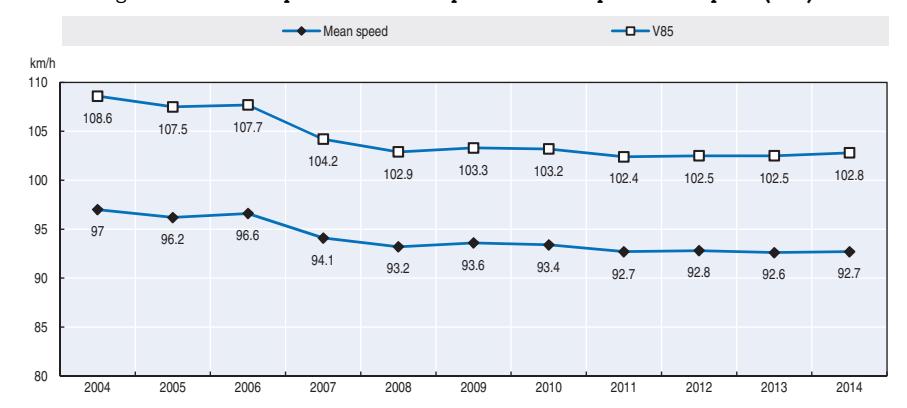
Figure 16.3. Development in mean speed and 85th percentile speed (V85)
The table below summarises the main speed limits in Iceland.
Table 16.5. Passenger car speed limits by road type, 2016
| General speed limit | Comments | |
|---|---|---|
| Urban roads | 50 km/h | |
| Rural roads | 90 km/h paved roads | 80 km/h gravel roads |
Drink driving
The maximum authorised blood alcohol content (BAC) is 0.5 g/l. During 2011-15, on average, 12.5% of those killed and 6% of those seriously injured were involved in road crashes where one of the drivers had a BAC above the limit or had taken drugs. Drink driving has declined in Iceland. In the five year period of 2011-15, there were three years when nobody died in an alcohol-related crash.
Drugs and driving
The Traffic Law of Iceland states that it is illegal to drive a vehicle while under the influence of illegal narcotic substances. The penalties are the suspension of the driving licence for 3 to 24 months for a first offence and 2 to 5 years for a repeated offence.
During the period 2011-15, 5% of fatal crashes and 2-3% of serious injury crashes involved a driver under the influence of drugs.
Distraction
According to the law, it is illegal to drive with a hand-held mobile phone. The use of hands-free devices is authorised.
Sleepiness and fatigue
About 3-4% of fatal and injury crashes involve a driver who was drowsy, almost falling asleep or even fell asleep while driving.
Seat belts and helmets
In Iceland, it is compulsory to wear seat belts in both front and rear seats if they are available.
Dedicated child restraint use is compulsory for children under 135 cm. A survey on child restraint usage is conducted every year at preschool establishments and the trend has been very positive. Since 1985 the child seat using rate of preschool children (3-6 years old) has gone up from 21% to 98%.
During the period 2011-15, on average, 43% of car occupant fatalities were not wearing a seat belt.
| % | ||
|---|---|---|
| 2011 | 2013 | |
| Front seat | ||
| General (driver + passengers) | 85 | 84 |
| Urban roads | 76 | 79 |
| Rural roads | 91 | 93 |
| Rear seats | ||
| General | 72 | 65 |
| Children 3 to 6 (use of child restraint) | 92 |
Table 16.6. Seat belt wearing rate by car occupancy and road type
Helmet wearing is mandatory for all powered two-wheelers, and is compulsory for cyclists up to 14 years of age.
National road safety strategies and targets
Organisation of road safety
Under the supervision of the Ministry of the Interior, three organisations manage road safety in Iceland. The Icelandic Road and Coastal Administration (Vegagerðin) handles the infrastructure and the actual road improvements; the Icelandic Transport Authority (Samgöngustofa) handles the human behaviour elements through campaigns, education, etc., and the National Commissioner of the Icelandic Police monitors speed and alcohol and drug abuse.
Road safety strategy for 2011-2020
In 2012, the Icelandic parliament agreed upon a new Road Safety Plan for the period 2011-22.
Road safety targets
The Plan has the following targets:
- In 2022, the number of traffic fatalities per 100 000 inhabitants should not exceed the rate of countries with outstanding traffic safety records.
- The number of killed and seriously injured should decrease on average by 5% a year until 2022.
The target-setting process for the first indicator is self-explanatory. The second target (average annual decrease of 5% of killed and seriously injured) was selected because it is believed to be achievable with current strategies and the available funding. This is equivalent to a 46% decrease over the 12-year period (2011-22). The baseline for the second target is the average of the years 2006-10, which is 201.
To assist in achieving this target, 11 sub-targets have been set to guide the strategy and monitor progress. These sub-targets include:
- 5% decrease of crashes involving young drivers (aged 17-20)
- elimination of fatalities due to lack of seat-belt wearing
- 5% decrease in injured foreigners.
Monitoring targets
Crash data are monitored monthly and this short-term analysis influences decisions on safety measures. Annual reviews focus in particular on the sub-targets.
| Type | Targets | Base year | Target year | Base year figure | Current results (2015 figure) |
|---|---|---|---|---|---|
| Fatalities per 100 000 inhabitants |
Not higher than the best performing countries |
Average 2006-10 | 2022 | 5.2 | 4.9 |
| Killed and seriously injured |
-5% per year (less than 109 by 2022) |
Average 2006-10 | 2022 | 201 | 194 |
Table 16.7. Trends in road fatalities towards national target
Based on a preliminary assessment of the 2011-22 Road Safety Plan, it is now proposed to make more use of performance indicators.
Recent safety measures (2013-26)
Road safety management
● In line with the directive of the European Commission on road safety management (2008/96/EC) there is much emphasis on Road Infrastructure Safety Management. Municipalities are encouraged to make their own road safety plans.
Road users
Speed management
● Automatic speed control started in 2007. In the Road Safety Plan, which is being revised, it is proposed to further deploy the system and to introduce average section speed control.
Education and awareness
- Various campaigns are being conducted on such subjects as not using a mobile phone when driving, speeding, driving under the influence of alcohol and/or drugs, fatigue, etc.
- Road safety education is proposed at all school levels.
- There is a dedicated information programme to inform foreign drivers of specificities of driving in Iceland, including sheep on the road, gravel roads, narrow bridges, etc.
Infrastructure
- Because the majority of crashes in rural areas are run-off-road crashes, there are important projects to improve roads and roadsides to make them more forgiving. Efforts include:
- ❖ elimination of black spots
- ❖ separation of driving directions
- ❖ increased use of rumble strips
- ❖ improved winter services (as many crashes occur on icy roads).
Recent and ongoing research
- The Icelandic Road and Coastal Administration (IRCA) published several before and after studies in 2015.
- IRCA has studied wintertime crashes involving foreign drivers on tourist routes. The results imply that increased winter service will have positive effects on the safety of foreign drivers.
- An ongoing research project is focusing on cycle crashes.
- IRCA is financing research projects regarding foreign tourists' mobility and safety. The purpose of one of the projects is to estimate the proportion of foreign tourists in traffic in order to get some exposure data. Another project focuses on identifying areas where it is most important to provide facilities for photo-stops.
References
Sigthorsson, H. and V. Hilmarsson (2014), Kostnadur umferdarslysa, A research project for the Icelandic Road and Coastal Administration, May 2014, www.vegagerdin.is/Vefur2.nsf/Files/Kostnadur\_ umferdarslysa/\$file/Kostna%C3%B0ur%20umfer%C3%B0arslysa.pdf (accessed 3 May 2016).
Websites
- Safe Travel: www.safetravel.is.
- Icelandic Transport Authority: www.samgongustofa.is.
- Iceland Road and Coastal Administration: www.vegagerdin.is.
- Icelandic Transportation Safety Board: www.rnsa.is.
Chapter 17
Ireland
This chapter presents 2014 road safety data for Ireland along with provisional data from 2015. It looks at trends in traffic and road safety from the years 1990 to 2015 and road user behaviour patterns. This includes data on speed, drink driving, drugs and driving, distracted driving, fatigue and seat belt usage. The chapter reviews Ireland's road safety strategy and national targets to 2020 and the progress achieved thus far. It also provides details of all recently implemented safety measures and current and ongoing research.*
* All data stem from the Irish Road Safety Authority and IRTAD unless otherwise noted. For more information please contact: sheffernan@rsa.ie
In 2014, there were 179 fatal collisions on Irish roads which resulted in 193 deaths, an increase of 3% in deaths compared to 2013. This is the second consecutive year with an increase in fatalities. However, between 2013 and 2014 the economic situation improved with increased employment, vehicle registrations, fuel consumption and volume of traffic which could in part explain this recent change. Provisional data from 2015 show a 14% reduction in fatalities, thus appearing to reverse this short negative trend. In 2014, the death rate per 100 000 inhabitants was 4.2 and the death rate per 10 000 registered vehicles was 0.8. Ireland's road safety strategy has as its target less than 25 fatalities per million inhabitants by 2020.
Road safety data collection
Definitions applied in Ireland
- Road fatality: A death resulting from a road crash within 30 days.
- Serious injury: An injury for which a person is detained in hospital as an inpatient, or, whether or not detained in hospital, having any fractures, concussion, internal injuries, crushing, severe cuts and lacerations, or severe general shock requiring medical treatment.
- Slight injury: An injury of a minor character, such as a sprain or bruise.
In 2012, the Road Safety Authority (RSA) commissioned a study examining the feasibility of adopting the Maximum Abbreviated Injury Scale of three or more (MAIS3+) definition of a serious injury and linking Irish hospital data to police data. The report concluded that it is feasible, and the RSA is working with the Health Intelligence Unit (HIU) of the Health Services Executive to develop an appropriate methodology. While work is ongoing on the longer term goal of data linkage, the RSA have conducted the first transformation of hospital data to MAIS3+ and provided these data to the European Commission (EC). Further work is required to improve the methodology which is taking place with partners in the HIU and the EC.
Data collection
In Ireland, official road crash data is generated by two agencies. Members of the Irish Police Force (An Garda Siochana) complete detailed road crash reports that are subsequently forwarded to the RSA for analysis and publication. Reporting of fatalities is comprehensive in Ireland, but serious injury crashes are likely to be underreported.
From 1 January 2014 reporting and collection of road crash data moved from a paper-based system to an electronic format. This change will improve recording in terms of the number of variables collected and the accuracy of the data. This changeover is almost complete.
Most recent safety data
Road crashes in 2015 – provisional data
Based on provisional data, as of 31 December 2015, there were 159 fatal collisions with 166 fatalities. This represents 27 fewer deaths (-14%) compared to the same period in 2014 with reductions in all road-user groups (Road Safety Authority, 2015a).
An analysis of longer term trends by road user group shows progress has been greater in reducing car driver and car passenger deaths, compared to vulnerable road users.
The reduction in fatalities seen in 2015 is welcome in light of the increases seen in the previous two years. Interventions and initiatives which took place in 2015 were the RSA International Conference on Child Safety in April 2015, transfer of the Road Safety Authority/An Garda Síochána's "Go Slow" Campaign to the high risk period of summer, a high profile launch of the July Fatality Review, increased media reporting on road safety in second half of 2015 in particular, and an extensive range of public awareness campaigns.
Road crashes in 2014
In 2014 there were 179 fatal collisions which resulted in 193 deaths on Irish roads, an increase of 3% in deaths compared to 2013 when 188 people were killed. This represents the same number of collisions, but 5 more deaths compared to 2013. The year 2014 was the second consecutive year with an increase in the number of road fatalities since 2005 (Road Safety Authority, 2014a).
Trends in traffic and road safety (1990-2015)
Traffic
After a number of years of declining figures for new vehicle registrations, fuel consumption, as well as rising unemployment figures, 2014 saw an overall improvement in the economy. New vehicle registrations increased by 14.5% between 2013 and 2014. Unemployment fell from 12.6% in September 2013 to 11.1% by September 2014. Fuel consumption increased by 6% in 2014. Overall traffic volume increased in 2014 by 2% compared to 2013.
Road safety
Crashes and casualties
The number of road fatalities peaked in 1972 with 640 deaths. Since crash data was first recorded road deaths reached their lowest level in 2012 with 162 fatalities and the second lowest level was seen in 2015 with 166 fatalities. Between 2000 and 2012, the number of road deaths declined by more than 60%. There were increases in 2013 (16%) and 2014 (3%) in the number of road fatalities but this appears to have been arrested in 2015. It will take another couple of years of data to be able to ascertain if this was a statistical fluctuation in the numbers.
The Road Safety Authority was established in 2006 with the remit to provide a co-ordinated approach to improving Ireland's road safety and thus saving lives. The decrease seen over this time would have been influenced by road safety initiatives adopted as part of a strategic approach to road safety. The Road Safety Authority is responsible for the co-ordination and oversight of the Government Road Safety Strategy.
The strategic approach to road safety was first adopted in 1998 with the introduction of the first Road Safety Strategy (1998–2002). The RSA are currently implementing the fourth Government Road Safety Strategy (2013–20). The main changes in policies and legislation in the past 10 years that have influenced road safety include the following.
Enforcement and legislative changes:
- Introduction of the penalty points system for speeding offences in November 2002.
- Expansion in August 2012 and August 2014 of the range of road safety-related offences covered by penalty points and administrative fines.
- Operation of mandatory alcohol testing checkpoints introduced in July 2006.
- Lowering the maximum authorised blood alcohol content (BAC) level from 0.8 g/l to 0.5 g/l (0.2 g/l for young drivers and professional drivers) in 2010.
- Operation of the safety camera network to produce more than 7 000 hours of enforcement per month beginning in November 2010.
- Targeted operations of traffic law enforcement with a particular emphasis on safety offences including speeding, impaired driving, restraint/helmet misuse, mobile phone use and defective vehicles.
Media and communication campaigns:
- Implementation of mass media campaigns to target the main causal factors for crashes, deaths and serious injuries for all road users, but in particular the high risk groups based on research evidence.
- Integrating social media messaging with mass media campaigns to better target specific messages to the younger age groups.
- Integrating mass media campaigns to complement policing plans of An Garda Síochána and other enforcement agencies.
Education initiatives:
- Implementation of educational interventions aimed at the high risk 17-24 year old age group (e.g. "He drives she dies" campaign) and community based interventions for older road users (Mobility Matters).
- Implementation of a suite of schools-based initiatives to teach children at primary and secondary schools about road safety through programmes such as "Be Safe" and "Streetwise".
- Introduction of a Nationwide Road Safety Education Service. A team of road safety educators who travel to schools, colleges, communities, and places of work, to deliver established and effective programmes to everyone. These programmes tackle all elements of road safety and the practicing of safe road behaviour in general.
- The RSA "Check it Fits" team help parents and guardians to correctly fit their child car seats. Trained experts deliver the service all over Ireland on a full-time basis which is fast, convenient and free of charge.
- Implementation of specific educational measures aimed at vulnerable road users, such as use of high visibility material for pedestrians, cyclists and motor cyclists; awareness of intoxicated pedestrians; use of personal protection equipment for cyclists and motorcyclists; awareness of blind spots on heavy good vehicles and care for younger and older people
Driver education:
- Introduction of novice plates for learners and newly qualified drivers in 2014 as part of Ireland's Graduated Driver Licensing programme.
- Regulation of professional driver training for novice drivers
- Introduction of compulsory lessons for learner car drivers known as Essential Driver Training (EDT) which is part of the Graduated Driver Licensing system (GDL). Car learners must complete 12 mandatory lessons before attempting their practical driving test.
- Introduction of compulsory lessons for new learner motorcyclists known as Initial Basic Training (IBT) which is part of the Graduated Driver Licensing system (GDL). New motorcyclists must complete IBT which is a modular based training programme covering theory and practical off and on-road riding, before being permitted to ride unaccompanied on a public road and taking their practical driving test.
- Introduction of compulsory periodic refresher training for professional bus and truck drivers (Drivers CPC).
Vehicle standards:
- Introduction of a national commercial vehicle testing system forcing greater compliance with the legal obligation to have commercial vehicles tested annually and improving quality and consistency of the test.
- Investment in commercial vehicle and driver enforcement, with a 400% increase in the roadworthiness inspections, with 8% of the fleet checked at the roadside in 2015; a doubling of driver's hours and tachograph enforcement inspections at the roadside and operator premises.
- Enhancement of commercial vehicle operator vehicle safety obligations through the introduction of explicit maintenance obligations for commercial vehicle operators and powers of inspection.
Rates
Since 2000, the risk has been more than halved for the rate indicators of deaths per 100 000 inhabitants and deaths per 10 000 registered vehicles. In 2014, the death rate per 100 000 inhabitants was 4.2 and the death rate per 10 000 registered vehicles was 0.8.
| 2014 % change from | |||||||||
|---|---|---|---|---|---|---|---|---|---|
| 1990 | 2000 | 2010 | 2013 | 2014 | 2013 | 2010 | 2000 | 1990 | |
| Reported safety data | |||||||||
| Fatalities | 478 | 415 | 212 | 188 | 193 | 3.2 | -8.5 | -53.3 | -59.4 |
| Injury crashes | 6 067 | 7 757 | 5 780 | 4 976 | 5 410 | 8.7 | -6.4 | -30.3 | -10.8 |
| Deaths per 100 000 inhabitants | 13.6 | 11.0 | 4.7 | 4.1 | 4.2 | 2.9 | -9.6 | -61.7 | -69.1 |
| Deaths per 10 000 registered vehicles | 4.5 | 2.5 | 0.9 | 0.8 | 0.8 | 1.8 | -12.1 | -68.7 | -83.0 |
| Deaths per billion vehicle kilometres | 19.2 | 13.6 | 5.0 | 4.5 | 4.5 | 1.0 | -9.1 | -66.6 | -76.3 |
| Traffic data | |||||||||
| Registered vehicles1 (thousands) | 1 054 | 1 684 | 2 416 | 2 483 | 2 515 | 1.3 | 4.1 | 49.4 | 138.6 |
| Vehicle kilometres (millions) | 24 896 | 30 483 | 42 166 | 41 757 | 42 447 | 1.7 | 0. | 39.2 | 70.5 |
| Registered vehicles per 1 000 inhabitants | 301 | 446 | 531 | 541 | 546 | 1.0 | 2.8 | 22.5 | 81.7 |
Table 17.1. Road safety and traffic data
1 2 http://dx.doi.org/10.1787/888933385482
1. Vehicle-kilometres: break in series in 2000 due to new methodology.
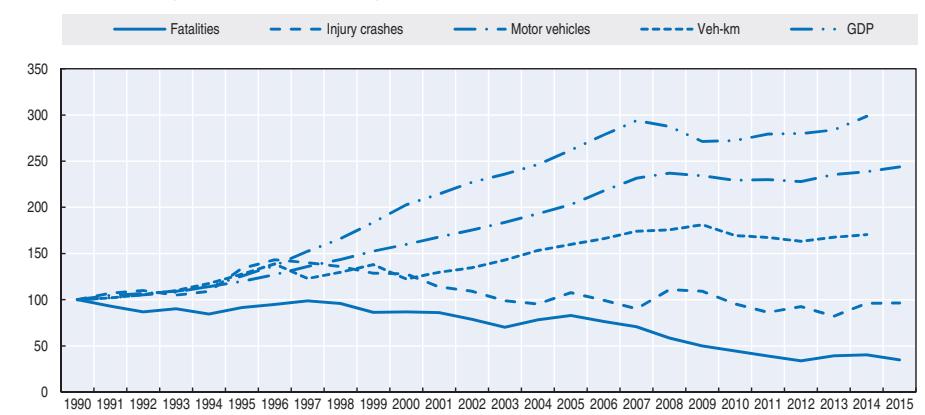
Figure 17.1. Road Safety, Traffic and GDP Trends index 1990 = 100
Source: World Bank for Gross Domestic Product (GDP; constant prices).
Road safety by user group
Fatalities for all user groups have declined since 2000, with the highest reduction for passenger car occupants (-59%) and pedestrians (-52%).
Between 2010 and 2014, improvements in road safety benefitted car occupants the most. In 2014, car occupants represented 56% of fatalities, while vulnerable road users (pedestrians, motorcyclists and cyclists) represented the remaining.
| | | | | | | 2014 % change from | | | | | |-------------------------|------|------|------|------|------|--------------------|-------|-------|-------|--| | | 1990 | 2000 | 2010 | 2013 | 2014 | 2013 | 2010 | 2000 | 1990 | | | Cyclists | 46 | 10 | 5 | 5 | 13 | 160.0 | 160.0 | 30.0 | -71.7 | | | Motorcyclists | 41 | 39 | 17 | 26 | 24 | -7.7 | 41.2 | -38.5 | -41.5 | | | Passenger car occupants | 206 | 260 | 130 | 107 | 108 | 0.9 | -16.9 | -58.5 | -47.6 | | | Pedestrians | 150 | 85 | 44 | 31 | 41 | 32.3 | -6.8 | -51.8 | -72.7 | | | Others | 35 | 21 | 16 | 19 | 11 | -42.1 | -31.3 | -47.6 | -68.6 | | | Total | 478 | 415 | 212 | 188 | 193 | 3.2 | -8.5 | -53.3 | -59.4 | |
Table 17.2. Road fatalities by road user group
Road safety by age group
There has been a reduction in fatalities for all age groups since 1990. Since 2010, improvements in road safety benefitted mostly the young people between 18 and 24, while the number of senior citizens killed in road traffic increased (+46%). There have been demographic changes over this period in these age groups, a reduction in the numbers aged 15-24 (-15%) and increases in those aged 65 and older (+14%), but also changes to the learner driver system (GDL) and changes to the points system.
Nevertheless, in 2014, young people between 18 and 20 were still the most at risk in traffic with a mortality rate of 8.1 per 100 000 inhabitants, which is about twice that of the general population (4.2 for 100 000 population).
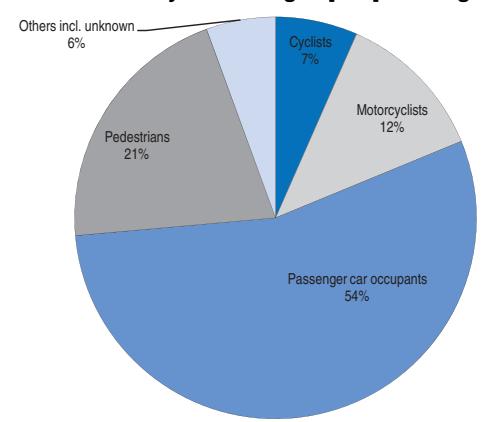
Figure 17.2. Road fatalities by road user group in percentage of total 2014
Table 17.3. Road fatalities by age group
| | | | 2010 | | 2014 | 2014 % change from | | | | |
|-------|------|------|------|------|------|-------------------------------------------------|-------|-------|-------|--|
| Age | 1990 | 2000 | | 2013 | | 2013 | 2010 | 2000 | 1990 | |
| 0-5 | 15 | 8 | 3 | 4 | 5 | | | -37.5 | -66.7 | |
| 6-9 | 12 | 6 | 2 | 1 | 4 | Figures too small for
meaningful comparisons | | -33.3 | -66.7 | |
| 10-14 | 19 | 8 | 1 | 1 | 4 | | | -50.0 | -78.9 | |
| 15-17 | 28 | 23 | 7 | 4 | 6 | | | -73.9 | -78.6 | |
| 18-20 | 56 | 63 | 21 | 13 | 12 | -7.7 | -42.9 | -81.0 | -78.6 | |
| 21-24 | 53 | 54 | 35 | 23 | 16 | -30.4 | -54.3 | -70.4 | -69.8 | |
| 25-64 | 195 | 195 | 109 | 96 | 103 | 7.3 | -5.5 | -47.2 | -47.2 | |
| 65 | 81 | 44 | 30 | 46 | 43 | -4.3 | 46.7 | | -45.7 | |
| Total | 478 | 415 | 212 | 188 | 193 | 2.7 | -9.0 | -53.5 | -59.6 | |
Road safety by road type
In 2015, a large majority of fatalities (74%) occurred on rural roads. Since 1990, urban roads have recorded the greatest reduction in fatalities (-78%). The small number of fatalities on motorways is mostly due to the relatively low crash rates on this type of carriageway.
Economic costs of traffic crashes
Traffic crashes represent a significant cost for society, estimated in 2013 at around EUR 850 million or 0.48% of Ireland's GDP.
The cost of collisions was provided in the Common Appraisal Framework for Transport (CAF-T) projects issued by the Department of Transport, Tourism, and Sport (2016). This latest update is based on research conducted by Goodbody consultants for the Department of Transport. Collision values are dependent on income, therefore the change in collision values over the evaluation time horizon should follow the growth in real GNP per person employed mechanism.
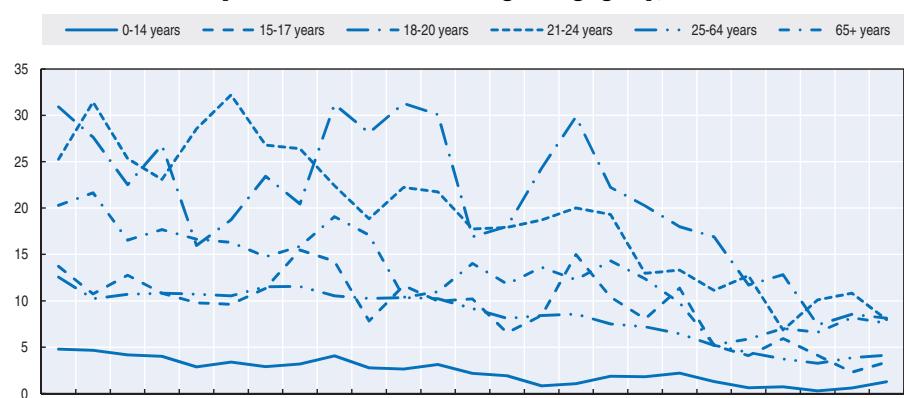
Figure 17.3. Road fatality rates by age group Deaths per 100 000 inhabitants in a given age group, 1990-2014
Figure 17.4. Road fatality rate by age and road user group Fatalities per 100 000 inhabitants, 2014
1990 1991 1992 1993 1994 1995 1996 1997 1998 1999 2000 2001 2002 2003 2004 2005 2006 2007 2008 2009 2010 2011 2012 2013 2014
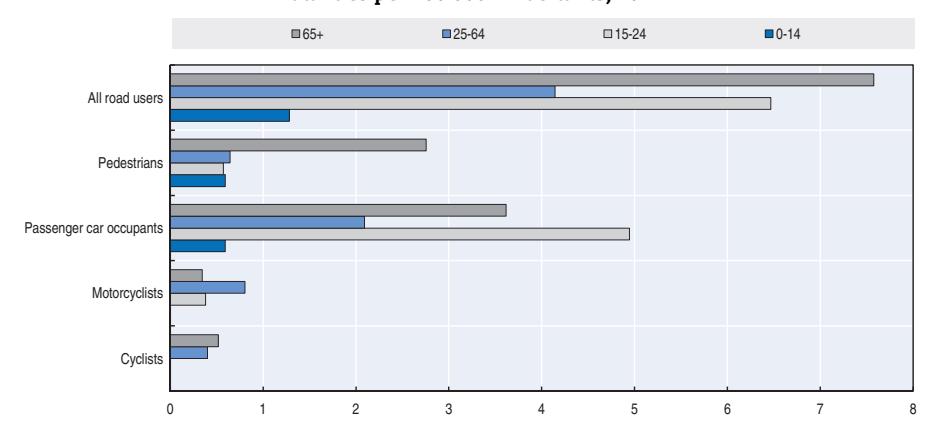
Recent trends in road user behaviour
Speed
Between 2002 and 2012, excessive speed was cited as a contributory factor in 15% of all road fatalities and it was a contributory factor in 11% of all serious injury crashes (RSA, 2015c).
A survey in 2015 measured the free speed of 12 458 cars, i.e. speed at which drivers choose to travel when unconstrained by road geometry, weather or traffic conditions. The results of the survey are summarised in the table below.
The table below summarises the main speed limits in Ireland.
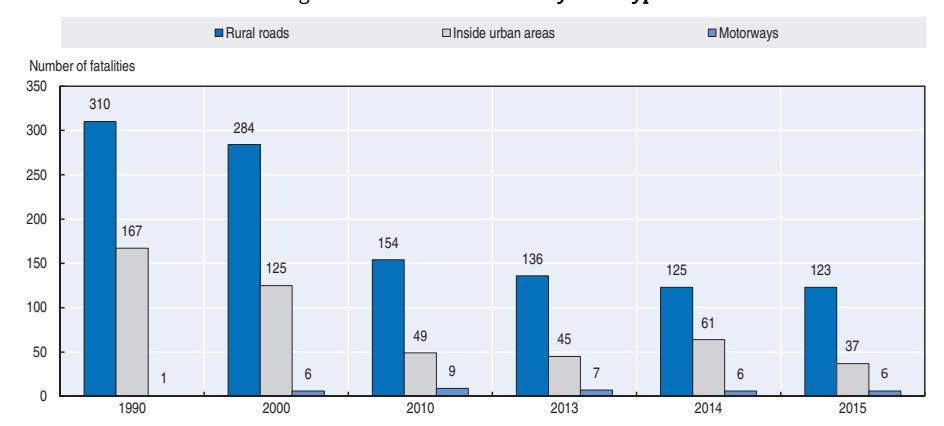
Figure 17.5. Road fatalities by road type
Table 17.4. Costs of road crashes, 2013
| Cost (EUR) | Unit cost | Total |
|---|---|---|
| Fatalities | EUR 2 310 000 | EUR 434 million |
| Serious | EUR 331 400 | EUR 168 million |
| Slight injuries | EUR 31 100 | EUR 194 million |
| Property damage costs | EUR 2 500 | EUR 54 million |
| Total (EUR) | EUR 850 million | |
| Total as % of GDP (at constant prices) | 0.48% |
Table 17.5. Passenger car speed limits by road type, 2016
| General speed limit | Percentage of drivers speeding (2015) |
Average free speed (2015) | |
|---|---|---|---|
| Urban roads | 50 km/h* | 60% | 59 km/h |
| Rural roads | 80 km/h or 100 km/h | 22% on rural roads 28% on 100 km/h dual carriageways 41% on 80 km/h regional roads |
95 km/h on dual carriageways (limit: 100 km/h) |
| Motorways | 120 km/h | 21% | 114 km/h |
* Can be 60km/h on arterial roads or 30km/h in built up areas.
In the most recent survey of driver attitudes and behaviours (RSA, 2015b) conducted among a sample of 1 073 drivers in Ireland, 11% of motorists admitted to being fined or punished in another way for breaking the speed limit in the past three years. It was also found that between 44% and 54% of motorists consider low-level speeding broadly acceptable. In this case low-level speeding was defined as exceeding speed limits by less than 10 km/h.
Drink driving
Since 2010, the maximum authorised blood alcohol content (BAC) level is 0.5 g/l (0.2 g/l for novice drivers and professional drivers). It was 0.8 g/l until 2009. In 2007, it was estimated that drink-driving (driver with a BAC > 0.2 g/l) was a factor in 15.5% of fatal crashes. This research is currently being updated to include a review of forensic investigation files for fatal road crashes from 2008 to 2012. Results of the Pre-crash Behaviour Study are expected to be published in 2016.
In the most recent survey of driver attitudes and behaviours (RSA, 2015b) conducted among a sample of 1 073 drivers, 8% of drivers said they had driven after having at least one drink during the past 12 months. Of these, 44% said they had at least two or more drinks on that occasion.
Drugs and driving
Following several decades of successful efforts to understand and reduce the magnitude of drink driving, driving while impaired by other psychoactive substances has emerged as its own road safety issue. A wide variety of substances, from illegal drugs to some over-the-counter preparations, can adversely affect the cognitive and behavioural skills required to operate a vehicle safely.
It has been estimated that 1.5% of drivers and motorcyclists involved in fatal crashes in the period 2005-07 had taken illicit drugs, based on the information from a national study. Illicit drug use was prevalent among male and young (17-34) drivers in Ireland. A study from the coroner's district in County Kildare during 1998-2009 showed that of 92 driver deaths, 50% tested positive for alcohol and/or drugs, and 9.8% had a positive toxicology for a drug. This rate of 1 in 10 drivers under the influence of drugs undoubtedly points to the need for intoxicant impairment testing.
In a survey of driver attitudes and behaviours conducted in 2014 among a sample of 1 066 drivers in Ireland, 2% of respondents said they had travelled in a car where they knew the driver had taken illicit drugs prior to driving.
An Garda Síochána now have additional powers to test drivers suspected of driving under the influence of drugs using Roadside Impairment Testing. There are five impairment tests a driver must undergo; a Pupil Dilation Test, Modified Romberg Balance Test, Walk and Turn Test, One Leg Stand and a Finger to Nose Test.
Seat belts and helmets
Seat belt use has been compulsory in front seats since February 1979 and in rear seats since January 1993. Children must be protected by a child restraint appropriate for their size and weight.
A 2015 observational survey of seat belt wearing rates on Irish roads showed that the overall seat belt wearing rate for adults (drivers, front and rear passengers) was 92% (same level as 2014). The wearing rate for drivers was 92%, 94% for all front seat passengers, and 81% for all rear seat adult passengers (RSA, 2015c).
A review of the 2015 fatal crashes found that 17% of road fatalities were not wearing a seat belt. This suggests that 29 fatalities may have been prevented had a seat belt been worn. In a significant proportion of collisions, it was not possible for the Garda at the scene to record whether or not a seat belt had been worn.
In the most recent survey of driver attitudes and behaviours (RSA, 2015b) conducted among a sample of 1 073 drivers, respondents were asked how often they wore a seat belt as a driver, front passenger and rear passenger. As drivers, 98% said they always wore them; as front seat passengers, 97% said they always wore one; but as rear seat passengers,
Table 17.6. Seat belt wearing rate by car occupancy and road type
| % | ||||
|---|---|---|---|---|
| 1991 | 2002 | 2014 | 2015 | |
| Adult seat belt use | ||||
| Front seat | 53 | 72 | 92 | 94 |
| Rear seat – all roads | 88 | 81 | ||
| Children (children restraint use) | ||||
| Front seat | ||||
| All children | 93 | 96 | ||
| Primary school | 97 | 98 | ||
| Secondary school | 91 | 95 | ||
| Rear seat | ||||
| All children | 91 | 91 | ||
| Primary school | 93 | 95 | ||
| Secondary school | 88 | 85 |
only 80% said that they always wear one. Only 77% of drivers said they always insist that seat belts are worn by those sitting in the rear of their car.
All riders of powered two-wheelers are required to wear helmets. There is no mandatory helmet use law for cyclists.
A roadside observation survey of motorcyclists (n = 3 973) in 2015 found that 97% of motorcyclists were wearing helmets (RSA, 2015d). This is a worrying reduction in the number of motorcyclists observed not wearing helmets. Of all pedal cyclists observed (n = 17 534) 52% wore a helmet. Further analysis was conducted based on the type of pedal cycle being used and found that 41% of pedal cyclists (n = 14 733) using their own bikes wore a helmet while 17% of those using the public bike scheme (n = 2 801) were wearing helmets.
National road safety strategies and targets
Organisation of road safety
The RSA is a state agency under the aegis of the Department of Transport, Tourism and Sport tasked with improving safety on Irish roads in order to reduce road death and injury resulting from road crashes.
The RSA co-operates and co-ordinates with stakeholders including:
- the Department of Transport, Tourism and Sport
- An Garda Síochána
- the National Roads Authority
- Medical Bureau of Road Safety
- the Department of Justice and Equality; Education and Skills; Environment, Community and Local Government; Health; Children and Youth Affairs, etc.
Road safety strategy for 2013-20
The Road Safety Authority is currently operating under the framework of the Government Road Safety Strategy 2013-20. The strategy sets out comprehensive targets and identifies 144 actions to be completed within its lifetime.
Road safety targets
The main targets are:
- a reduction of road crash fatalities on Irish roads to 25 per million population or less by 2020
- a provisional target for the reduction of serious injuries by 30% from 472 in 2011 to 330 or fewer by 2020, or 61 per million inhabitants.
Monitoring targets
In order to meet the target of 25 per million inhabitants, or about 124 deaths by 2020, a 25% decline in fatalities between 2015 and 2020 is required, equivalent to an average annual 5.5% reduction.
The broad monitoring arrangements that were instrumental in the success of the previous strategy will be maintained. Annual reviews of the strategy involving the lead departments and agencies are ongoing. Progress in implementing the strategy is reported in the context of the Road Safety Strategy Report to the Minister for Transport, Tourism and Sport. This report is informed by consultation with the major stakeholders. A mid-term evaluation of the strategy is being implemented in the latter half of 2016, and this will provide an opportunity to recalibrate targets and to implement adjustments to the education, engineering and enforcement measures as required.
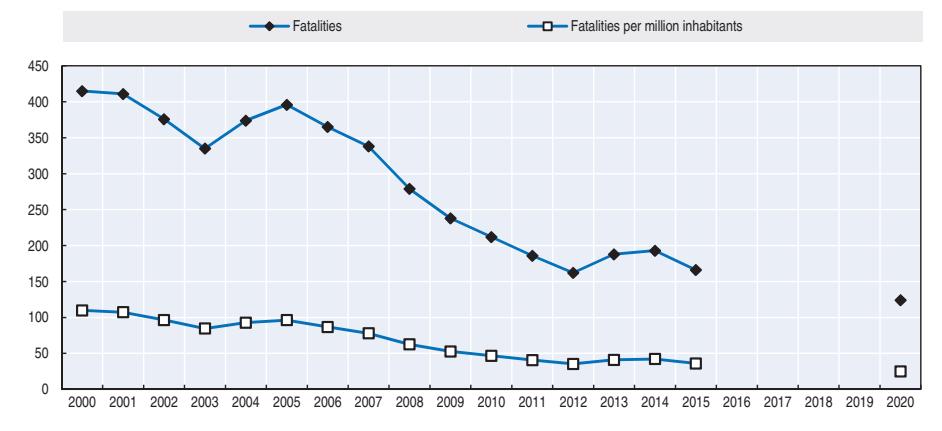
Figure 17.6. Trends in road fatalities towards national target
Recent safety measures (2013-16)
Road safety management
Penalty point system
● From 1 August 2014, penalty points for speeding, holding a mobile phone while driving and not wearing a seat belt or not using child restraints increased from two points to three. For those who do not pay the fixed charge and are subsequently convicted in court, the points will increase from four to five.
● A new Fixed Charge Notice (FCN) offence for motorists who drive with defective or worn tyres on their vehicle was introduced in April 2016. Although driving a vehicle with defective or worn tyres is already an offence, there will now be a fixed charge (or fine) of EUR 80, with two penalty points endorsed, or four penalty points following conviction in court.
Novice drivers
- Under the terms of the 2014 Act, the new category of novice driver came into effect from 1 August 2014. Those drivers who receive their first full licence will be considered as novice drivers for their first two years. Novices will be required to display an N-plate during that time. Under the terms of the Act, novices will face disqualification from driving for six months if they reach seven penalty points, as opposed to 12 for those with a full licence.
- Eliminating odometer fraud is important for consumer protection and road safety and a verification process has been introduced at NCT to support the accuracy of the data.
Cyclists
● From July 2015 new fixed charge notices came into effect to promote safe cycling practices. The charge is in place for breaking a red light, failure to have a front lamp lit during lighting-up hours and cycling without reasonable consideration.
Towing of trailers
● Changes to driver licence legislation now require all drivers to be qualified in the correct category of driving licence before they are permitted to tow trailers of particular weight classes.
Road users
Speed management
- The Department of Transport Tourism & Sport is actively encouraging local authorities to introduce 30km/h zones in residential areas and has engaged in a formal process with Local Authorities to encourage the reduction of the speed limit to this threshold in residential areas.
- Work on setting and managing speed limits has been conducted and a revised set of guidelines were issued in 2015. These guidelines include the introduction and use of new rural speed limit signs and a comprehensive review and update of all speed limits in administrative areas.
- A system called MapRoad, where data on speed limit signage is being collected in the field and centrally stored in a Roads Management System, is being compiled and the system will progress to provide quantitative and qualitative analysis of speed limit detail and allow roads authorities to greater scrutinise the appropriateness and validity of speed limits on Irish roads.
Education and awareness
The RSA has developed a number of new TV campaigns to target some of the main killer behaviours. Each campaign has been based on the latest research & evidence available on the relevant topic.
- Tyre safety as a result of the recent research which found that in 8% of fatal collisions the condition of tyres were a contributory factor, a television advert was launched in April 2016 focusing on the potential outcome of driving on poorly maintained tyres.
- Mobile Phone Distraction based on the premise that it only takes a split second looking at your phone to cause a serious crash with devastating consequences. The RSA was awarded Gold at the World Advertising Awards the 'Epicas' in November for this advert called "Anatomy of a split second" in the "Public Interest – Health and Safety" category.
- Vulnerable road users: There was a suite of television, radio and social media campaigns aimed at vulnerable road users such as cyclists, motorcyclists, and pedestrians aired throughout 2015 and into 2016. This was prompted by the increases seen in 2013 and 2014 in vulnerable road user fatalities.
- Driver Fatigue: An information based campaign, encouraging drivers to "Stop, Sip, Sleep" and obey the signs of fatigue when driving.
- Driving for work: The RSA hosted an ETSC PIN talk on 2nd July 2015 about driving for work. There were four driving-for-work seminars given in the latter half of 2015. Please visit the webpage for driving for work seminars.
- RSA International Conference: This takes place each year in April. The 2016 conference, entitled "iSafer", is being held in conjunction with the ETSC and is a consideration of ISA technology.
All RSA media campaigns are available to view on the RSA campaign webpage.
Infrastructure
- Implementation of a centralised information repository in relation to commercial vehicles, operators and drivers enabling more effective and efficient enforcement targeted at high risk non-compliant operators and supporting compliance through minimising disruption.
- Enhancement of technology for commercial vehicle inspections through Automatic Number Plate Recognition (ANPR) and look up apps for inspection service linked back to National Vehicle Driver File and enforcement and testing compliance history to enhance more effective and targeted enforcement.
- Development of dedicated enforcement sites for commercial vehicles.
Vehicles
Emergency pack
● The RSA has reported the results of the public consultation on the proposal that all vehicles be fitted with an emergency pack (first aid kit, torch, high-visibility vest and warning triangle) to the Department of Transport, Tourism, and Sport.
National Car Test (NCT)
● The NCT is a compulsory vehicle inspection programme in Ireland. The primary aim of this programme is to improve road safety and enhance environmental protection by reducing harmful vehicle emissions. In December 2014, the NCT came within the Fixed Charge System. Since then a huge improvement in compliance has been realised.
Vehicle Standards
- The RSA has, in recent years, developed numerous recommendations and legislative amendments relating to the vehicle standards that are being applied in Ireland. Recent changes in regulations include:
- ❖ Extension of the scope of compulsory roadworthiness testing to include motor caravans.
- ❖ Mandating the fitment of additional mirrors on heavy goods vehicles to improve the diver's view of the blind spots surrounding their vehicles to provide additional protection to vulnerable road users.
- ❖ The implementation of a suite of revised standards for agricultural vehicles to ensure the regulatory regime reflects the developments in agricultural vehicle technology and facilitates the compliance with recognised standards in of key safety critical areas, i.e. braking, suspension systems, tyres and lighting as well as the weights for which the vehicles are designed.
- ❖ Mandating the fitment of spray suppression devices to HGV's in advance of the mandatory type approval date.
Recent and ongoing research
- A survey of over 1 000 drivers in Ireland in 2015 (RSA, 2015b) asked motorists if they had experienced problems with their tyres in the past five years. Of all drivers, 53% had experienced problems and 33% were experienced "while driving". Approximately 4% of all drivers experienced a blowout while driving.
- The RSA has completed a comprehensive literature review of the research into ISA technology and this was presented at the International Conference in April 2016.
- A study has been completed on fatal collisions in Ireland between 2008 and 2012. A series of reports will be released in 2016 highlighting results from this research. The first report looked at vehicle factors in these road collisions and indicated that of all vehicle factors deemed a contributory factor in fatal collisions, tyres were the single largest factor. In 8% of the fatal collisions investigated, the condition of the tyres was a factor in the collision. This equated to 71 deaths. This report can be found on the RSA website.
- The Cyclists Rules of the Road study was an observational study of cyclist behaviour at traffic lights, in particular red light infringements, and was conducted for the first time in 2015. It will be repeated in 2016.
- The RSA is beginning a collaboration with Trinity College Dublin and The Irish Longitudinal Study on Ageing to further enhance understanding of the challenges and limitations older road users face as pedestrians, drivers, and cyclists. The results of this research will be used to support RSA policy in terms of education and communications campaigns aimed at the older road user.
- The RSA will conduct a nationally representative study into pedestrian road crossing behaviour. This study will look at adult and child crossing behaviour but will also be used to support the research into older pedestrians.
- In December 2015, the RSA contracted a consultant to undertake two reviews concerning i) risk behaviours and increasing the road safety of professional drivers not subject to the EU rules on tachograph and driving time and resting periods and ii) alternative sanction options to deal with operators and drivers who flout driving time and roadworthiness rules in addition to those already in existence.
The RSA has completed a review of the standards of the services and repair industry in Ireland, as a result of which we will be making recommendation for measures to be put in place to enhance standards in the industry in the coming years.
References
- Goodbody Economic Consultants (2004), Values of Time, Accident Costs and Operating Costs, Dublin, Ireland.
- Road Safety Authority (2014a), Provisional Review of Fatalities 2014. Retrieved from www.rsa.ie/ Documents/Road%20Safety/Crash%20Stats/Provisional%20Review%20of%20Road%20Crash%20Fatalities %2031%20Dec%202014.pdf.
- Road Safety Authority (2014), Cyclist injuries: A review of 2012 casualties. Ballina, Ireland, Retrieved from http://rsa.ie/Documents/Road%20Safety/Crash%20Stats/Review\_of\_Cyclist\_Injuries\_2012.pdf (accessed 8 April 2016).
- Road Safety Authority (2015a), "Provisional Review of Fatalities 2015". Retrieved from www.rsa.ie/ Documents/Road%20Safety/Crash%20Stats/Provisional%20Review%20of%20Fatalities%202015.pdf (accessed 17 May 2016).
- Road Safety Authority (2015b), Driver Attitudes and Behaviour Survey 2015. Unpublished data.
- Road Safety Authority (2015c), Seat Belt and Mobile Phone Usage Observation Survey 2015. Unpublished data.
- Road Safety Authority (2015d), High Visibility and Helmet Wearing Observation Survey 2015. Unpublished data.
Websites
- Irish Road Safety Authority: www.rsa.ie.
- 2013-2020 Road Safety Strategy, www.rsa.ie/Documents/About%20Us/RSA\_STRATEGY\_2013-2020%20.pdf (accessed 7 April 2016).
- Penalty points: www.penaltypoints.ie.
- Rules of the Road online: www.rulesoftheroad.ie.
Chapter 18
Israel
This chapter presents detailed 2014 and 2015 road safety data for Israel. It looks at trends in traffic and road safety from the years 1990 to 2014 and road user behaviour patterns. This includes data on speed, drink driving, drugs and driving, distracted driving, fatigue, and seat belt and helmet use. The chapter reviews Israel's road safety strategy and national targets to 2020. It also looks at the most recently implemented safety measures and current research.*
* The statistical data for Israel are supplied by the relevant Israeli authorities. The use of such data by the ITF/OECD is without prejudice to the status of the Golan Heights, East Jerusalem and Israeli settlements in the West Bank under the terms of international law. All data stem from the National Road Safety Authority and IRTAD unless otherwise noted. For more information please contact: Ms. Rachel Goldwag, mrachelg@rsa.org.il.
Israel has continued its overall positive trend despite an annual increase in registered vehicles and kilometres travelled, reaching by the end of 2014, a mortality rate of 3.4 fatalities per 100 000 inhabitants and 5.3 fatalities per billion vehicle-kilometres. However, 2015 saw 322 fatalities, a 15% increase over 2014. The older population were particularly affected by this increase with 97 deaths compared to 65 in 2014. Israel's Road Safety Agency is focusing its policies on increasing safety for both pedestrians and the senior population, in particular at pedestrian crossings.
Road safety data collection
Definitions applied in Israel
- Road fatality: Person killed immediately or dying within 30 days as a result of a road crash.
- Seriously injured person: A person injured in a road crash and hospitalised for a period of 24 hours or more, not for observation only. The words "not for observation only" were added by the Israel Police in December 1995 in order to obtain a clear and uniform definition. Before the second half of 1970, "seriously injured" applied only to those hospitalised for at least six days.
Data collection
Police collect crash data at the scene of the crash and subsequently send them to the Central Bureau of Statistics. The Road Safety Authority (RSA) funds both the Traffic Police and the Transportation Unit at the Central Bureau of Statistics in order to manage and maintain the data system.
Police data are regularly linked with other data sources, such as hospital databases (for fatalities up to 30 days and injuries), the Trauma Registry, the Ministry of Transport (driver and vehicle registries) and Ministry of Interior (population registry). Crash data covers the entire population and the entire geographical area.
By linking hospital and police data it was seen that roughly 1 500 injured persons who were recorded by the police as slightly injured are recorded in hospital data as severely injured. In addition, roughly 4 000 crash survivors arrive at hospitals while they were not reported in police data. This mostly concerns single unit accidents, cyclists (including e-bikers) and motorcyclists. In addition to police data, Israel currently uses the Injury Severity Score (ISS) system to assess the severity of an injury. Police data is used as a basis for Israeli statistical publications. In 2014, Israel collected data using the Maximum Abbreviated Injury Scale with scores of three or higher (MAIS3+) for the years 2008-14, and a decision must be made whether to use these data in place of the current police data.
It is assumed that all fatal crashes are reported to the police.
Most recent safety data
Road crashes in 2015 – final data
There were 322 fatalities in 2015, representing a 15% increase when compared to 2014.
There were fluctuations in fatalities by age group, with decreased fatalities for the age groups 0-4 and 20-24, while a significant increase was observed in the age group of 65+, with 65 fatalities in 2014 compared to 97 fatalities in 2015.
Road crashes in 2014
While the number of fatalities in road crashes increased slightly, the number of injuries decreased by almost 10%. In addition, the number of deaths per 100 000 inhabitants, per 10 000 registered vehicles and per billion vehicle-kilometres decreased by 1.2%, 3.2% and 1.6% respectively. There were fluctuations in fatalities by age group, with decreased fatalities for the age groups 10-14, 18-20 and 21-24.
The Road Safety Authority has begun to focus efforts on reducing the number of pedestrian casualties after a 28% increase in pedestrian deaths.
Trends in traffic and road safety (1990-2014)
Traffic
Between 1990 and 2014, the number of motorised vehicles and the distance travelled almost tripled with the increase between 2013 and 2014 alone being 4% and 2% respectively.
Road safety
Crashes and casualties
The number of road fatalities peaked in 1974, with 704 road deaths. Since then, the number of fatalities has decreased by 60%. Between 1990 and 2014, it decreased by 33%.
Between 2013 and 2014 the fatalities slightly increased by 0.7%, but the overall trend is decreasing.
Rates
Efforts at improving safety have yielded significant annual reductions in fatality rates. By the end of 2014, Israel had a mortality rate of 3.4 fatalities per 100 000 inhabitants and 5.3 fatalities per billion vehicle-kilometres.
Road safety by user group
Since 2000, the situation has improved for all road users, with the least progress for motorcyclists. The number of motorcycles increased by 53% between 2005 and 2014, so stability in the number of fatalities across time is a positive indication.
In recent years about one-third of all road user fatalities in Israel were pedestrians. However, in 2014, the number of pedestrians killed on the roads increased significantly from 91 in 2013 to 116 in 2014, and the pedestrian fatality share increased to 42%. In 2015 the rate of pedestrian fatalities returned to 30% of total fatalities. In recent years, the authorities have looked at infrastructure solutions to improve safety at pedestrian crossings where there are no traffic lights, launching education programmes in the school system on safe road crossing and promoting public awareness of issues such as the illusion of security at pedestrian crossings, etc.
Table 18.1. Road safety and traffic data
| 2015 % change from | ||||||||||
|---|---|---|---|---|---|---|---|---|---|---|
| 1990 | 2000 | 2010 | 2013 | 2014 | 2015 | 2014 | 2010 | 2000 | 1990 | |
| Reported safety data | ||||||||||
| Fatalities | 418 | 452 | 352 | 277 | 279 | 322 | 15.4 | -8.5 | -28.8 | -23.0 |
| Injury crashes | 17 496 | 19 925 | 14 724 | 13 048 | 11 772 | 12 122 | 3.0 | -17.7 | -39.2 | -30.7 |
| Injured persons hospitalised | 3 965 | 2 896 | 1 683 | 1 624 | 1 562 | 1 796 | 15.0 | 6.7 | -38.0 | -54.7 |
| Deaths per 100 000 inhabitants | 8.7 | 7.1 | 4.6 | 3.4 | 3.4 | 3.8 | 11.9 | -17.7 | -46.5 | -56.2 |
| Deaths per 10 000 registered vehicles | 4.1 | 2.4 | 1.4 | 1.0 | 0.9 | |||||
| Deaths per billion vehicle kilometres | 22.4 | 12.4 | 7.1 | 5.4 | 5.3 | |||||
| Traffic data | ||||||||||
| Registered vehicles1 (thousands) | 1 015 | 1 832 | 2 566 | 2 851 | 2 966 | |||||
| Vehicle kilometres (millions) | 18 668 | 36 482 | 49 870 | 51 207 | 52 400 | |||||
| Registered vehicles per 1 000 inhabitants | 211 | 288 | 337 | 354 | 361 |
1. Vehicles excluding mopeds.
1 2 http://dx.doi.org/10.1787/888933385494
Figure 18.1. Road safety, traffic and GDP trends index 1990 = 100
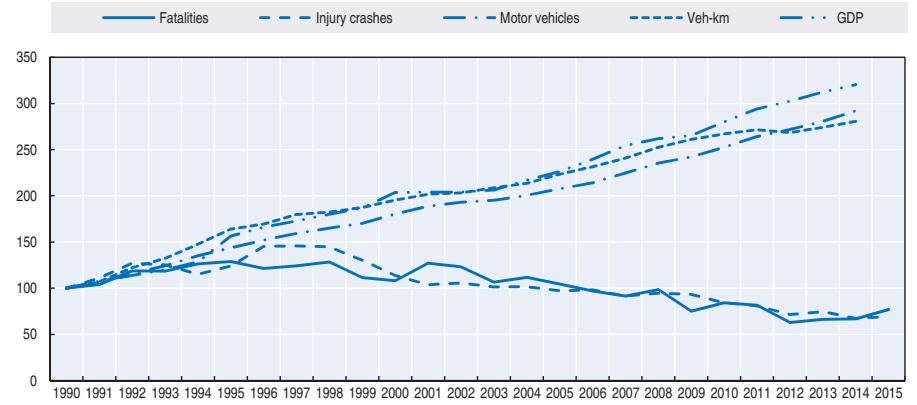
Source: World Bank for Gross Domestic Product (GDP; constant prices).
Table 18.2. Road fatalities by road user group
| 2015 % change from | |||||||||
|---|---|---|---|---|---|---|---|---|---|
| 2000 | 2010 | 2012 | 2013 | 2014 | 2015 | 2014 | 2010 | 2000 | |
| Cyclists | 20 | 18 | 11 | 13 | 10 | 14 | 40.0 | -22.2 | -30.0 |
| Moped users | 7 | 3 | 12 | 2 | 4 | 4 | 0 | 33.3 | -42.9 |
| Motorcyclists | 38 | 40 | 24 | 37 | 32 | 42 | 31.3 | 5.0 | 10.5 |
| Passenger car occupants | 219 | 172 | 97 | 103 | 86 | 106 | 23.3 | -38.4 | -51.6 |
| Pedestrians | 169 | 119 | 89 | 91 | 116 | 108 | -6.9 | -9.2 | -36.1 |
| Others | 31 | 31 | 48 | 54.8 | |||||
| Total | 452 | 352 | 261 | 277 | 279 | 322 | 15.4 | -8.5 | -28.8 |
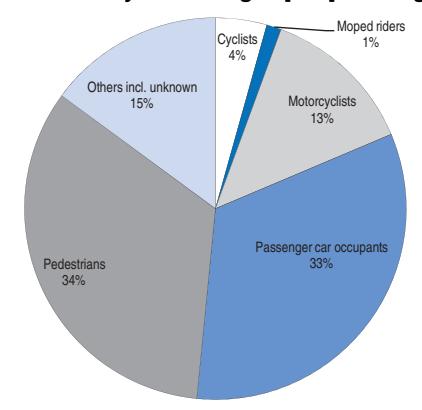
Figure 18.2. Road fatalities by road user group in percentage of total 2015
Road safety by age group
Since 2000, road safety improvements have benefited almost all age groups, with the largest decrease for the 15-17 year olds (78%). After an increase in the number of killed children aged 0-5 in 2004, the level is back to that of 2000.
The percentage of seniors killed in road crashes in Israel in 2015 (30%) is three times more than their percentage of the population (10%). In 2015 the number of those over 65 killed increased by 49%, with 97 fatalities in 2015 compared to 65 in 2014.
| | | | | 2013 | 2014 | 2015 | 2015 % change from | | | | |-------------------------|------|------|------|------|------|------|--------------------|-------|-------|--| | Age | 2000 | 2010 | 2012 | | | | 2014 | 2010 | 2000 | | | 0-5 | 20 | 21 | 12 | 11 | 20 | 10 | -50.0 | -52.4 | -50.0 | | | 6-9 | 16 | 9 | 6 | 3 | 7 | 6 | -14.3 | -33.3 | -62.5 | | | 10-14 | 10 | 10 | 5 | 9 | 3 | 8 | 166.7 | -20.0 | -20.0 | | | 15-17 | 23 | 13 | 15 | 4 | 5 | 11 | 120.0 | -15.4 | -52.2 | | | 18-20 | 51 | 20 | 18 | 29 | 22 | 16 | -27.3 | -20.0 | -68.6 | | | 21-24 | 43 | 40 | 21 | 38 | 25 | 25 | 0.0 | -37.5 | -41.9 | | | 25-64 | 201 | 154 | 121 | 127 | 132 | 145 | 9.8 | -5.8 | -27.9 | | | 65 | 89 | 73 | 55 | 50 | 65 | 97 | 49.2 | 32.9 | 9.0 | | | Total including unknown | 452 | 352 | 261 | 277 | 279 | 322 | 15.4 | -8.5 | -28.8 | |
Table 18.3. Road fatalities by age group
Road safety by road type
In 2015, fatalities on roads outside urban areas rose 28% and account for 60% of all road fatalities. Due to the higher speed limits outside urban areas, the risk of fatalities when a crash occurs is greater.
Economic costs of traffic crashes
Traffic crashes represent a significant cost for society, estimated in 2012 at around ILS 15 billion or 1.1% of GDP.

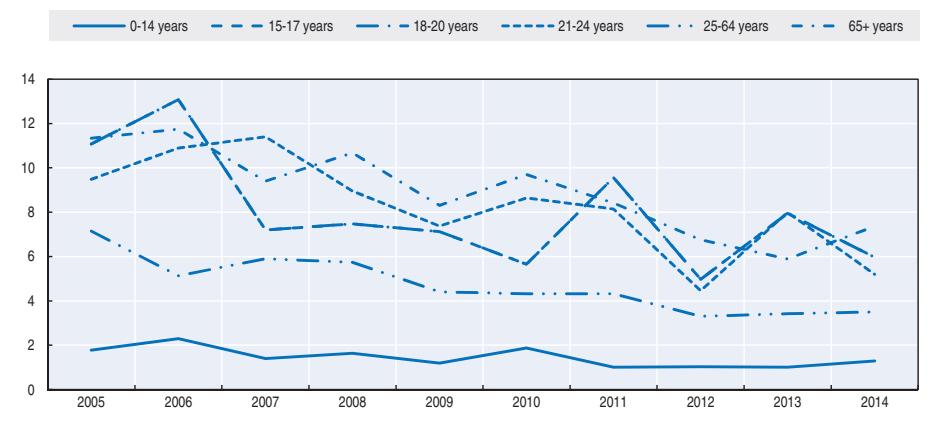
Figure 18.4. Road fatality rate by age and road user group Fatalities per 100 000 inhabitants, 2014
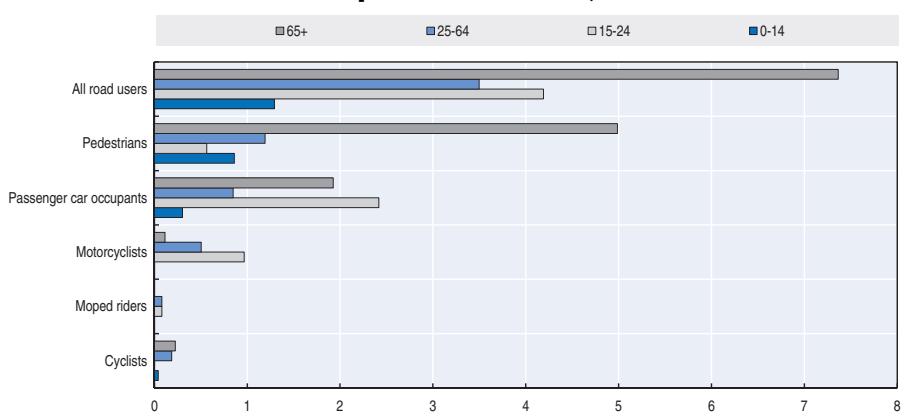
The methodology for assessing road crash costs in Israel was developed in 2004 using a combination of all available data sources and applying a willingness-to-pay approach for the estimation of human costs (Cohen, 2004). The injury and crash cost values were recently updated (Ministry of Transport and Ministry of Finance, 2012). Calculations are based on casualty data from the National Insurance Institute and crash data from the Israel Police. Crash costs include indirect and direct costs, such as:
- medical expenses, assistance and nursing care
- work disability
- property damage costs
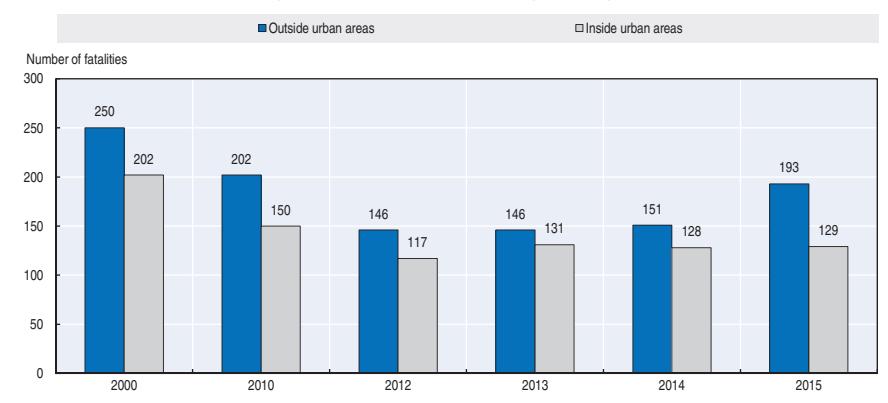
Figure 18.5. Road fatalities by road type
- time lost due to traffic congestion caused by the crash
- administrative costs
- damage to the environment.
Table 18.4. Costs of road crashes, 2012
| Unit cost | Total | |
|---|---|---|
| Fatalities | ILS 6.1 million | - |
| Hospitalised persons | ILS 880 000 | - |
| Slight injuries | ILS 120 000 | - |
| Total | ILS 15 billion | |
| Total as % of GDP | 1.1% |
Source: Ministry of Transport and Ministry of Finance, (EUR 1 = ILS 4.30 in April 2016).
Recent trends in road user behaviour
Speed
In 2014, 11.4% of the fatal crashes were due to excessive speed, compared to 11.9% in 2013. In Israel, there is significant share of non-compliance with speed limits on all nonurban road types. It is especially serious for truck drivers on high-speed roads, where about 90% of them are speeding.
The table below summarises the main speed limits in Israel.
Table 18.5. Passenger car speed limits by road type, 2016
| General speed limit | |
|---|---|
| Motorways | 110 km/h |
| Dual-carriageway roads without at-grade junctions | 90-100 km/h |
| Other dual-carriageway roads | 90 km/h |
| Single-carriageway roads | 80 km/h |
| Local roads | 80 km/h |
| Urban arterial roads | 70 km/h |
| Other urban roads | 50 km/h |
Drink driving
The maximum authorised blood alcohol content (BAC) is 0.5 g/l and 0.1 g/l for drivers under 24 years old, novice drivers for the first two years after receiving their license, and professional and public transport drivers.
The extent of drink driving was for a long time underestimated and not identified as a major problem, but the problem is now recognised. Police have increased roadside alcohol checks and testing for drivers involved in crashes. Conservative estimates indicate that alcohol is a contributing factor in 7-15% of fatal crashes.
In 2011, a national survey of alcohol-impaired driving was undertaken in Israel in co-operation with the Police Traffic Department. Police checked 1 703 drivers on weekend nights on main arterial roads in the vicinity of pubs and nightclubs. Based on the results of the survey and additional extrapolation, it was estimated that in 2011, 6.7% of drivers were suspected of drink driving, while 2.9% of drivers were actually drunk drivers.
Enforcement and public information concerning drink driving is a focus, especially at high-risk times and high-risk locations.
Drugs and driving
Drivers are not routinely checked for drugs, but in the case of fatal crashes the involved parties are tested. The estimation of fatalities due to drugs and driving stands at 2% per year.
Distraction
In Israel, it is legal to drive while operating a hands-free mobile phone, but not with a hand-held phone. The percentage of fatal and non-fatal crashes due to distraction is known to be underestimated.
Sleepiness and fatigue
Based on police reports, between 2000 and 2014 the share of fatal crashes due to fatigue was 1.2%. This percentage is known to be underestimated.
Seat belts and helmets
Seat belt use has been compulsory in front seats since 1975 and in rear seats since 1995.
Seat belts, child safety seats and booster seats are required of all relevant occupants at all times. In 2014, the usage rate among drivers and front seat passengers was 97%, while only 76% of rear seat passengers buckled up.
Dedicated child restraint use is compulsory for children up to eight years old. By law, children in their first year must sit in a rear-facing child restraint; children aged 1-3 must sit in a forward-facing restraint; and children aged 3-8 must sit in a booster seat. The RSA has issued stricter recommendations for children up to age 2 to sit in a rear-facing child restraint; children aged 2-5 to sit in a forward-facing restraint; and children aged 5-10 to sit in a booster seat. According to a 2013 roadside survey, the overall usage rate is 78%.
Similar to previous years, in 2014-2015 15% of all car occupant fatalities were not wearing seat belts when the crash occurred.
Helmet use is compulsory for all motorcycle and moped riders. The rate of use by motorcyclists is close to 100% but varies according to riding conditions (alone or in group), the age of the rider, type of site, size of town, etc.
% 2003 2005 2010 2011 2012 2013 2014 Front seat Driver 89 90 96 96 97 97 97 Passenger 85 84 92 92 95 95 95 Rear seats Adults 23 25 70 68 73 74 74 Children (use of child restraint) 78
Table 18.6. Seat belt wearing rate by car occupancy and road type
Helmets are compulsory for child cyclists and for adults on non-urban roads. A 2013 roadside survey found that over 90% of cyclists wear helmets while riding outside urban areas.
National road safety strategies and targets
Organisation of road safety
The lead agency for traffic safety management is the National Road Safety Authority, which was created in 2007. The agency is charged with:
- financing and co-ordinating traffic safety activities of other government agencies such as the Public Roads Company, the National Traffic Police, the Ministry of Education, and the Ministry of Transport
- funding the analysis of national crash statistics and providing the primary resource for crash data and traffic safety knowledge and research
- creating public information campaigns and various municipal traffic safety projects
Road safety strategy for 2011-20
A five-year strategic plan for road safety was released in 2012. It includes the objectives to reduce the fatality rate to less than four fatalities per billion kilometres travelled and to position Israel among the leading five countries in road safety based on fatalities per kilometre travelled.
Road safety targets
The National Road Safety Authority set a target of no more than 240 fatalities by 2020, corresponding to a reduction of about 30% compared to the 2010 level. In addition, it established the following objectives as a series of indicators:
- increasing seat belt use to 98% for drivers, 95% for front seat passengers and 85% for rear seat passengers
- increasing the use of child restraints (ages 0-15) with a target of 70% correct usage of restraints and no more than 5% unrestrained
- adopting of a "zero tolerance" policy towards drivers in general, and in particular the atrisk populations (new and/or young drivers, drivers of public and/or heavy vehicles, drivers of vehicles carrying hazardous goods)
- increasing the number of alcohol tests performed by the police relative to the total number of drivers from 26% in 2010 to 40% in 2020
- reducing the 85th percentile speed and the percentage of vehicles exceeding speed limits on all types of road.
100
Monitoring targets
200 400 600 Fatalities National target
2000 2001 2002 2003 2004 2005 2006 2007 2008 2009 2010 2011 2012 2013 2014 2015 2016 2017 2018 2019 2020
Figure 18.6. Trends in road fatalities towards national target
Recent safety measures (2013-16)
Road safety management
Traffic rules
A number of updates were introduced in recent years including:
- revision of regulations concerning the use of child restraints (2014)
- equipping all seats in a car with a safety belt (2014)
- permission for cyclists to cross at pedestrian crossings providing they walk with their bicycle (2014)
- banning the use of electric scooters on non-urban roads (2014)
- making illegal having more passengers than seat belts in a car (2014)
- making illegal seating a child in a booster seat with an active air bag (2014)
- revision of regulations regarding cyclists on non-urban roads (2014)
- development of regulations ensuring the safety of electric scooter users (mostly seniors), including prohibition of driving on non-urban roads (2014)
- drivers must give the right of way to pedestrians at crossings, even if they haven't yet started crossing (2015)
- drivers must stop at pedestrian crossings if the car alongside them has stopped (2015).
Road users
Driving license
● A new law for graduated driving licences came into effect on 1 January 2013. This law requires all new drivers (up to the age of 24) for the first three months to drive at all times accompanied by an adult driver with at least five years' driving experience. The following three months require accompaniment for evening and night driving only. An evaluation study of the law will be completed in 2016.
Speed management
● Automatic enforcement of speeding and red light running began in February 2012. The speed enforcement cameras incorporate automatic number plate recognition and can be used for the detection of local and average speeds. The project was accompanied by a three-year evaluation. Speed was reduced around the speed cameras (1 km before and after) but there has not been a more global effect. This may be due to the low number of cameras in place (about 60) (Bar Gera et al., 2014).
Pedestrian safety
A programme to address pedestrian safety was started in 2014, with a specific focus on elderly pedestrians.
Education and awareness
● A number of safety campaigns and education programmes were implemented from 2013-15.
Infrastructure
● An experiment on approaching areas of un-signalised marked pedestrian crossings (zigzag).
Vehicles
● In order to be seen from all directions, large vehicles (longer than 20 metres or wider than three metres) must add flashing yellow lights on top of their vehicle and/or must be accompanied by an accompanying safety vehicle.
Recent and ongoing research
The Road Safety Authority has conducted the following research:
- The perception of speeding by the Israeli driver on urban roads.
- Is air evacuation by helicopter more effective than ambulance evacuation?
- The link between the legal speed limit and speed travelled and the number of crashes and their severity.
- Bicycle riders in urban areas: A roadside survey
References
Bar Gera, H. et al. (2014), The effectiveness of automatic electronic enforcement systems, Road Safety Authority. Cohen, J. (2004), *Road accidents in Israel – their scope, characteristics and the estimate of associated loss for the national econom*y, MATAT Company, commissioned by the Ministry of Transport.
Ministry of Transport and Ministry of Finance (2012), Guidelines for assessing feasibility of transport projects.
Websites
- National Road Safety Authority Israel: www.rsa.gov.il/.
- Transportation Research Institute Technion: http://techunix.technion.ac.il/?ttri/library.html.
- Central Bureau of Statistics Israel: www.cbs.gov.il/.
- Or Yarok Association for Safer Driving in Israel: www.oryarok.org.il/.
Chapter 19
Italy
This chapter presents 2014 road safety data for Italy along with provisional data from 2015. It looks at trends in traffic and road safety from the years 1990 to 2014 and road user behaviour patterns. This includes data on speed, drink driving, drugs and driving, distracted driving, fatigue and seat belt usage. The chapter reviews Italy's road safety strategy and national targets to 2020 and the progress achieved thus far. It also looks at recently implemented safety measures.*
* All data stem from the Italian Ministry of Infrastructure and Transport provided by the University la Sapienza, Automobile Club of Italy and IRTAD unless otherwise noted. For more information please contact: davideshingo.usami@uniroma1.it or l.pennisi@aci.it.
Italy's fatalities decreased by 20 over 2013, reaching an overall total of 3 381 deaths in 2014. This equals a 17.8% reduction in fatalities since 2010. The safety of moped users and motorcyclists significantly improved in 2014 compared to 2013 although these were offset by an increase of almost 5% and 9% respectively in the numbers of deaths among pedestrians and cyclists. To reach the target of 50% less fatalities by 2020 an annual reduction of 6.9% is needed.
Road safety data collection
Definitions applied in Italy
- Road fatality: Any person killed immediately or dying within 30 days as a result of a road crash.
- In crash statistics, injured persons are not differentiated by degree of severity.
In future, Italy will follow the recommendations of the International Road Traffic and Accident Database (IRTAD) and the European Union (EU) and adopt the Maximum Abbreviated Injury Scale of 3 or more (MAIS3+) to define a serious injury. A first estimate of the number of serious injuries, based on hospital discharge data, has been calculated for the years 2013 and 2014 using a conversion table to translate data from the International Classification of Diseases (ICD-9CM).
Data collection
In Italy, road crash data are collected by the National Road Police, the National Military Police (Carabinieri) and the local police. Data collection is centrally organised for the National Road Police and National Military Police, but the local police may have different crash investigation procedures.
The Italian National Institute of Statistics (ISTAT) is responsible for collecting and validating road safety statistics on all injury crashes occurring in Italy. All police forces are obliged to send ISTAT a standard crash form for each injury crash collected. ISTAT checks data consistency, both quantitatively and qualitatively, reviews any deficiencies and proceeds with data correction.
Starting in 2007, some regions signed a memorandum of understanding asking ISTAT to take charge of collecting regional crash data; in some other regions the collection of data is in charge of the local ISTAT Office. Considering both options the system is now working in 15 out of 20 regions. The collection and quality of data has improved but not always the timeliness.
In 2013, representatives from ISTAT, the Automobile Club of Italy, the Ministry of Infrastructure and Transport, the National Road Police, the National Military Police, local police, regions, provinces and municipalities defined a new crash data collection form. The form is more comprehensive and compatible with requirements of the European accident Community database on Accidents on the Road in Europe and the Common Accident Database set (CARE/CADAS).
This process, once completed, is expected to bring a number of improvements, including a unique data collection process and a full set of information gathered for each road crash. However the introduction of the new format requires significant changes to databases and existing programmes and for this reason the adoption has been delayed. Some small changes have been progressively introduced since 2011 to improve localisation of crashes, accident time and nationality of drivers.
Matching police and hospital data to assess underreporting of injury accidents is not carried out at a national level but occasionally at a local level.
Statistics about property damage crashes are released by the National Association of Insurance Companies (ANIA; www.ania.it) and by the National Insurance Supervisory (IVASS; www.ivass.it).
Most recent safety data
Road crashes in 2015 – provisional data
During the first half of 2015 there were 1 596 road fatalities, a 1% increase when compared to the same period in 2014. The number of fatalities increased by 7.4% in urban areas and by 4.1% on rural roads compared to the first half of 2014.
Road crashes in 2014
In 2014, there were slightly more than 177 000 injury and fatal crashes, resulting in 3 381 persons killed. This corresponds to a decrease of about 0.6% in fatalities and 2.5% in crashes.
The decrease was more pronounced on motorways where fatalities fell by 10.6%, mainly because of an exceptionally high figure in 2013. There were also good improvements on rural roads where fatalities decreased by 3.8%. At the same time, inside urban areas the number of people killed in 2014 was 5.4% higher than in 2013.
While the number of fatalities among moped users (-3.3%) and motorcyclists (-10.4%) significantly improved in 2014 compared to 2013, these improvements were offset by an increase of almost 5% and 9% in the numbers of deaths among pedestrians and cyclists.
Trends in traffic and road safety (1990-2014)
Traffic
In Italy, passenger and freight transport is mainly served on roads. The car remains the preferred mean of motorised transport (81.1% vs. 14.6% buses and 4.6% powered twowheelers; ISFORT, 2015). However the number of trips by public transport, cycling and walking is increasing. In particular, the bicycle share increased from 3.1% in 2013 to 3.8% in 2014, and the walking share from 13.8% to 15.4% (ISFORT, 2015)
After two years of successive reductions, the number of new vehicle registrations increased slightly (+0.6%) in 2014. Motorised trips outside urban areas decreased by 3.2% compared to 2013, while trips in urban areas increased by 14.6%. The vehicle fleet started to grow slightly (+137 000 vehicles). Total vehicle-kilometres on motorways in 2014 compared to 2013 increased by 1.01% on average (1.1% for light vehicles and 0.8% for heavy trucks) (AISCAT, 2015, www.aiscat.it).
Gross domestic product (GDP) and household income showed a slight increase (+0.4% and +0.1%)
Road safety
Crashes and casualties
The number of road fatalities peaked in 1972 with 11 078 road deaths. Between 1990 and 2014, the number of fatalities decreased by almost 53%. Most of these improvements though fell on the years after 2000: In fact the National Plan for Road Safety in 1999 was the first normative and legislative act with which the issue of road safety and possible solutions started to be systematically analysed in Italy.
In recent years (2000-2014), fatalities declined by more than 52%. The number of injury crashes started declining in 2003 when the penalty points system was introduced (-29% since 2000). The difference between the reductions in fatalities and injury crashes is mainly due to measures being oriented toward fatality risk (e.g. reduction in average motorway speed and driving-under-influence enforcement) and to the development of safer vehicles.
Since 2001, several road safety measures have been implemented under the National Road Safety Plan 2001-10: improvement of road traffic legislation, increased enforcement, improvement in road infrastructure, communication and awareness campaigns and road safety education interventions. Some important measures include:
- introduction of a penalty point system for drivers (2003)
- progressive implementation since 2005 of the tutor system of cameras controlling average speed on motorways; as of April 2014, the system covers 2 500 km of motorways
- significant increase in penalties for the most dangerous behaviours in relation to speeding, driving under the influence of alcohol or drugs, driving without a licence, and mobile phone use while driving
- restrictions introduced in 2007 for novice drivers during their first three years of driving.
- institution of permanent provincial commissions under the responsibility of the prefect with the task of planning and co-ordinating actions and monitoring accident rates (these committees are active in many provinces, meet twice a year and examine in detail the accident data of the territory with particular regard to sections of road where a high number of accidents occur, primarily if they are caused by speed or distraction)
- wide-ranging reform (2010) of the Highway Code, focusing on the equipment and safety of vehicles, with penalties for the most dangerous kinds of behaviour
- approval of Legislative Decree No. 35 in March 2011 to adopt European Commission Directive 2008/96/EC on Road Safety Infrastructure Management
- field test of Vergilius (a system similar to Tutor), for measuring the instantaneous and average speeds on national roads, operated by ANAS in July 2012
- approval of a law against the murder of "street crime" (L.23/3/2016 nr.41) (the driver of motor vehicles whose reckless behaviour would cause a fatal crash is subject to imprisonment. The law is more severe for professional drivers.)
Rates
In the last 14 years, the mortality rate in terms of deaths per 100 000 inhabitants has declined by 55% and by 59% expressed in deaths per 10 000 vehicles. In 2014, Italy's mortality rate of 5.6 deaths per 100 000 inhabitants, was above the average for the EU28 countries.
Table 19.1. Road safety and traffic data
| 2014 % change from | |||||||||
|---|---|---|---|---|---|---|---|---|---|
| 1990 | 2000 | 2010 | 2013 | 2014 | 2013 | 2010 | 2000 | 1990 | |
| Reported safety data | |||||||||
| Fatalities | 7 151 | 7 061 | 4 114 | 3 401 | 3 381 | -0.6 | -17.8 | -52.1 | -52.7 |
| Injury crashes | 161 782 | 256 546 | 212 997 | 181 660 | 177 031 | -2.5 | -16.9 | -31.0 | 9.4 |
| Number of people seriously injured (health data) | 12 899 | 14 943 | +16 | ||||||
| Deaths per 100 000 inhabitants | 12.6 | 12.4 | 7.0 | 5.7 | 5.6 | -2.4 | -20.0 | -55.2 | -55.9 |
| Deaths per 10 000 registered vehicles | 2.1 | 1.6 | 0.8 | 0.7 | 0.7 | -1.2 | -18.4 | -58.9 | -68.2 |
| Traffic data | |||||||||
| Registered vehicles (thousands) | 34 729 | 44 296 | 51 218 | 51 269 | 51 585 | 0.6 | 0.7 | 16.5 | 48.5 |
| Registered vehicles per 1 000 inhabitants | 613 | 778 | 865 | 859 | 849 | -1.2 | -1.9 | 9.1 | 38.5 |
1 2 http://dx.doi.org/10.1787/888933385503
Figure 19.1. Road Safety, Traffic and GDP Trends index 1990 = 100
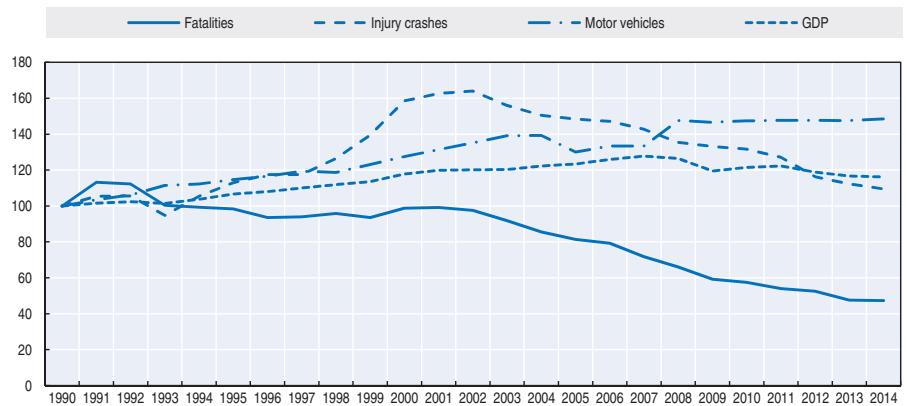
Source: World Bank for Gross Domestic Product (GDP; constant prices).
Road safety by user group
Since 2000, reductions have been recorded for all road user categories. The most important decrease concerned moped riders (-82%). This has to be seen in the context of the introduction of the compulsory use of helmets for moped riders of all ages (from 2000) and a decreasing popularity of this means of transport.
In 2014, road safety improved only for moped users (-10.4%) and motorcyclists (-3.3%). Motorcyclists also benefited from a significant reduction in fatalities in 2013 (-14.5%). This can be partially explained by a reduction in exposure, as the growth of the motorcycle fleet has stagnated. In addition, the implementation of the Directive 2006/126 CE, with its stringent theoretical and practical tests to obtain the first level of licence, may have had a beneficial effect on young drivers of motorcycles whose involvement in road crashes is decreasing at a greater rate than older drivers.
The number of pedestrians and cyclists killed in traffic increased respectively by 4.9% and 8.8% in 2014 compared to 2013. The mortality index (number of fatalities per accident) for pedestrians is four times higher than that of the occupants of passenger cars (reference category), and for motorcyclists and cyclists it is more than double. There is a higher percentage of female cyclists (16.4% women vs 11.4% men) and of the older population (42.5% are aged 70 – 89 years old).
The increase in the number of fatalities among cyclists is probably related to a greater use of bicycles. More efforts are needed to improve safety of vulnerable road users, including better infrastructure for cyclists, awareness campaigns and education. Efforts are needed to encourage better respect of the traffic rules by cyclists and to increase their conspicuity in traffic. Motorised drivers should be made more aware of vulnerable users. The length of cycle lanes is increasing but is still insufficient.
| | | | | | | | 2014 % change from | | | | |-------------------------|-------|-------|-------|-------|-------|-------|--------------------|-------|-------|--| | | 1990 | 2000 | 2010 | 2013 | 2014 | 2013 | 2010 | 2000 | 1990 | | | Cyclists | 477 | 401 | 265 | 251 | 273 | 8.8 | 3.0 | -31.9 | -42.8 | | | Moped users | 620 | 637 | 206 | 125 | 112 | -10.4 | -45.6 | -82.4 | -81.9 | | | Motorcyclists | 713 | 770 | 950 | 728 | 704 | -3.3 | -25.9 | -8.6 | -1.3 | | | Passenger car occupants | 3 797 | 3 850 | 1 822 | 1 487 | 1 491 | 0.3 | -18.2 | -61.3 | -60.7 | | | Pedestrians | 1 069 | 982 | 621 | 551 | 578 | 4.9 | -6.9 | -41.1 | -45.9 | | | Others | 474 | 421 | 250 | 259 | 223 | -13.9 | -10.8 | -47.0 | -53.0 | | | Total | 7 151 | 7 061 | 4 114 | 3 401 | 3 381 | -0.6 | -17.8 | -52.1 | -52.7 | |
Table 19.2. Road fatalities by road user group

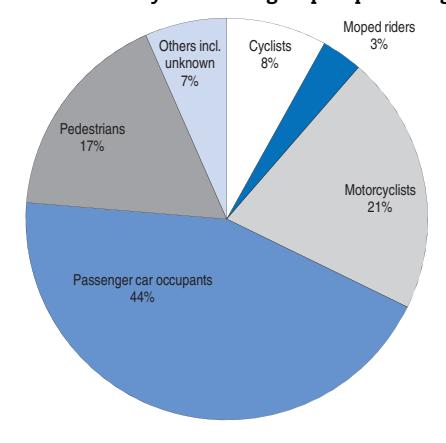
Road safety by age group
Since 1990, the reduction in fatalities benefited all age groups, in particular the young up to 24. The reduction was less marked for seniors, in part due to the ageing of the population.
Despite the 20.5% improvement in fatalities in 2014 for the age group 18-20, this group as well as the 21-24 group are the most at risk in road traffic, with a mortality rate almost twice that of the general population. Older people are the most involved in road crashes as pedestrians.
| | | | | | | | 2014 % change from | | | | |-------|-------|-------|-------|-------|-------|-------|--------------------|-------|-------|--| | Age | 1990 | 2000 | 2010 | 2013 | 2014 | 2013 | 2010 | 2000 | 1990 | | | 0-5 | 69 | 39 | 27 | 26 | 22 | -15.4 | -18.5 | -43.6 | -68.1 | | | 6-9 | 60 | 34 | 14 | 8 | 11 | 37.5 | -21.4 | -67.6 | -81.7 | | | 10-14 | 118 | 63 | 29 | 27 | 27 | 0.0 | -6.9 | -57.1 | -77.1 | | | 15-17 | 429 | 211 | 121 | 116 | 134 | 15.5 | 10.7 | -36.5 | -68.8 | | | 18-20 | 640 | 485 | 253 | 224 | 178 | -20.5 | -29.6 | -63.3 | -72.2 | | | 21-24 | 786 | 740 | 294 | 302 | 306 | 1.3 | 4.1 | -58.6 | -61.1 | | | 25-64 | 3 245 | 3 637 | 2 218 | 2 383 | 2 270 | -4.7 | 2.3 | -37.6 | -30.0 | | | 65 | 1 436 | 1 437 | 1 064 | 1 094 | 1 090 | -0.4 | 2.4 | -24.1 | -24.1 | | | Total | 7 151 | 7 061 | 4 114 | 3 401 | 3 381 | -0.6 | -17.8 | -52.1 | -52.7 | |
Table 19.3. Road fatalities by age group
Figure 19.3. Road fatality rates by age group Deaths per 100 000 inhabitants in a given age group, 1990-2014
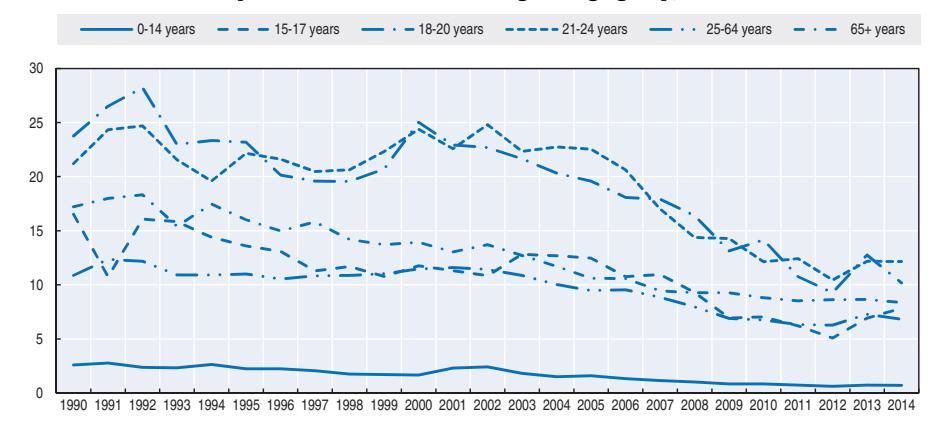
Road safety by road type
In 2014, 47% of fatalities occurred on rural roads, 45% inside urban areas and 8% on motorways.
In 2014, the most severe crashes occurred on rural roads, with nearly five deaths for 100 road crashes. Crashes inside urban areas are less severe (1.1 deaths per 100 crashes). For motorways, the index is 3.1 deaths per 100 crashes.
In 2014, the greatest improvements in fatality numbers were observed on motorways (-10.6%), followed by a more moderate reduction (-3.8%) on rural roads. Inside urban areas, however, the number of fatalities increased by 5.4% compared to 2013. The important decrease on motorways is due to the fact that in 2013 the number was exceptionally high due to a bus crash that killed 40 people.
Compared to 2010, the benchmark value for the decade 2011-20, the fatalities reduction was higher on motorways (-23.7%), followed by suburban roads (-18.8%) and urban roads (-15.5%). The decrease in the total number of deaths in large municipalities, compared to 2010, is approximately 25%.
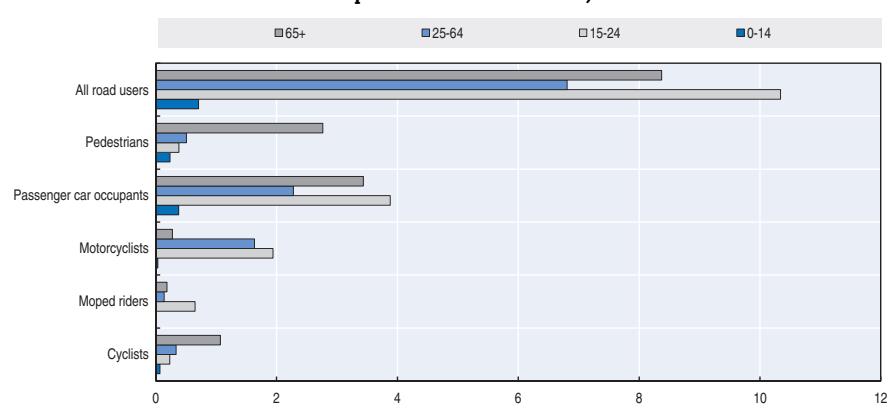
Figure 19.4. Road fatality rate by age and road user group Fatalities per 100 000 inhabitants, 2014
Figure 19.5. Road fatalities by road type
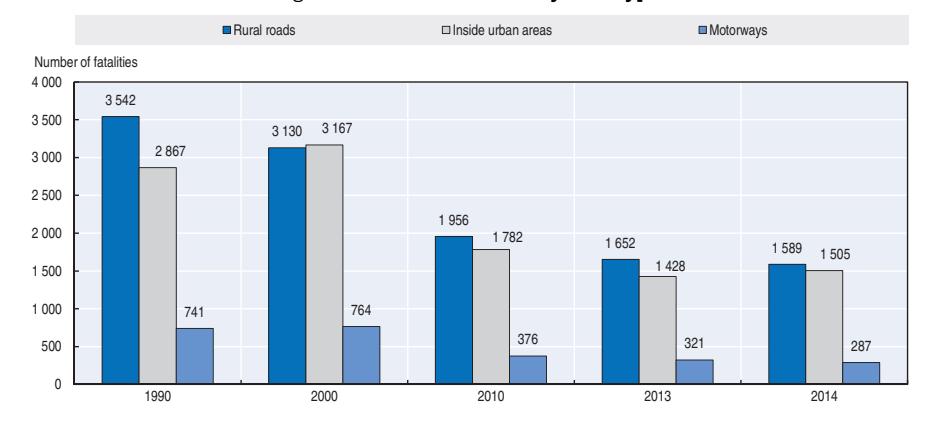
The main cause of crashes on urban roads is the failure to respect the rules of precedence or traffic signals (18.6%), while on rural roads and motorways it is distracted driving (21.4%) and excessive speed (17.3%).
Economic costs of traffic crashes
A report by the Ministry of Infrastructure and Transport assessed the societal costs of road crashes in Italy based on a human capital approach. The average cost per road crash has been estimated by degree of severity: for fatal, serious, slight and property damage-only crashes. Since in Italy injured persons reported by crash statistics are not differentiated by degree of severity, in order to estimate the human costs regarding a severe or slightly injured person, the definitions of "slightly" and "seriously injured" used in the European road accident database CARE/CADAS have been adopted (i.e. hospitalised at least 24 hours for seriously injured and hospitalised less than 24 hours for slightly injured).
The table below shows the main results in terms of average casualty costs and the overall average crash cost per severity in Italy in 2011. Based on this value, it is estimated that in 2013, road crashes cost Italian society EUR 24.3 billion, or 1.6% of GDP.
Table 19.4. Costs of road crashes, 2013
| Unit cost | Total | |
|---|---|---|
| Fatalities | EUR 1.503 million | |
| Hospitalised persons | EUR 0.197 million | |
| Slight injuries | EUR 0.017 million | |
| Property damage costs | EUR 6.39 billion | |
| Total | EUR 24.34 billion | |
| Total as % of GDP | 1.6% |
Source: Ministry of Infrastructures and Transport (2015).
Recent trends in road user behaviour
Speed
In 2014, on the basis of police data, inappropriate speeds were reported in 11% of injury crashes, and about 19% of fatalities were related to speed.
The table below summarises the main speed limits in Italy.
Table 19.5. Passenger car speed limits by road type, 2016
| General speed limit | Comments | |
|---|---|---|
| Urban roads | 50 km/h | |
| Rural roads | 90 km/h | |
| Motorways | 130 km/h | 110 km/h in case of rain or snow 100 km/h for novice drivers In theory, the motorway operator may decide to increase the limit up to 150 km/h, if stringent requirements are met. |
Drink driving
The current blood alcohol content (BAC) limit in Italy, which came into force in 2002, is 0.5 g/l.
Since July 2010, there is zero tolerance for young, novice and professional drivers, for whom the BAC limit is 0.0 g/l.
Drink driving crashes are defined in police reports as crashes in which a driver has a BAC above the legal limit. In 2008, ISTAT indicated that 2% of traffic fatalities were due to drink driving. However, this figure is probably underestimated, due to the difficulty in collecting this information on the spot.
According to data from national and local police, the number of fines given for drink driving is decreasing. In 2015 the national traffic and military police issued around 38 000 fines for drunk driving and the local police about 5 000.
Drugs and driving
Drivers under the influence of drugs can be imprisoned for a period varying from six months to one year, fined EUR 1 500 to 6 000 and can have their driving licence withdrawn for between one and two years, or two to four years if the vehicle does not belong to the driver.
Due to difficulties in collecting the relevant data on the scene of the crash, drug use data are probably underestimated and are not disseminated.
A pilot project to enhance the effectiveness of roadside control procedures of drivers under the influence of drugs has been undertaken by the traffic police during the summer period (2015). A preliminary sample of the driver's saliva is examined through the use of drug tests capable of detecting 5 types of drugs. In the case of a positive first check, a second sample is sent to the forensic toxicology laboratory of the state police. Results are expected in 2016.
Distraction
In 2014, it was estimated that distraction was a contributing factor in 17% of injury crashes and it is the second contributing factor in fatal accidents after speed.
Since 2002, the use of hand-held mobile phones or full headsets while driving is not permitted. The use of hands-free devices, including those with a single earpiece headset, is permitted. According to the "Ulisse" monitoring system, in 2015 it was estimated that in Italy about 5.3% of drivers use the phone without a headset while driving.
In 2015, around 150 000 fines were issued by the police forces for the use of a phone while driving, and this number is increasing.
Sleepiness and fatigue
Even if there is no evidence on the basis of police data, it is assumed that fatigue and drowsiness are a contributing factor in about 22% of injury road crashes (Garbarino, 2010).
Seat belts and helmets
Seat belt usage has been compulsory in front seats since 1988 and rear seats since 1994. It has also been compulsory on micro cars since 2011. Children under 12 and less than 150 cm should be seated in a dedicated and approved child restraint system adapted to their weight and stature.
Beginning in 1986, helmet use was compulsory for motorcyclists and moped riders under 19 years old. Since 2000 helmets are required for all powered two-wheelers and for all ages. During 2009-11, helmet use in urban areas was nearly 90%. The percentage is higher on rural roads.
The (self-reported) use of safety equipment has been estimated through a road user behaviour survey (PASSI) conducted from 2010-2014 by the National Institute of Health. It is a telephone (CATI) statistical survey conducted by local health facilities to a sample of people between 18 and 69 years old (for more information: www.epicentro.iss.it/passi/ procedure/rilevazione.asp).
In the period 2010-14, some 84% of respondents who have travelled by car as a driver or front seat passenger claim to always wear a seat belt. The use of seat belts on rear seats is uncommon: only 20% of respondents claimed to systematically wear them. In addition, 95% of the interviewees who travel on motorcycles as the driver or passenger declared that they always wore a helmet.
Since 2011, the use of child seats and/or adapters has also been monitored, asking adults who claim to live in a family with children under 6 years of age if, while travelling by car, the child has difficulty in staying in his seat or on the adapter. This serves as a proxy of the "non-use" or "inappropriate use" of these systems. The data relating to the 2011-14 period show that 22% of respondents have difficulty or do not use or even do not have any safety device for the child. This percentage rose to 34% in one region in the South.
An observational survey "Ulisse" carried out by the National Institute of Health and the Ministry of Infrastructures and Transport focused on the use of helmets, seat belts in front and rear seats, restraint systems for children and hand-held phones. Data are collected in two stages from a sample of selected urban and suburban areas throughout the country.
Preliminary results (data not published) highlight important differences with the survey based on stated behaviours. The use of helmets is about 98%, the use of seat-belts in front and rear seats are respectively 62% and 15%. The use of child restraint systems is observed in 48% of cases and finally use of hand-held phones is reported in some 5.3% of drivers.
However it should be highlighted that these results are just preliminary estimates, final consolidated results are expected to be published in 2016.
2009-11 2015 preliminary estimates Front seat General (driver + passengers) 63.8% (urban roads) 75.5% (outside urban areas) Rear seats General 10% 15% Children (use of child restraint) No data 48%
Table 19.6. Seat belt wearing rate by car occupancy and road type
National road safety strategies and targets
Organisation of road safety
Road safety policy making is centralised in Italy. The Ministry of Infrastructure and Transport, through its Directorate for Road Safety, is responsible for national road safety plans and road safety programme. National and local road authorities are responsible for the improvement of road infrastructure.
Police forces are responsible for the enforcement of traffic law. The Italian National Institute of Statistics is responsible for collecting road safety statistics on injury crashes at the national level.
A national structure has been created for consultation with stakeholders.
Road safety strategy for 2011-20
The National Road Safety Plan, Horizon 2020 is expected to be approved by an interministerial board in 2016. It is in accordance with the actions and targets (-50% fatalities) recommended by the European Commission.
The main vision of the Plan is "No child should die on the road". The Plan will propose a hierarchical system of objectives with two levels, allowing the monitoring of both the general road safety trend and specific targets related to road users in high risk groups such as motorcyclists, cyclists and pedestrians.
Road safety targets
The draft version of the Road Safety Plan identifies priority areas and sets specific objectives for the categories of road users showing the highest risk levels: powered-twowheelers; cyclists, pedestrians and users involved in work-related road crashes.
Intermediate targets have been proposed for 2017, when a mid-term review of the Plan is expected. They are based on an average annual reduction of fatalities by 7%, corresponding to a reduction by 38% in 2017 in comparison with 2010.
Monitoring targets
A monitoring process is being implemented in order to control the implementation of the road safety measures co-funded by the Road Safety National Plan.
To reach the EU target of a 50% fatality reduction, an average annual reduction of 6.9% is required.
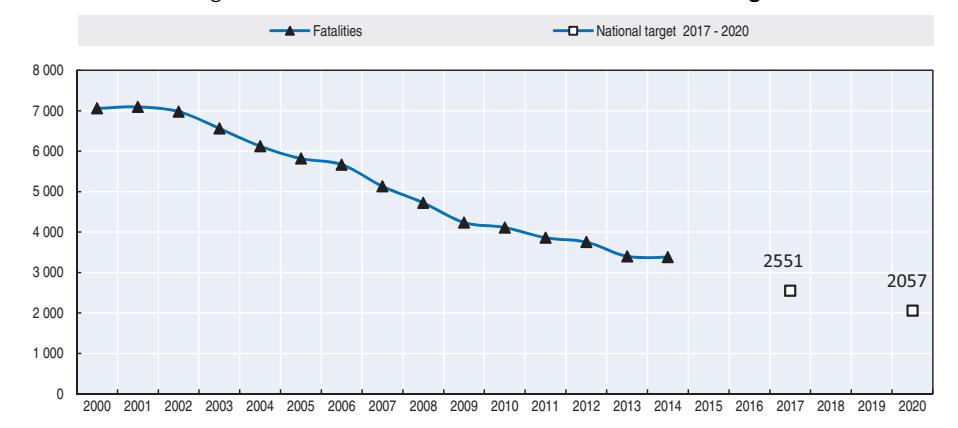
Figure 19.6. Trends in road fatalities towards national target
Recent safety measures (2013-16)
Road safety management
● At least twice a year the Ministry of Infrastructure and Transport convenes a technical committee, formed of representatives of regional governments responsible for road safety, to monitor the implementation of the Plan and discuss other road safety related matters.
Road users
Speed management
- In 2006, a section system of speed control called Tutor was introduced to measure average speeds on sections of motorway with high crash rates. As of 2014, the system was operational on about 2 900 km of motorways, or 43% of the motorway network. According to a study (Montella et al., 2015) carried out on an urban motorway in Italy, the section control system results in an impressive reduction in speed variability and a reduction of excessive speeding behaviour.
- By the end of 2013, 30 km/h zones were implemented in 52 out of 85 capital cities with the aim of improving quality of life and quality of urban spaces, as well as reducing the risk of road accidents, especially for vulnerable road users
● "Vergilius", a system similar to "Tutor" for measuring instantaneous and average speeds on national roads, has been underway since 2012. The system is now operating on about 150 km of high risk portions of national roads and the A3 motorway.
Education and awareness
- After previous campaigns in 2009, 2010 and 2013 a new national road safety campaign "On the right road" was launched in March 2016. The campaign is based on 5 messages: use of seat belts, distraction while driving, improved visibility for cyclists, speed and vulnerable road users, and children restraint systems.
- "Going back is impossible: stay on track" is the slogan used by the campaign. The goal is to convey a simple and effective message that road safety is the responsibility of each of us. The campaign will be broadcast on TV, radio, print, billboards, web.
Vehicles
● A law proposed in 2015, but not yet approved, would make insurance less costly for cars equipped with an alcolock or a black box to record vehicle data in case of a crash accident. A similar proposal was made in 2012 but it failed to be adopted. Nevertheless the insurance companies' policy has been to offer large discounts to motorists who have installed the black box. According to the National Association of Insurance Companies (ANIA) it is estimated some 3 million vehicles were equipped with black boxes by the end of 2014 (www.ania.it/export/sites/default/it/pubblicazioni/Dossier-e-position-paper/Dossier-Scatole-nere-Italia-leader-nel-mondo-Aggiornamento-novembre-2014-21.11.2014.pdf).
Post-crash measures
● The implementation of E-call, an automatic call to the emergency services in the case of an accident, is a shared responsibility among the Ministry of Infrastructure and Transport, the Ministry of Interior and the Ministry of Economic Development, each one with his own responsibility. At the moment the pilot project carried out in the province of Varese is going to be extended to all the Lombardia Region and a test with cars equipped for the automatic call will be led on the motorway A22 "del Brennero".
Recent and ongoing research
Some research projects are presented below.
● A new study on road accidents was carried out in 2015 by the Statistical Department of Transport with the cooperation of other relevant Institutions (www.mit.gov.it/mit/site. php?p=cm&o=vd&id=4222).
References
Garbarino, S. (2010), Sonnolenza ed incidenti stradali: epidemiologia e strategie preventive, published by the Italian Association of pulmonologists (AIPO).
AISCAT (2014), AISCAT informazioni, edizione semestrale, www.aiscat.it.
ISFORT (2015), 12° Rapporto sulla mobilità in Italia, Istituto Superiore di Formazione e Ricerca per i Trasporti. ISTAT (2014), L'incidentalità nelle Regioni d'Italia. Anno 2013, ISTAT, Rome, www.istat.it/it/archivio/152407.
Italian Ministry of Infrastructure and Transport (2012), Studio di valutazione dei Costi Sociali dell'incidentalità stradale, Ministero delle Infrastrutture e dei Trasporti, Rome.
Italian Ministry of Infrastructure and Transport (2015), Statistica finalizzata alla sicurezza nel trasporto, Ministero delle Infrastrutture e dei Trasporti, Roma, www.mit.gov.it/mit/mop\_all.php?p\_id=21097 (accessed 9 May 2016).
Montella, A. et al. (2015), Effects on speed and safety of Point-to-Point speed enforcement systems: evaluation on the urban motorway A56 Tangenziale di Napoli, Accident Analysis and Prevention 2015 Feb;75:164-78.
Websites
- Ministry of Infrastructures and Transport: www.mit.gov.it.
- National Institute of Statistics: www.istat.it.
- Automobile Club of Italy: www.aci.it and www.lis.aci.it.
- Centre for Transport Logistics of the University La Sapienza: www.ctl.uniroma1.it.
- Austostrade per l'Italia: www.autostrade.it.
- AISCAT: www.aiscat.it.
- ISS National Health Institute: www.iss.it.
- ISFORT, Istituto Superiore Di Formazione E Ricerca Per I Trasporti: www.isfort.it.
- Polizia di Stato, National Police data: www.poliziadistato.it/pds/stradale/archivio/.
Chapter 20
Jamaica
This chapter presents 2014 road safety data for Jamaica along with provisional data from 2015. It looks at recent trends in traffic and road safety and road user behaviour patterns. This includes data on speed, drink driving, drugs and driving, distracted driving, fatigue and seat belt usage. The chapter reviews Jamaica's road safety strategy and national targets along with recently implemented safety measures.*
* Data included in this report have not been validated by IRTAD. All data stem from the Ministry of Transport, Works and Housing unless otherwise noted. For more information please contact: Khare@mtw.gov.jm.
Jamaica's road deaths saw their third consecutive year of increase according to provisional data for 2015 with 382 fatalities, a 15% increase over 2014. For the first time in Jamaica's road safety history motorcyclists overtook pedestrians as the user group with the most fatalities, equal to that of passenger car occupants at 31%. This was a 63% increase over 2014. Vulnerable users including pedestrians and senior citizens are also particularly at risk. Jamaica's road safety strategy is focusing on resolving these problems through education, legislation and improved infrastructure towards a "Safe System" approach.
Road safety data collection
Definitions applied in Jamaica
- Road fatality: Death which occurred within 30 days of the road crash.
- Injury crash: Crash resulting in at least one injured or killed person.
Data included in this report correspond to the consolidated set of police data. They have not been validated by the International Road Traffic and Accident Database (IRTAD) group.
Data collection
Jamaica joined the IRTAD group in 2012 as an observer country. It benefits from a twinning programme organised by IRTAD with the Transport Research Laboratory and the UK's Department for Transport (DfT). The aim of the twinning is to review the current crash data collection and analysis system and to provide advice in areas of road safety which are data related. It is envisaged to provide data to IRTAD in 2016. Stakeholders in Jamaica have been provided with technical devices and assistance for crash data collection. Once the exercise is complete, Jamaica plans to share best practices and knowledge with other countries in the Caribbean.
In Jamaica, traffic crash data are collected by police officers in 19 police divisions and sent on standardised forms to the divisional level where they are vetted. The crash reports are then sent to the police traffic headquarters where records are again reviewed and vetted. The police traffic headquarters then forwards the reports to the Road Safety Unit in the Ministry of Transport, Works and Housing, where individual crash records are entered in the database system and become the basis for traffic crash analysis.
Traffic officers are progressively being equipped with Global Positioning System handsets allowing them to easily and precisely code the location of a crash.
The Ministry of Transport, Works and Housing indicates that most road fatalities are captured in the police-based reporting system. Comparisons of the fatality numbers with Health Ministry and Vital register data sources will help support this assumption. However, there is still more work to do to improve the ability to capture information on injuries. Measures are currently being developed to improve this aspect of the data system. It is expected that by 2016, the Injury Surveillance System will be fully operational, thus ensuring that injury data can be collected from all hospitals on the island.
Most recent safety data
Road crashes in 2015 – provisional data
Road fatalities further increased from 331 in 2014 to 382 in 2015 which represents a 15% increase. Vulnerable road users are the most killed on the road network. For the first time in Jamaica's road safety history, motorcyclists overtook pedestrians as the most killed road user in the traffic environment. They accounted for 31% of the road users killed while pedestrians accounted for 24% and cyclists for 7%.
Road crashes in 2014
Road fatalities escalated to 331 in 2014, the highest since 2009. More than half the fatalities were vulnerable road users (pedestrians, motorcyclists and cyclists). Therefore significant efforts are being made to address the danger to vulnerable road users. Passenger car occupants are the second largest casualty group. Most of them were not wearing a seatbelt, although it is compulsory.
Trends in traffic and road safety (1990-2015)
Traffic
Since 1990, total vehicle-kilometres driven have increased significantly, but there is no precise breakdown for different vehicle types. Total vehicle-kilometres travelled in 2013 increased, which can be seen as a return to the normal upward trend after a period of stagnation starting in 2010 due to the economic recession.
It is difficult to get accurate figures for the size of the registered vehicle fleet in Jamaica. The Ministry of Transport, Works and Housing is working with other ministries to improve access to figures for the registered vehicle fleet.
Road safety
Crashes and casualties
The number of road fatalities peaked in the year 1993. In the last ten years, between 2004 and 1994, the number fluctuated between 307 and 383, except in 2012 when it reached a historic low of 260 road fatalities. Some of the reductions experienced recently may be attributable to the recent reduction in traffic and the economic climate.
Rates
In 2014, the rate of annual deaths per 100 000 inhabitants was 12.2.
1991 2000 2010 2012 2013 2014 2014 % change over 2013 2010 2000 1991 Reported safety data Fatalities 444 334 319 260 307 331 7.8 3.8 -0.9 -25.5 Injury crashes 4 765 3 973 3 917 3 171 -19.0 -33.5 Deaths per 100 000 inhabitants 18.7 12.9 11.8 9.6 11.3 12.2 7.7 3.4 -5.4 -34.8 Deaths per 10 000 registered vehicles 58.6 9.4 7.5 8.7 9.3 6.8 -1.0 -84.1 Traffic data Registered vehicles (thousands) 57 339 347 352 357 1.3 5.2 526.3 Registered vehicles per 1 000 inhabitants 22 126 128 130 131 0.7 4.0 498.2
Table 20.1. Road safety and traffic data
1 2 http://dx.doi.org/10.1787/888933385514
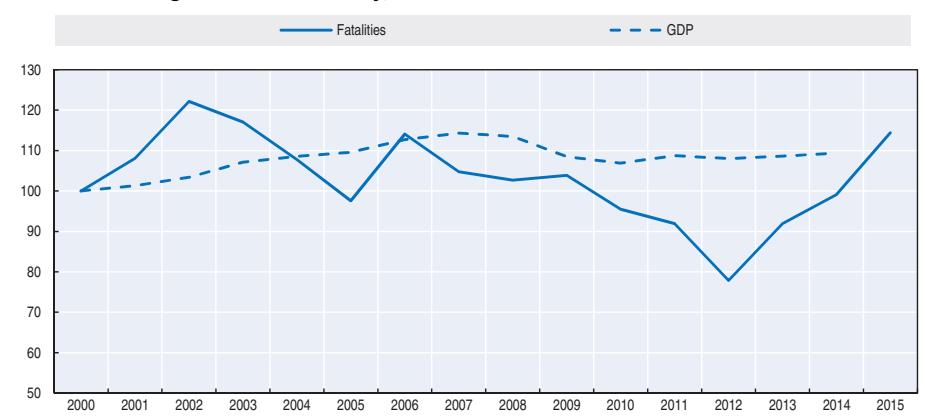
Figure 20.1. Road safety, traffic and GDP trends index 2000 = 100
Source: World Bank for gross domestic product (GDP; constant prices).
Road safety by user group
Improving the safety of vulnerable road users is a key priority in Jamaica. In 2015, they accounted for 62% of the road users killed in traffic crashes, which means that significant efforts must be made to ensure that these road users are protected both in terms of education, enforcement and engineering.
In 2015, for the first time in Jamaica's road safety history, motorcyclists overtook pedestrians as the most killed road user in the traffic environment. They accounted for 31% of the road users killed while pedestrians accounted for 24% and cyclists for 7%. Motorcyclist safety deteriorated in 2015 with an increase of 63% in the number of road deaths among this user group. One of the fundamental challenges is the unwillingness of motorcyclists to wear a protective helmet.
Whilst there was a 8% reduction in pedestrian fatalities when compared with 2014, the level of pedestrian fatalities is still cause for profound concern The safety level of public transport vehicles is also a high priority and concern in Jamaica as many people rely on buses for their journeys.
| Road users | | | | | | | 2015 % change over | | | | |-------------------------------|------|------|------|------|------|------|--------------------|-------|--|--| | | 2010 | 2011 | 2012 | 2013 | 2014 | 2015 | 2014 | 2010 | | | | Cyclists | 26 | 33 | 17 | 26 | 29 | 26 | -10.3 | 0.0 | | | | Motorcyclists | 44 | 49 | 45 | 64 | 73 | 119 | 63.0 | 170.5 | | | | Passenger car occupants | 107 | 93 | 91 | 98 | 86 | 119 | 38.4 | 11.2 | | | | Pedestrians | 115 | 107 | 85 | 89 | 99 | 91 | -8.1 | -20.9 | | | | Others incl. public transport | 27 | 26 | 22 | 30 | 44 | 27 | -38.6 | 0.0 | | | | Total | 319 | 308 | 260 | 307 | 331 | 382 | 15.4 | 19.7 | | |
Table 20.2. Road fatalities by road user group
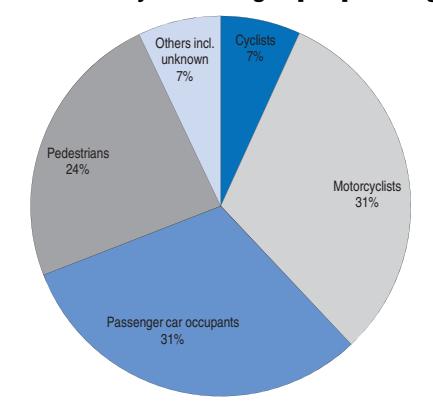
Figure 20.2. Road fatalities by road user group in percentage of total 2015
Road safety by age group
Jamaica continues to grapple with the issue of young people being the most killed in traffic. In 2015, more than half of the persons killed in traffic belong to the 5-39 age group. The 25-39 age group which is the most productive and who have young families accounted for 35% of the road fatalities while they make up 22% of the general population. It is also important to note that 87% of the fatalities are male.
Road safety is an important public health issue for Jamaica as it continues to destroy the socio-economic fabric of the nation.
The elderly population is also at profound risk and they are particularly vulnerable as pedestrians: in 2015, 55% of those over 60 years of age that were killed on the roads were pedestrians. Protecting this group of road users will be the focus from 2016-2020.
| 2015 % change over | |||||
|---|---|---|---|---|---|
| Age | 2012 | 2013 | 2014 | 2015 | 2014 |
| 0-14 | 13 | 16 | 14 | 6 | -57 |
| 15-24 | 56 | 51 | 67 | 79 | 18 |
| 25-39 | 58 | 90 | 85 | 134 | 58 |
| 40-59 | 59 | 68 | 89 | 78 | -12 |
| 60 and above | 57 | 59 | 49 | 51 | 4 |
| unknown | 17 | 23 | 27 | 34 | 26 |
| Total | 260 | 307 | 331 | 382 | 15 |
Table 20.3. Road fatalities by age group
Road safety by road type
The road network in Jamaica is classified in the following manner:
- Main roads are controlled by the Ministry of Transport, Works and Housing.
- Local roads are controlled by the Ministry of Local Government and Community Development.
In 2015, 73% of road fatalities occurred on rural roads and speeding is reported to be the main cause of crashes.
Economic costs of traffic crashes
There is no current estimation of the global costs of road crashes. The ongoing IRTAD twinning with the programme Transport Research Laboratory and the support of the Inter-American Development Bank will provide an opportunity to acquire the expertise to assess these costs.
Recent trends in road user behaviour
Speed
Speeding remains the number one cause of fatal road crashes. The table below summarises the main speed limits in Jamaica.
Table 20.4. Passenger car speed limits by road type, 2016
| Urban roads | 50 km/h | A few roads have a speed limit of 80 km/h |
|---|---|---|
| Rural roads | 50 km/h | A few roads have a speed limit of 80 km/h |
| Motorways | 70 km/h or 110 km/h |
Drink driving
In Jamaica, the Road Traffic Act states that the legal alcohol limit for all drivers is 35 micrograms of alcohol in 100 millilitres of breath, or a blood alcohol content (BAC) of 0.8 g/l.
Drugs and driving
There are no tests currently available to test drivers for drug consumption.
Distraction
It is not illegal to use a hand-held or hands-free phone while driving. However, the Road Traffic Act is going to address this issue.
Seat belts and helmets
All drivers of cars, trucks and buses are required to wear a seat belt. It is mandatory for car passengers in front and back seats to wear a seat belt. For trucks or buses, front seat passengers must wear a seat belt. There is no regular survey on the use of seat belts.
All motorcyclists (drivers and passengers) are required to wear an approved helmet. Of the 56 motorcycle drivers who died in 2013, only two were wearing a helmet.
There is no mandatory helmet use law for cyclists. However, cyclists are encouraged to use one.
National road safety strategies and targets
Organisation of road safety
The National Road Safety Council is the lead agency for road safety, having the central role of co-ordinating activities with and among local administration stakeholders, such as the police, the insurance sector, the medical sector and others. It was established in 1993 as a non-profit organisation and depends on the Office of the Prime Minister for its main funding.
The National Road Safety Council is responsible for safety legislation, education and communication campaigns.
Road Safety in Jamaica is guided by three main policies:
- National Road Safety Policy.
- Vision 2030 Transport Sector.
- National Transport Policy.
Road safety strategy for 2016-20
The current road safety strategy covers the period 2016-20 and is focused on improving the safety of vulnerable road users. It is based on five pillars:
- Education and information. This includes:
- ❖ vulnerable road user campaigns through a wide support of medias, including social media
- ❖ a road safety education in schools programme targeting both primary and secondary schools
- ❖ "Do Road Right Campaign" geared towards behaviour modification of all the categories of road users
- ❖ a road safety community outreach partnership with the Social Development Commission.
- Enforcement and legislation. This includes:
- ❖ more visible police presence on high risk locations
- ❖ speed reduction campaigns
- ❖ strengthening of driver behaviour enforcement
- ❖ the continuation of the "Operation Fit Vehicles" to ensure that only vehicles in good condition are operated.
- Engineering and traffic environment. This includes:
- ❖ improvement of the safety of roads and roadsides, applying the safe system principles and the concept of "Forgiving Roads".
- ❖ road safety audits and inspections.
- Emergency response
- Evaluation
Road safety targets
The previous road safety programme included the target of reducing the number of fatalities to below 300 by 2012. The target was achieved in 2012; however the number of road deaths rose above 300 in 2013 and 2014. The target of the 2012-15 strategy was to reduce the number of fatalities below 240 by 2016. Based on the forecasts, achieving this target will be difficult.
The Cabinet Office review of the National Road Safety Policy will be fully completed in 2016.
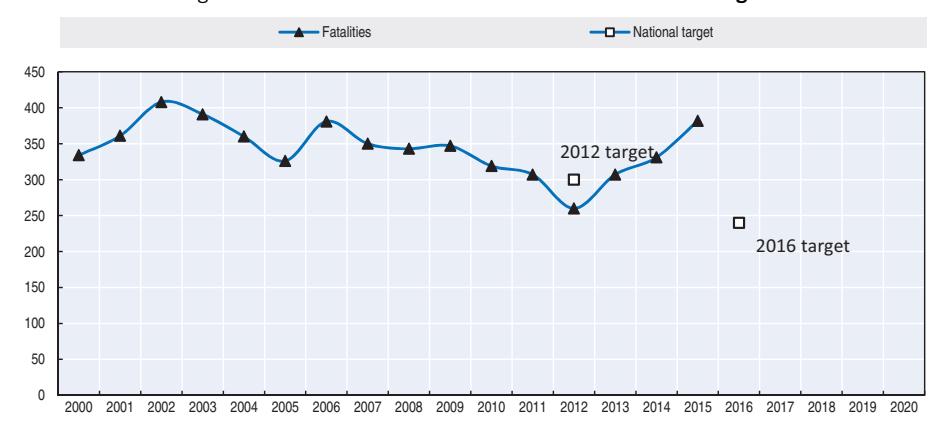
Figure 20.3. Trends in road fatalities towards national target
Recent safety measures (2013-16)
Road safety management
Legislation
● The Ministry of Transport, Works and Housing is working towards the adoption in 2016-17 by the House of Parliaments of a modernised Road Traffic Act. The main road safety issues are addressed in the proposed act, including driver training, education, and a graduated driving licence system.
Crash data system
● The IRTAD twinning with the Transport Research Laboratory in the United Kingdom, initiated in 2013 with support from the Inter-American Development Bank, focuses on improving the crash data collection and analysis system. The goal of progressive improvements of the crash data system is to ensure that all road safety stakeholders have seamless access to crash data, allowing them to make well informed decisions in a timely manner. Efforts are also ongoing to develop a methodology for the assessment of road crashes costs.
Road users
Education and awareness
- Children from primary, secondary and tertiary schools receive classes on road safety.
- The National Council on Technical and Vocational Education and Training has developed a "Driving Operations Curriculum". This programme is primarily for the attention of secondary school students, so that they acquire at school the required road safety knowledge and skills.
Infrastructure
● The major motorway that connects the North and South of Jamaica was completed in 2015.
● Road Safety audits and inspections have become standard operation and will be intensified during the period 2016-20 in order to ensure that the concept of "Forgiving Roads" and "Safe System Approach" are fully integrated into road construction and maintenance practices.
Vehicles
● A comprehensive motor Vehicle Safety Standard will be implemented by 2020 to regulate the quality of motor vehicles allowed to circulate. .
Post-crash measures
- The Ministry of Transport, Works and Housing will be working with the Ministry of Health to ensure adequate first aid training.
- The Jamaica Automobile Association is organising first aid training in Northern Jamaica. This will contribute to developing a pool of trained "First Responders to Traffic Crashes" in the various communities close to high risk areas.
- The Ministry will continue to work with the Jamaica Fire Brigade and other road safety stakeholders to ensure road users understand the importance of post-crash care.
References
World Health Organization (2014), Global status report on road safety, WHO, Geneva.
Websites
- Ministry of Transport, Works and Housing: www.mtw.gov.jm.
- National Road Safety Council: www.nationalroadsafetycouncil.org.jm.
Chapter 21
Japan
This chapter presents 2014 road safety data for Japan along with provisional data from 2015. It looks at trends in traffic and road safety from the years 1990 to 2015 and road user behaviour patterns. This includes data on speed, drink driving and the use of seat belts and helmets. The chapter reviews Japan's road safety strategy and national targets to 2020 and briefly looks at the most recently implemented safety measures.*
* All data stem from the National Police Agency and IRTAD unless otherwise noted. For more information please contact: k.fujimaki.x2.9j@npa.go.jp.
Japan, with its population of over 127 million, has seen a steady decrease in road fatalities since 1990. In 2014, it saw the lowest ever level of road fatalities since records began, with a total of 4 838 persons killed and a death rate of 3.8 persons per 100 000. The majority of fatalities, 54%, were in the over 65 age group, highlighting a key priority for the Japanese government of improving safety for the elderly.
Road safety data collection
Definitions applied in Japan
- Road fatality: Two definitions are used; persons who die within 24 hours of a crash or within 30 days of a crash. Two sets of records are also kept. The data in this report and included in the International Road Traffic and Accident Database (IRTAD) use the 30-day definition.
- Serious injury: Injury which requires medical treatment for 30 days or more.
- Slight injury: Injury which requires medical treatment for less than 30 days.
There is no plan to adopt a definition of serious injuries based on the Abbreviated Injury Scale.
Data collection
In Japan, road crash data are collected by the police. The National Police Agency has been collecting crash data since 1948. In 1966, an online database system was created and in 1993 the 30-day definition for a crash fatality was added.
Hospital data are not used to complete police data. They may be used on an ad-hoc basis for research.
Most recent safety data
Road crashes in 2015 – provisional data
In 2015, 4 859 died in a traffic crash, i.e., 21 more than in 2014. This is the first increase following 15 consecutive years during which the number of fatalities decreased.
Road crashes in 2014
In 2014, there were 4 838 road fatalities on Japanese roads. Fatalities decreased by 6.1% and injury crashes decreased by 8.8% in comparison to 2013. In 2014 Japan reached its lowest fatality and injury crash level since record-keeping began. The reduction rates were highest among cyclists, mopeds, and 0-5 year old groups.
Trends in traffic and road safety (1990-2015)
Traffic
Since 1990, the vehicle fleet has increased by 20% and the distance travelled has increased by 24%. After reaching a peak of more than 91 million vehicles in 2007, the number of registered vehicles decreased until 2012, and then increased again slightly in recent years.
Road safety
Crashes and casualties
Between 1990 and 2014, the number of fatalities decreased by 67%; however the number of injury crashes decreased only slightly (11%). This discrepancy is due to the important increase in the number of vehicles and the number of licensed drivers, which has led to more crashes but, fortunately, not to more fatal crashes.
Traffic deaths peaked in the late 1960s. Since then, fatalities have decreased, albeit with some fluctuations over the years. Since 2000, the number of road fatalities has decreased every year.
The improved safety record in the past decade is related to a significant increase in the seat belt wearing rate, reduction in speed and safer behaviour of pedestrians.
Rates
Since 1990, the death rate per 100 000 inhabitants has decreased by 68%, reaching 3.8 in 2014.
| 2014 % change from | |||||||||
|---|---|---|---|---|---|---|---|---|---|
| 1990 | 2000 | 2010 | 2013 | 2014 | 2013 | 2010 | 2000 | 1990 | |
| Reported safety data | |||||||||
| Fatalities | 14 595 | 10 410 | 5 828 | 5 165 | 4 838 | -6.3 | -17.0 | -53.5 | -66.9 |
| Injury crashes | 643 097 | 931 950 | 725 924 | 629 033 | 573 842 | -8.8 | -21.0 | -38.4 | -10.8 |
| Deaths per 100 000 inhabitants | 11.8 | 8.2 | 4.6 | 4.1 | 3.8 | -6.2 | -16.4 | -53.6 | -67.8 |
| Deaths per 10 000 registered vehicles | 1.9 | 1.2 | 0.6 | 0.6 | 0.5 | -6.7 | -17.4 | -54.7 | -72.3 |
| Deaths per billion vehicle kilometres | 23.2 | 13.4 | 8.0 | 6.9 | 6.2 | -10.2 | -22.5 | -53.7 | -73.2 |
| Traffic data | |||||||||
| Registered vehicles1 (thousands) | 75 960 | 88 602 | 90 464 | 90 565 | 90 894 | 0.4 | 0.5 | 2.6 | 19.7 |
| Vehicle kilometres (millions) | 628 581 | 775 723 | 726 256 | 746 177 | 778 335 | 4.3 | 7.2 | 0.3 | 23.8 |
| Registered vehicles per 1 000 inhabitants | 615 | 698 | 706 | 712 | 715 | 0.5 | 1.2 | 2.5 | 16.4 |
Table 21.1. Road safety and traffic data
1 2 http://dx.doi.org/10.1787/888933385522
Road safety by user group
Since 1990, safety improvements have benefited all road users, in particular the motorised groups such as mopeds, motorcyclists, and passenger car occupants, for whom fatalities have been reduced by over 70%. Factors contributing to this reduction are safer vehicles, better emergency medical care, improved road infrastructure and a change in road user behaviour. The improvement was less for vulnerable road users, in particular cyclists and pedestrians.
Pedestrians represent a very high share of total fatalities (36% of all fatalities in 2014) in comparison with other OECD countries. The high proportion of pedestrian fatalities is partly explained by the fact that only about 40% of the group 65 years of age and older have a driving licence. About half of the road users killed in this group were pedestrians.
In 2014, cyclists represented 15% of total fatalities. This share could rise, given the increasing popularity of cycling. Improving the safety of cyclists has become a priority.
1. Registered vehicles including mopeds.
40 60 80 100 120 140 160 1990 1991 1992 1993 1994 1995 1996 1997 1998 1999 2000 2001 2002 2003 2004 2005 2006 2007 2008 2009 2010 2011 2012 2013 2014 2015 Fatalities Injury crashes Motor vehicles Veh-km GDP
Figure 21.1. Road safety, traffic and GDP trends index 1990 = 100
Source: World Bank for Gross Domestic Product (GDP; constant prices).
Table 21.2. Road fatalities by road user group
| 2014 % change from | |||||||||
|---|---|---|---|---|---|---|---|---|---|
| 1990 | 2000 | 2010 | 2013 | 2014 | 2013 | 2010 | 2000 | 1990 | |
| Cyclists | 1 509 | 1 278 | 938 | 813 | 738 | -9.2 | -21.3 | -42.3 | -51.1 |
| Moped users | 1 320 | 944 | 459 | 357 | 321 | -10.1 | -30.1 | -66.0 | -75.7 |
| Motorcyclists | 1 920 | 903 | 570 | 503 | 489 | -2.8 | -14.2 | -45.8 | -74.5 |
| Passenger car occupants | 3 887 | 2 903 | 1 201 | 1 086 | 1 053 | -3.0 | -12.3 | -63.7 | -72.9 |
| Pedestrians | 3 955 | 2 955 | 2 016 | 1 871 | 1 753 | -6.3 | -13.0 | -40.7 | -55.7 |
| Others | 2 005 | 1 427 | 644 | 535 | 484 | -9.5 | -24.8 | -66.1 | -75.9 |
| Total | 14 595 | 10 410 | 5 828 | 5 165 | 4 838 | -6.3 | -17.0 | -53.5 | -66.9 |
Figure 21.2. Road fatalities by road user group in percentage of total 2014
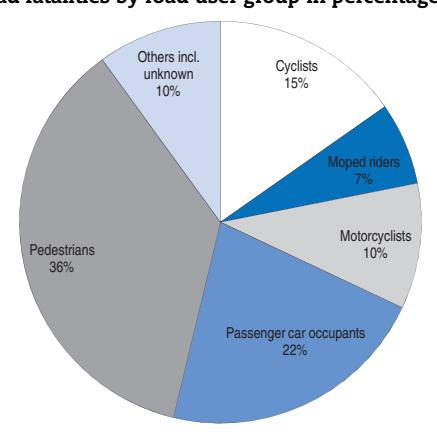
Road safety by age group
Since 1990, impressive reductions in fatalities have benefited all age groups, except for the over 65 group which has seen only a modest reduction. In 2014, this group accounted for more than half (54%) of total fatalities.
The oldest age group is also the one most at risk in traffic, with a fatality rate more than twice that of the average population (8.0 deaths per 100 000 habitants for 65+ group compared to 3.8 deaths per 100 000 habitants for all groups combined in 2014). Young people (18-20 year old group) have a slightly higher risk (4.7 deaths per 100 000 habitants in 2014) than the general population, but the difference is much smaller.
The national goal of making Japan's roads the "safest in the world" can only be realised if greater effort is made to improve the safety of senior citizens. The government is implementing a wide range of measures targeting the elderly population.
| 2014 % change from | |||||||||
|---|---|---|---|---|---|---|---|---|---|
| Age | 1990 | 2000 | 2010 | 2013 | 2014 | 2013 | 2010 | 2000 | 1990 |
| 0-5 | 312 | 88 | 45 | 40 | 29 | -27.5 | -35.6 | -67.0 | -90.7 |
| 6-9 | 198 | 76 | 42 | 41 | 37 | -9.8 | -11.9 | -51.3 | -81.3 |
| 10-14 | 143 | 75 | 37 | 21 | 31 | 47.6 | -16.2 | -58.7 | -78.3 |
| 15-17 | 1 006 | 327 | 124 | 95 | 83 | -12.6 | -33.1 | -74.6 | -91.7 |
| 18-20 | 1 820 | 690 | 221 | 171 | 172 | 0.6 | -22.2 | -75.1 | -90.5 |
| 21-24 | 1 381 | 772 | 226 | 180 | 146 | -18.9 | -35.4 | -81.1 | -89.4 |
| 25-64 | 6 261 | 4 641 | 2 123 | 1 842 | 1 705 | -7.4 | -19.7 | -63.3 | -72.8 |
| 65 | 3 475 | 3 741 | 3 010 | 2 775 | 2 635 | -5.0 | -12.5 | -29.6 | -24.2 |
| Total | 14 595 | 10 410 | 5 828 | 5 165 | 4 838 | -6.3 | -17.0 | -53.5 | -66.9 |
Table 21.3. Road fatalities by age group

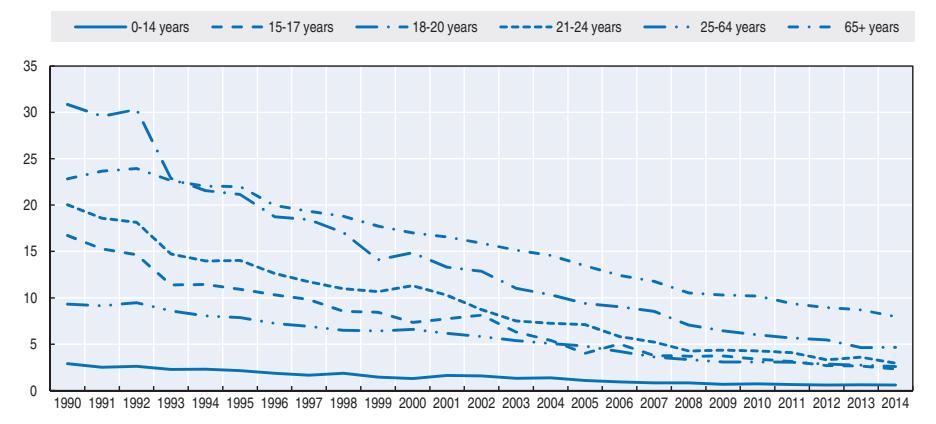
ROAD SAFETY ANNUAL REPORT 2016 © OECD/ITF 2016 291
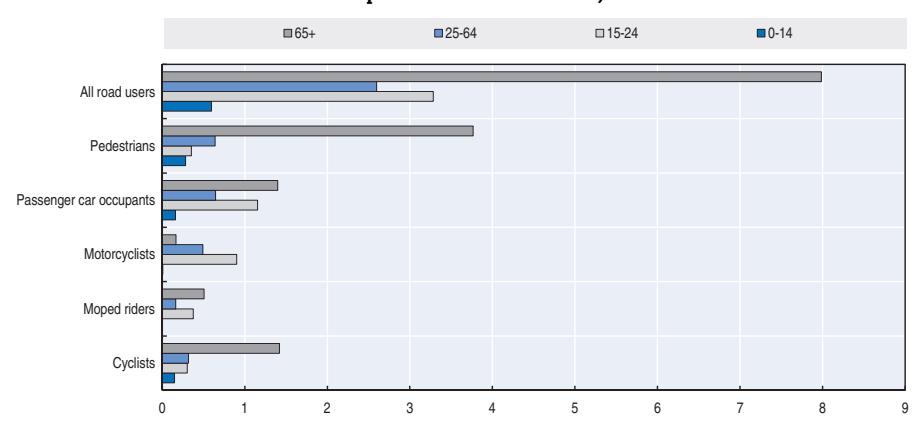
Figure 21.4. Road fatality rate by age and road user group Fatalities per 100 000 inhabitants, 2014
Road safety by road type
Since 1990 fatalities have decreased by 72% on rural roads, 61% inside urban areas, and 67% on motorways. In general, the rate of reduction in urban areas has been slower than other road types. In 2014, fatalities inside urban areas accounted for more than half (56%) of total fatalities.
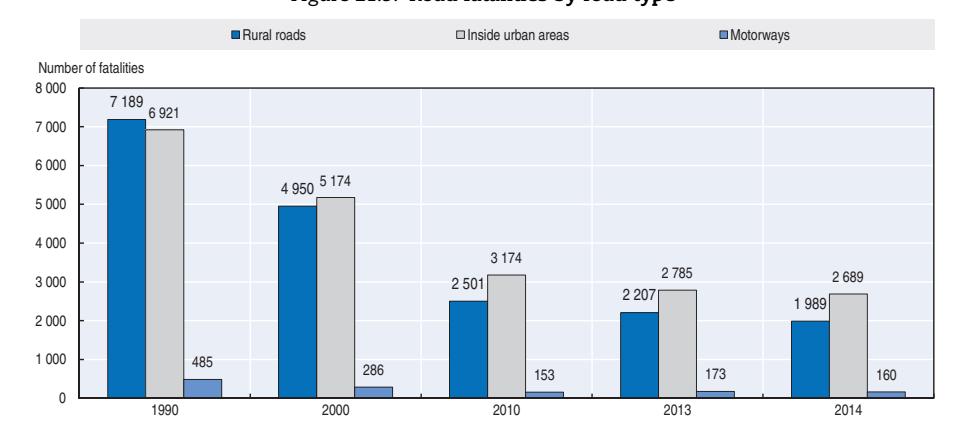
Figure 21.5. Road fatalities by road type
Economic costs of traffic crashes
Currently, there is no estimation of the economic cost of traffic crashes.
Recent trends in road user behaviour
Speed
The table below summarises the main speed limits in Japan.
Table 21.4. Passenger car speed limits by road type, 2016
| General speed limit | |
|---|---|
| Urban roads | 40, 50, 60 km/h |
| Rural roads | 50, 60 km/h |
| Motorways | 100 km/h |
Drink driving
In 2002, the maximum authorised blood alcohol content (BAC) level was lowered from 0.5 g/l to 0.3 g/l.
In 2014, 7.2% of crashes were due to a driver under the influence of alcohol. The share of alcohol related crashes has decreased in recent years, due to more severe sanctions and more frequent control.
Seat belts and helmets
Seat belt wearing has been compulsory in front seats since 1985 and in rear seats since 2008. Children below six years old must be seated in a dedicated child restraint system.
All riders of motorised two-wheelers are required to wear helmets. There is no mandatory helmet use law for cyclists.
Table 21.5. Seat belt wearing rate by car occupancy and road type
| % | ||||
|---|---|---|---|---|
| 2002 | 2010 | 2014 | 2015 | |
| Front seat | ||||
| Driver | 88 | 97 | 98 | 98.4 |
| Passenger | 75 | 92 | 94 | 94.6 |
| Motorways (driver) | 97 | 99 | 99.5 | 99.4 |
| Rear seats | ||||
| General | 7 | 33 | 35 | 35.1 |
| Children (use of child restraint) | 52 | 57 | 62 | 62.7 |
National road safety strategies and targets
Organisation of road safety
From the first half of the 1950s to around 1970, Japan suffered from a significant increase in the number of road traffic crash casualties. As a result, traffic safety emerged as an important social issue. In June 1970, the government of Japan enacted the Traffic Safety Policies Act, with the aim of promoting traffic safety measures nationwide in a systematic manner. Under this act, the government has been working together with local governments and relevant private organisations to vigorously implement traffic safety measures.
The government has prepared a National Traffic Safety Programme every five years, starting in 1971.
Road safety strategy for 2011-20
The 10th Traffic Safety Programme was launched in March 2016 and covers the period 2016-20. It is based on two strategic objectives and eight pillars. The two strategic objectives are:
- Reducing the consequences of crashes, and in particular:
- ❖ for the elderly and children
- ❖ for pedestrians and cyclists
- ❖ on local roads and on main roads.
- Crash prevention, through :
- ❖ The use of new technologies
- ❖ In-depth analysis of traffic and crash data
- ❖ The involvement of the community
The eight pillars are:
- the maintenance of the road environment
- dissemination and reinforcement of traffic safety messages
- safe driving
- vehicle safety
- enforcement
- an improved rescue and emergency medical system
- victim support, including an appropriate damage compensation system
- research and development
Road safety targets
The plan includes the 2020 target of fewer than 2 500 deaths within 24 hours of a crash (equivalent to 3 000 deaths within 30 days) and fewer than 500 000 casualties. The plan also includes the target for 2015 of fewer than 3 000 deaths within 24 hours of a crash (equivalent to 3 450 deaths within 30 days) and fewer than 700 000 casualties.
The vision is to make Japan the safest country for road traffic.
Monitoring targets
The previous plan included the target for 2015 of fewer than 3 450 deaths (within 30 days). However, this target was not reached with a total of 4 859 fatalities recorded for 2015.
Recent safety measures (2013-16)
Road users
- About 20% of all traffic crashes involve a bicycle. Police are reinforcing guidance and regulations for cyclists and raising awareness of rules, such as the fact that cyclists should ride on the streets.
- Improving the safety of the elderly is a key priority for the Japanese government. Police are co-operating with the relevant agencies and organisations to implement measures such as offering individual guidance during home visits and offering traffic safety education at such facilities as hospitals and care centres for elderly persons.
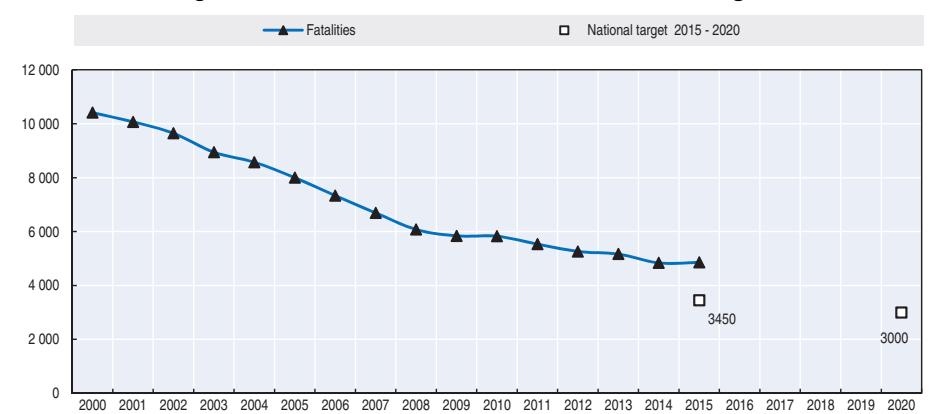
Figure 21.6. Trends in road fatalities towards national target
References
Websites
- National Police Agency: www.npa.go.jp.
- Institute for Traffic Accident Research and Analysis (ITARDA): www.itarda.or.jp.
- National Research Institute of Police Science (NRIPS): www.npa.go.jp/nrips/en/index.html.
Chapter 22
Korea
This chapter presents 2014 road safety data for Korea along with provisional data from 2015. It looks at trends in traffic and road safety from the years 1990 to 2014 and road user behaviour patterns. This includes data on speed, drink driving, drugs and driving, distracted driving, fatigue and seat belt usage. The chapter reviews Korea's road safety strategy and current national targets along with details of recently implemented safety measures and current research initiatives.*
* All data stem from the The Korea Road Traffic Authority (KoROAD) and IRTAD unless otherwise noted. For more information please contact: dragonhwang@koroad.or.kr.
In 2015, provisional data show that there were 4 621 road fatalities in Korea, representing a decrease of 3% when compared to 2014. This reinforces the ongoing positive trend and for the first time deaths per 10 000 registered vehicles are expected to fall below 2.0. In Korea, 40% of all road deaths are pedestrians, a much higher share compared to other countries in the Organisation for Economic Co-operation and Development (OECD). The safety of vulnerable users is a growing concern and is now the focus of the current road safety measures being implemented. Korea's current road safety plan has as its target the reduction of the number of road fatalities to less than 4 000 by 2017.
Road safety data collection
Definitions applied in Korea
- Road fatality: Any person killed immediately or dying within 30 days as a result of a road crash.
- Person seriously injured: Any injured person requiring medical treatment for more than three weeks.
- Person slightly injured: Any injured person requiring medical treatment for less than three weeks.
Data collection
Any road crash resulting in at least one person killed or injured must be reported to the police. The police investigate the crash, fill out a form and enter the information in the police Traffic Accident Management System database. The police refer to the medical diagnosis to classify the injuries by severity.
To complete police reported crash data, the Korea Road Traffic Authority (KoROAD) has developed an integrated road crash database, the Traffic Accident Analysis System (TAAS). This contains not only police data, but also inputs from car insurance companies and mutual aid associations. The TAAS data are collected regularly from these sources, and are refined to eliminate duplicated information.
Most recent safety data
Road crashes in 2015 – provisional data
Based on provisional data, in 2015 there were 4 621 road fatalities, representing a decrease of 3% when compared to 2014. However, the number of police reported injury crashes and injured persons increased by 3.8%
Road crashes in 2014
In 2014, there were 4 762 road deaths in Korea, a 6.5% decrease when compared to 2013. The number of police reported injury crashes increased by 3.8%.
The decrease in fatalities benefited mainly children (below 14 years old) for whom the number of road deaths decreased by 34.3%
Trends in traffic and road safety (1990-2014)
Traffic
Since 1990, Korea has had a very rapid increase in motorisation. Between 1990 and 2014, the number of motorised vehicles was multiplied by more than four. Since 2000, the increase has been more moderate. In 2013, about 200 000 mopeds ware registered due to moped registration becoming mandatory.
Road safety
Crashes and casualties
Fatalities peaked in 1991 at 13 429. Since then, road deaths have decreased (with some fluctuations) and were halved by 2004. In 2013, for the first time in 37 years the number of road deaths was below 5 000, and the decrease continued in 2014. Between 1990 and 2014, the number of road fatalities decreased by 66%, while the number of injury crashes decreased by only 12%.
This important decrease is due in part to the following measures:
- the compulsory wearing of front seat belts (1990)
- drink driving enforcement (1998)
- installation of median barriers on national roads
- speed enforcement by the police, including automatic speed camera enforcement since 2008
- lower speed limits on urban roads in residential areas (ongoing pilot project since 2014).
However, Korea still faces a number of challenges and has fatality rates above the average for countries in the Organisation for Economic Co-operation and Development (OECD). Reasons for the elevated levels of deaths and serious injuries on the roads include high alcohol consumption, wide junctions, lack of pavements on rural roads, high speed limits on urban roads (usually 60 km/h and sometimes 80 km/h), a lack of road safety education in high schools and the low priority of road safety by local government. Also, Korea's elderly population (above 65) has a very high risk in traffic when compared to other OECD countries. This is a serious concern as the share of the senior population is increasing steadily.
Rates
From 1990 to 2014, the road death rate per 100 000 inhabitants decreased by 71% to 9.4, and the death rate per 10 000 registered vehicles decreased by 93% to 2.1. During the same period the number of vehicles per 1 000 inhabitants, which is representative of the national level of motorisation, has multiplied by more than four.
Road safety by user group
Since 1990, all user groups have benefited from improvements in road safety. The highest fatality decreases were observed for pedestrians (-73%) and motorcyclists (-66%).
Between 2000 and 2014, the number of road deaths decreased among all user groups. The greatest decrease was observed for car occupants (-64%) and motorcycle riders (-54%). The decrease in cyclist fatalities was more moderate (-14%).
In 2014, pedestrians counted for 40% of all fatalities, which is very high when compared to the average for OECD countries of 19.8% (2013 data).
Table 22.1. Road safety and traffic data
| 2014 % change from | |||||||||
|---|---|---|---|---|---|---|---|---|---|
| 1990 | 2000 | 2010 | 2013 | 2014 | 2013 | 2010 | 2000 | 1990 | |
| Reported safety data | |||||||||
| Fatalities | 14 174 | 10 236 | 5 505 | 5 092 | 4 762 | -6.5 | -13.5 | -53.5 | -66.4 |
| Injury crashes | 255 303 | 290 481 | 226 878 | 215 354 | 223 552 | 3.8 | -1.5 | -23.0 | -12.4 |
| Deaths per 100 000 inhabitants | 33.1 | 21.8 | 11.3 | 10.1 | 9.4 | -6.9 | -16.2 | -56.6 | -71.4 |
| Deaths per 10 000 registered vehicles | 28.9 | 6.9 | 2.6 | 2.3 | 2.1 | -9.5 | -22.2 | -70.0 | -92.9 |
| Traffic data | |||||||||
| Registered vehicles1 (thousands) |
4 897 | 14 928 | 20 832 | 22 401 | 22 949 | 2.4 | 10.2 | 53.7 | 368.6 |
| Vehicle kilometres (millions) | 206 985 | 295 055 | 296 040 | 306 277 | 3.5 | 3.8 | 48.0 | ||
| Registered vehicles per 1 000 inhabitants | 114 | 318 | 426 | 446 | 459 | 2.9 | 7.7 | 44.6 | 301.9 |
1. Excluding mopeds.
1 2 http://dx.doi.org/10.1787/888933385534
Figure 22.1. Road Safety, Traffic and GDP Trends index 1990 = 100
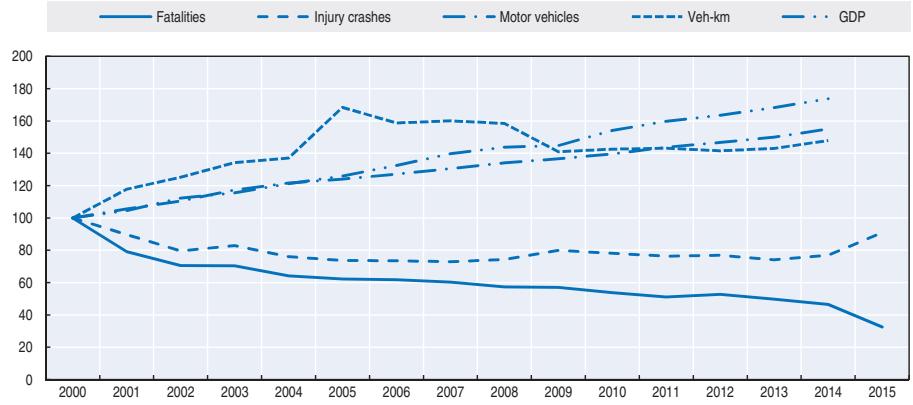
Source: World Bank for gross domestic product (GDP; constant prices).
Table 22.2. Road fatalities by road user group
| 2014 % change from | |||||||||
|---|---|---|---|---|---|---|---|---|---|
| 1990 | 2000 | 2010 | 2013 | 2014 | 2013 | 2010 | 2000 | 1990 | |
| Cyclists | 644 | 317 | 294 | 281 | 272 | -3.2 | -7.5 | -14.2 | -57.8 |
| Moped users | 343 | 450 | 289 | 326 | 12.8 | -27.6 | -5.0 | - | |
| Motorcyclists | 1 674 | 1 221 | 633 | 541 | 562 | 3.9 | -11.2 | -54.0 | -66.4 |
| Passenger car occupants | 2 100 | 2 792 | 1 228 | 1 195 | 998 | -16.5 | -18.7 | -64.3 | -52.5 |
| Pedestrians | 7 063 | 3 764 | 2 082 | 1 982 | 1 910 | -3.6 | -8.3 | -49.3 | -73.0 |
| Others | 2 692 | 1 799 | 818 | 804 | 694 | -13.7 | -15.2 | -61.4 | -74.2 |
| Total | 14 174 | 10 236 | 5 505 | 5 092 | 4 762 | -6.5 | -13.5 | -53.5 | -66.4 |
Road safety by age group
Since 2000, the reduction in road fatalities has benefited all age groups. The most impressive reduction concerned the youngest group (0-14), for which fatalities decreased by 89%, from 588 in 2000 to 65 in 2014. However, the number of road fatalities among the
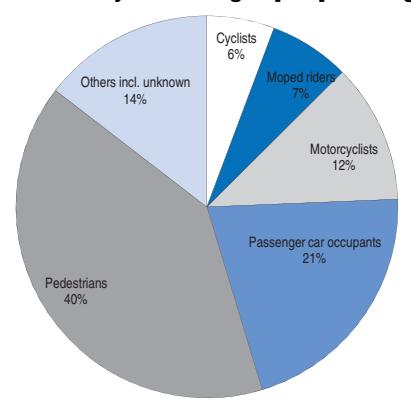
Figure 22.2. Road fatalities by road user group in percentage of total 2014
oldest group (65+) hardly decreased (-2.1%). This age group represents 38% of all fatalities and has a much higher risk than the general population, with more than 28 deaths for 100 000 inhabitants, over twice the risk of the average population. The elderly are particularly vulnerable as pedestrians, and represent nearly half of all pedestrian fatalities.
| 2014 % change over | |||||||
|---|---|---|---|---|---|---|---|
| Age | 2000 2010 |
2013 2014 |
2013 | 2010 | 2000 | ||
| 0-5 | 275 | 49 | 38 | 26 | -31.6 | -46.9 | -90.5 |
| 6-9 | 202 | 49 | 33 | 18 | -45.5 | -63.3 | -91.1 |
| 10-14 | 111 | 62 | 28 | 21 | -25.0 | -66.1 | -81.1 |
| 15-17 | 263 | 139 | 87 | 104 | 19.5 | -25.2 | -60.5 |
| 18-20 | 459 | 149 | 119 | 109 | -8.4 | -26.8 | -76.3 |
| 21-24 | 573 | 236 | 191 | 143 | -25.1 | -39.4 | -75.0 |
| 25-64 | 6 474 | 3 068 | 2 763 | 2 526 | -8.6 | -17.7 | -61.0 |
| > 65 | 1 853 | 1 752 | 1 833 | 1 815 | -1.0 | 3.6 | -2.1 |
| Total incl. unknown | 10 236 | 5 505 | 5 092 | 4 762 | -6.5 | -13.5 | -53.5 |
Table 22.3. Road fatalities by age group
Road safety by road type
In 2014, the number of fatalities was shared equally between urban and non-urban areas, with 46% of fatalities on rural roads, 51% on urban roads and about 3% on motorways. Since 2000, the greatest reduction has been achieved on motorways (-80%). The good performance on motorways is explained by stronger police enforcement, treatment of black spots, construction of rumble strips, prevention campaigns on fatigue and the installation of 172 new rest areas for drowsy drivers between 2011 and 2014.
Economic costs of traffic crashes
Since 1992, KoROAD calculates the economic cost of road crashes using the Gross Loss of Output Approach on an annual basis. The most recently published estimation of road crash cost is based on 2014 crash data (KoROAD, 2014).
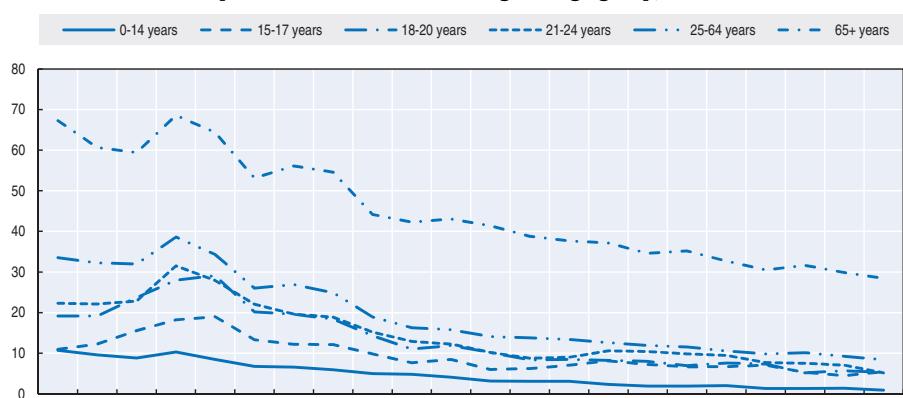
Figure 22.3. Road fatality rates by age group Deaths per 100 000 inhabitants in a given age group, 1990-2014
Figure 22.4. Road fatality rate by age and road user group Fatalities per 100 000 inhabitants, 2014
1993 1994 1995 1996 1997 1998 1999 2000 2001 2002 2003 2004 2005 2006 2007 2008 2009 2010 2011 2012 2013 2014
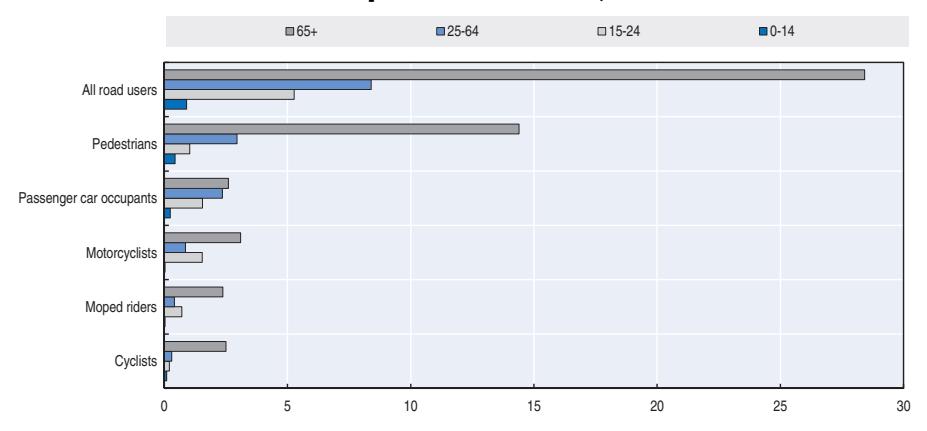
The cost of crashes is calculated taking into account the direct costs such as vehicle damage, hospital and administration costs as well as the costs of future lost output. The calculation includes the following elements:
- Direct costs
- ❖ property damaged, costs for repairs and replacement of infrastructure components and vehicle parts
- ❖ medical or funeral costs for casualties
- ❖ compensation for casualties from insurance companies.
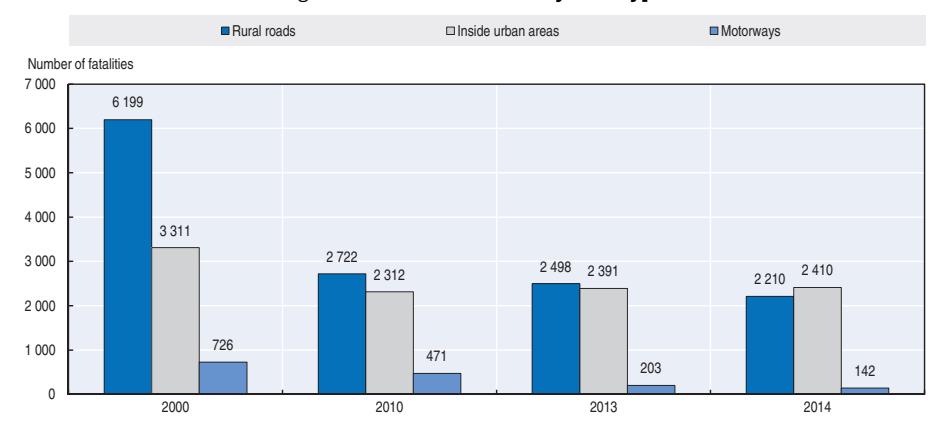
Figure 22.5. Road fatalities by road type
- Indirect costs
- ❖ administration costs for police and insurance companies
- ❖ ambulance costs.
- Lost output of casualties
Traffic crashes represent a significant cost for society, estimated in 2014 at around USD 25.2 billion for all police-reported road casualties, or about 1.7% of Korea's GDP. The costs are based on police crash data and information from insurance companies. These costs do not take into account the cost of suffering and pain.
Table 22.4. Costs of road crashes, 2014
| Total | |
|---|---|
| Casualties costs | KRW 15 675 billion |
| Administration costs | KRW 1 259 billion |
| Property//damage costs | KRW 9 638 billion |
| Total | KRW 26 573 billion (approx. USD 25.23 billion) |
| Total as % of GDP | 1.71% |
Source: KoROAD (2014).
The next table shows the unit cost of road crash and casualty by severity.
Table 22.5. Unit cost of road crashes and casualties
| Costs | 2012 |
|---|---|
| Fatalities | KRW 429 084 900 Approx. USD 410 000 |
| Serious injuries | KRW 52 930 200 Approx. USD 50 000 |
| Slight injuries | KRW 3 397 500 Approx. USD 3 200 |
| Injuries less than 3 days | KRW 1 674 300 Approx. USD 1 600 |
Source: KoROAD (2014).
Recent trends in road user behaviour
Speed
The table below summarises the main speed limits in Korea. In 2012, the speed limit in urban areas was reduced from 80 km/h to 60 km/h for two-lane roads. In 2015, as part of a pilot project, the speed limit was lowered from 60km/h to 50km/h or 40 km/h around 118 residential and shopping areas. In these areas, the number of casualties decreased by 27%. In 2016, it is planned to lower the speed limit in additional 2 000 areas.
Table 22.6. Passenger car speed limits by road type, 2016
| General speed limit | |
|---|---|
| Urban roads | 60 km/h Pilot project underway with 50 and 40 km/h in 118 residential and shopping areas |
| Rural roads | One-lane roads: 60 km/h Two or more lane roads: 80 km/h |
| Motorways | Urban areas: 100 km/h Outside urban areas: 110 km/h |
Drink driving
The maximum authorised blood alcohol content (BAC) is 0.5 g/l. In 2014, the number of alcohol-related crashes decreased by 9.6% in comparison with 2013, and the number of fatalities due to alcohol-related crashes decreased by 18.6%.
Distraction
Since 2008, the use of hand-held mobile phones is not permitted while driving. It is however a behaviour difficult to enforce, as it is strongly depend on the driver's statement.
Sleepiness and fatigue
In 2014, 130 fatalities and 2 426 crashes were reported to be due to drowsy drives. To prevent driver fatigue and sleepiness, the Korea Expressway Corporation installed more than 200 rest areas on the motorway network. It is planned to install 270 additional rest areas in 2017.
Seat belts and helmets
Seat belt use in front seats has been compulsory since 1990 on all roads. The use of rear seat belts on motorways was made compulsory in 2008, but it is not compulsory on other roads.
The nationwide 2014 observation survey showed that 89% of drivers, 75% of front passengers and 22% of rear seat passengers wear seat belts on motorways.
All riders of powered two-wheelers are required to wear helmets. In 2014, overall helmet use increased from 74% to 78%. The wearing rate varies markedly between cities. There is no mandatory helmet use law for cyclists.
Table 22.7. Seat belt wearing rate by car occupancy and road type
| % | |||
|---|---|---|---|
| 2010 | 2013 | 2014 | |
| Front seat | |||
| Driver (motorway) | 88.5 | 86.7 | 89.1 |
| Passenger (motorway) | 78.2 | 79.1 | 74.6 |
| Rear seats | |||
| General (motorway) | 6.3 | 9.4 | 21.8 |
National road safety strategies and targets
Organisation of road safety
In Korea, road safety responsibility is shared among various ministries and agencies.
- The Ministry of Land, Transportation and Infrastructure is responsible for the national trunk road network of motorways and national highways. It also manages vehicle safety and runs the New Car Assessment Program.
- The Ministry of Public Safety and Security oversees road safety particularly for local governments. It contributes to safety strategies for provincial, municipal and county roads.
- The National Police Agency is mainly responsible for traffic enforcement and crash investigation. It also operates traffic signals, crossings and speed enforcement cameras.
- The Korea Transportation Safety Authority is a government agency supporting the Ministry of Land, Transportation and Infrastructure, mainly in charge of vehicle safety.
- KoROAD is a government agency, supporting the National Police Agency, responsible for road traffic management. The agency is in charge of traffic monitoring, drivers' license examinations and management, training and education.
Road safety policy is co-ordinated by the National Transport Safety Committee, an inter-ministerial body. The committee is chaired by the Minister of Land, Transport and Infrastructure. Private professionals can participate in the committee, but in practice the committee does not convene often.
The role of the committee is to review road safety policies and measures implemented by the various agencies; however, it does not have a monitoring function, nor does it have a budget or budget allocation power.
Road safety strategy for 2013-17
In July 2013, the Office for Government Policy Coordination announced a comprehensive plan for reducing traffic crash casualties for the period 2013-17, including five strategic areas, each with a set of targeted measures.
Table 22.8. Strategies and main measures of the national road safety plan
| Strategies | Areas | Actions |
|---|---|---|
| Improvement of road user behaviours |
Better safety for school routes | Walking school bus Registration of school buses Child car seat enforcement |
| Children-oriented road safety education |
Development of education textbooks Increase in road safety classes Promotion of road safety instructors |
Table 22.8. Strategies and main measures of the national road safety plan (cont.)
| Strategies | Areas | Actions |
|---|---|---|
| Better safety for the elderly | Self-diagnosis manual Education programme Provision of older-friendly cars |
|
| Enforcement on drink driving | Reinforcement of BAC level Installation of ignition interlock device Increased penalties for violation |
|
| Improvement in insurance policy |
Premium reduction for cars with safety equipment Differentiation of premiums by regions More responsibility to rental car drivers Distance based insurance |
|
| Working hour limit for commercial vehicle drivers |
Research on working hours per day for various types of drivers Amendment of Labour Act |
|
| More education and promotion | Passing priority at unsignaled junctions More TV advertisements Road safety experience centre |
|
| Provision of safe transport infrastructure |
Safe and comfortable pedestrian space |
Pavements for roads in residential areas More pedestrian priority zones LED lights over pedestrian crossings |
| Special zones for vulnerable road users |
Silver zone increase More safety facilities for disabled people |
|
| Better safety facilities | Installation of signal posts before junctions Safety improvement at entrance to villages |
|
| Area-wide road safety improvement |
Designation of pilot road safety cities | |
| Bicycle safety | Better cycle paths and education | |
| Sharing road safety information | National road safety data sharing system Sharing in-depth crash investment data |
|
| Operation of smart transport system |
Advanced safety assistance equipment |
Introduction of various sensors, alarms, and occupant protection to reduce vehicle to vehicle accidents |
| Safety equipment for commercial vehicles |
More installation of maximum speed limiters and digital tachometers |
|
| Meeting global standards in vehicle safety |
More testing areas in NCAP Life-cycle management for motorbikes Safety standards for "green" cars |
|
| Enforcement of safety management system |
Speed management for people | 60 km/h speed limit for minor arterial roads 30 km/h speed limit in residential areas |
| Scientific investigation of accident causes |
More in-depth investigation on major crashes Introduction of Korea Road Assessment Program |
|
| Safer logistics systems | Information system for hazardous materials movement | |
| Enhancement of emergency response system |
Emergency response by areas | E-call system Emergency routes along congested areas Emergency response by helicopters |
| Weather information system | Provision of weather forecasts along roads |
Source: Korean Transport Research Institute (KOTI).
Road safety targets
Two principal targets have been set for 2017:
- Reducing the rate of fatalities per 10 000 vehicles (including mopeds) below 1.64, which corresponds to a reduction by 30% from 2012, in order to be ranked in the middle range of OECD member countries.
- Reducing the number of road fatalities to less than 4 000.
The plan includes interim targets for each year from 2013 to 2017
A new target for 2021 is under discussion for inclusion in the Eighth National Safety Transport Plan 2017-2021, which will be announced in 2016.
Table 22.9. Specific road safety targets by year
| 2012 | 2013 | 2014 | 2015 | 2016 | 2017 | |
|---|---|---|---|---|---|---|
| Fatality target (actual figure) | - (5 392) | 5 100 (5 092) | 4 900 (4 762) | 4 600 (4 621) | 4 300 | 4 000 |
| Targets expressed in fatalities per 10 000 vehicles (including mopeds) (actual figure) |
- (2.4) | 2.2 (2.2) | 2.1 (2.1) | 1.9 (1.9) | 1.8 | 1.6 |
Monitoring targets
The year 2013 was the first year of implementation of a new set of traffic safety measures. They have not yet yielded the expected decrease in the number of fatalities; nevertheless progress is being made, and the measures implemented are considered to be successful.
The improvement of traffic intersections and the construction of additional roundabouts and rest areas along highways have helped reduce the number of infrastructure related crashes.
Police have increased enforcement through video recording and increased fines on a number of traffic violations, including tailgating, aggressive driving, non-respect of stop lines and stopping at pedestrian crossings. These efforts have contributed to a greater compliance with traffic law.
Safety of vulnerable road users has been addressed through dedicated safety measures for children, the elderly, multi-cultural families and foreigners.
Traffic safety of commercial vehicles has been improved by installing digital tachographs, and a rating programme for buses has been introduced.
4000 4 000 6 000 8 000 10 000 12 000 2000 2001 2002 2003 2004 2005 2006 2007 2008 2009 2010 2011 2012 2013 2014 2015 2016 2017 2018 2019 2020 Fatalities National target 2017
Figure 22.6. Trends in road fatalities towards national target
Recent safety measures (2013-16)
Institutional organisation
● The responsibility for developing road safety measures is being progressively transferred from the National Police Agency to local governments, with the creation of local
- autonomous police agencies. Local governments manage and promote their traffic crash-reducing measures by creating their own police organisations.
- In 2016, the police announced a comprehensive road safety plan for the period 2016-18 focusing on pedestrian safety. The plan includes four strategic themes and 13 actions.
Table 22.10. Strategies and main measures of the pedestrian safety plan 2016-18
| Strategic themes | Actions |
|---|---|
| Improving the traffic safety environment for pedestrians |
Lower speed limits in residential and shopping areas. Implementation of safe pedestrian crossings and safety fences Improvement of the legal system to better protect pedestrians |
| Improving driver behaviour | Enforcing dangerous driving behaviours, in particular those threatening the safe walking of pedestrians. Enforcement of parking and stopping restrictions |
| Encourage good pedestrian safety habits | Promotion of safe walking Reinforcement of traffic safety education for children and elderly people Safety campaigns |
| Cooperation with all stakeholders | Nationwide cooperation system for pedestrian safety Strengthened co-operation between local governments and the police Co-ordinated management system for pedestrian fatalities |
Speed management
● Speed limits have been reduced from 60 km/h to 40 or 50km/h in 118 residential and shopping areas. This will be extended in 2016 to 2 000 areas.
Education and awareness
- A whole set of education initiatives to increase awareness about pedestrian safety will be undertaken within the 2016-18 plan. This will include:
- ❖ inclusion of items on pedestrian safety in the driving licence test
- ❖ traffic safety song contest for children
- ❖ safety education for elderly people living in rural areas.
- ❖ development of a pedestrian safety index for each local government.
Infrastructure
- construction of additional roundabouts (ongoing)
- designation of "silver zones" near facilities for the elderly (ongoing)
- additional designation of Pedestrian Priority Zones (ongoing)
- construction of additional rest areas along highways (ongoing)
- construction of additional pedestrian crossings to limit to less than 200 metres the distance between two crossings (2016)
- installation of safety fences to prevent jaywalking (at 409 spots in 2014 and 250 spots in 2015).
Vehicles
- The installation of standardised digital tachograph devices on trucks was expanded in 2013-14. Tachograph records can be analysed by companies to identify poor drivers.
- Attachment of a safety evaluation label, to provide safety information on manufactured vehicles on a systematic basis, became obligatory by 2014.
● The National Police Agency has access to recordings in black boxes that are currently installed in two million cars. These recordings may be used to reduce dispute about crashes.
Recent and ongoing research
● Revision of the traffic crash form to reflect changes in the traffic environment. This will involve a further elaboration of the list of possible crash contributing factors and a redesign of the traffic crash database.
References
KoROAD (2014), The Estimation and Evaluation of Road Accidents Costs, Road Traffic Authority, Korea.
Websites
- Ministry of Land, Infrastructure and Transport: http://english.molit.go.kr.
- Road Traffic Authority: www.koroad.or.kr.
- Korea Transportation Safety Authority: www.ts2020.kr.
- Korea Transport Institute (KOTI): http://english.koti.re.kr/.
Chapter 23
Lithuania
This chapter presents 2014 road safety data for Lithuania along with provisional data from 2015. It looks at trends in traffic and road safety from the years 1990 to 2014 and road user behaviour patterns. This includes data on speed, drink driving, drugs and driving, distracted driving, fatigue and other factors involved in road crashes. The chapter reviews Lithuania's road safety strategy to 2020 along with the most recently implemented safety measures.*
* All data stem from the Road and Transport Research Institute and IRTAD. For more information please contact m.katkus@ktti.lt.
Lithuania has made good progress in road safety since the year 2000 with a 58% overall reduction in fatalities. Its current goal is to reduce fatalities to a rate of 6 per 100 000 inhabitants by 2017. Fatalities increased by 3.5% in 2014 compared to 2013. Provisional data from 2015 show progress again with a total of 242 killed, a 9.2% decrease over 2014. Pedestrians and car occupants each accounted for 41% of total fatalities.
Road safety data collection
Definitions applied in Lithuania
- Road fatality: Any person killed in a traffic crash within 30 days of the crash (prior to 1995, the limit was 7 days).
- Injured persons: As yet, there is no official definition of slight and serious injuries. The concept of using the Maximum Abbreviated Injury Scale of three or more (MAIS3+) for a serious injury is under discussion. Nevertheless, in 2015 police reported the number of traffic injuries by severity, based on the health sector definitions:
- ❖ Seriously injured: persons suffering a road injury entailing an irreversible mutilation of one part of the body or a loss of more than 30% of working capacity.
- ❖ Lightly injured: persons suffering a road injury for more than 10 days, or a loss of working capacity between 5 and 30%
- ❖ Slightly injured: persons suffering a road injury for less than 10 days or a loss of working capacity inferior to 5%
Data collection
Traffic police collect and manage most crash data in Lithuania. Hospitals and insurance companies also have data on some crashes.
There is no estimate of under-reporting. According to the police, nearly 100% of injury crashes are collected and reported in the police database. The data are available to road safety experts for research. Information about the severity of an injury is defined in only 65 % of injury crashes.
Road safety experts lack information to help identify the causes of crashes. Information on road user behaviour is also limited, and information on injury type is not systematically recorded.
Most recent safety data
Road crashes in 2015 – provisional data
Based on provisional data, there were 242 persons killed in road traffic in 2015, a decrease of 9.7% compared to 2014. Pedestrians and car occupants each accounted for 41% of all fatalities.
Road crashes in 2014
In 2014, 3 355 injury crashes were recorded, in which 267 road users were killed. This corresponds to a 3.5 % increase in fatalities compared to 2013, while the number of road crashes decreased by 4.7%.
Road fatalities increased for all road user groups, except powered two-wheeler riders.
Trends in traffic and road safety (1990-2014)
Traffic
Between 1990 and 2014, the number of passenger cars was multiplied by 3.4 and the number of trucks by 1.7. Unlike most European countries, the motorcycle fleet was more than halved. Before 1990 (when Lithuania was part of the Soviet Union), most people travelled on motorcycles, as for many this was the only affordable mode of individual motorised transport. From 1990 onward, when personal income started to grow, the vehicle market expanded and cars became affordable for many Lithuanian citizens who decided to exchange their motorcycle for a private car. .
A new vehicle registration procedure was introduced in July 2014. Vehicles failing to meet the requirements of compulsory civil liability insurance and/or technical inspection were removed from the register. In practice one-third of the vehicles were removed from the register.
It is therefore not possible to compare the evolution in the vehicle fleet before and after 2014.
Road safety
Crashes and casualties
The number of road fatalities peaked in 1991 with 1 267 road deaths. Since then it has been divided by nearly five, while the number of motor vehicles has gradually increased.
Since 1991, road safety can be analysed for the following periods:
- 1992-96: In 1992, a significant reduction in the number of fatalities was observed, immediately after the fall of the Soviet Union. The following years saw dramatic changes in politics as well as economic austerity. Nevertheless there was a positive impact on road safety, mainly through the introduction of safer European vehicles into the market.
- 1997-2000: A slight increase was seen in the number of traffic fatalities, which reached a new peak in 1998. The number of casualties then dropped over the next two years as a result of an economic crisis in neighbouring Russia.
- 2000-07: The economic situation in Lithuania started to improve and brought a rapid increase in traffic volume, which was accompanied by a yearly increase in road traffic fatalities.
- 2008-14: An important breakthrough was achieved in 2008 with growing awareness among citizens of road safety issues and the leading role of the EU in setting a target to reduce by 50% the number of fatalities between 2001 and 2010, which many countries achieved. In 2010 Lithuania reached the EU road safety target. The economic downturn in 2008-2010 also probably contributed to a reduction in traffic and a decrease in the number of road fatalities.
Rates
The 2014 average death rate of 9.0 per 100 000 inhabitants was less than a third of the 1990 rate, yet it remains much higher than the EU27 average of 5.2 and the target of less than 6 killed per 100 000 inhabitants by 2017.
| 2014 % change from | |||||||||
|---|---|---|---|---|---|---|---|---|---|
| 1990 | 2000 | 2010 | 2013 | 2014 | 2013 | 2010 | 2000 | 1990 | |
| Reported safety data | |||||||||
| Fatalities | 1 081 | 641 | 299 | 258 | 267 | 3,5 | -10,7 | -58,3 | -75,3 |
| Injury crashes | 5 135 | 5 807 | 3 530 | 3 417 | 3 255 | -4,7 | -7,8 | -43,9 | -36,6 |
| Deaths per 100 000 inhabitants | 29.3 | 18.3 | 9.5 | 8.7 | 9.1 | 4,5 | -4,7 | -50,3 | -69,0 |
| Deaths per 10 000 registered vehicles* | 12.7 | 5.0 | 1.4 | 1.1 | 1.8 | Figures not comparable. | |||
| Traffic data | |||||||||
| Registered vehicles (thousands)* | 849 | 1 286 | 2 145 | 2 276 | 1 489* | Figures not comparable due | |||
| Registered vehicles per 1 000 inhabitants* | 230 | 366 | 683 | 766 | 506 | to a new vehicle registration system entered into force in 2014 |
Table 23.1. Road safety and traffic data
1 2 http://dx.doi.org/10.1787/888933385544
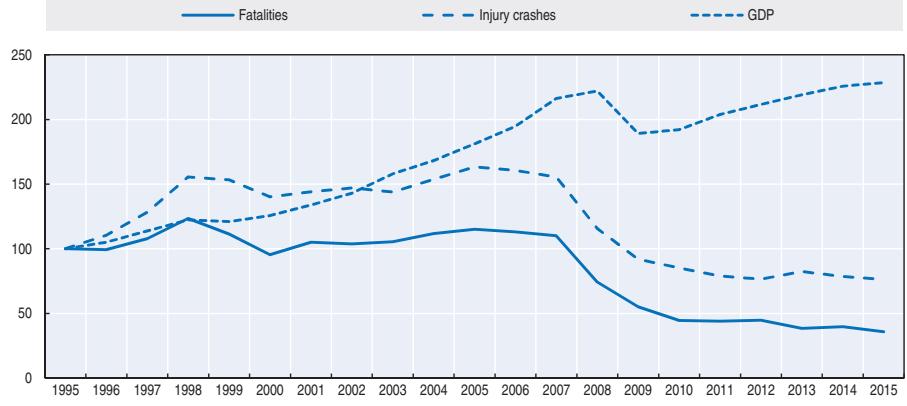
Figure 23.1. Road safety, traffic and GDP trends index 1995 = 100
Source: World Bank for Gross Domestic Product (GDP; constant prices).
Road safety by user group
Car occupants and pedestrians are the main victims of traffic crashes. Pedestrians in particular represent more than 40% of casualties, a high share in comparison with other countries in the International Road Traffic and Accident Database (IRTAD).
Road safety by age group
Young people (18-24) are the age group the most at risk with a fatality rate of 12 fatalities per 100 000 inhabitants. Older people are particularly vulnerable as pedestrians.
* Break in the series due to new vehicle registration procedure as of 2014.
| | | | | 2014 % change from | | | |-------------------------|------|------|------|----------------------------------------------|-------|--| | | 2010 | 2013 | 2014 | 2013 | 2010 | | | Cyclists | 23 | 18 | 19 | 5.6 | -17.4 | | | Moped users | 3 | 4 | 1 | Figures too small for meaningful comparisons | | | | Motorcyclists | 15 | 16 | 11 | -31.1 | -26.7 | | | Passenger car occupants | 130 | 103 | 109 | 5.8 | -16.2 | |
Table 23.2. Road fatalities by road user group

Pedestrians 108 98 109 11.2 0.9 Others 20 19 18 -5.3 -10.0 Total 299 258 267 2.7 -11.4
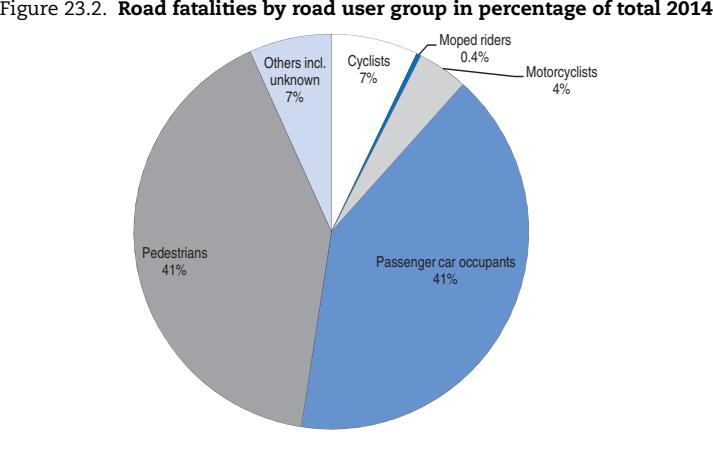
Table 23.3. Road fatalities by age group
| | | | 2014 | 2014 % change from | | | |
|-------|-----|--------------|------|----------------------------------|-------|--|--|
| Age | | 2010
2013 | | 2013 | 2010 | | |
| 0-5 | 1 | 2 | 5 | | | | |
| 6-9 | 2 | 3 | 4 | Figures too small for meaningful | | | |
| 10-14 | 4 | 2 | 8 | comparison | | | |
| 15-17 | 10 | 2 | 11 | | | | |
| 18-20 | 18 | 17 | 15 | -11.8 | -16.7 | | |
| 21-24 | 25 | 22 | 15 | -31.8 | -40.0 | | |
| 25-64 | 172 | 155 | 161 | 3.9 | -6.4 | | |
| 65 | 62 | 54 | 47 | -13.0 | -24.2 | | |
| Total | 299 | 258 | 267 | 3.5 | -10.7 | | |
Road safety by road type
In 2014, most road crashes occurred on rural roads (60% of total). These crashes are also more severe on these roads, as speeds are higher and infrastructure for cyclists and pedestrians less developed.
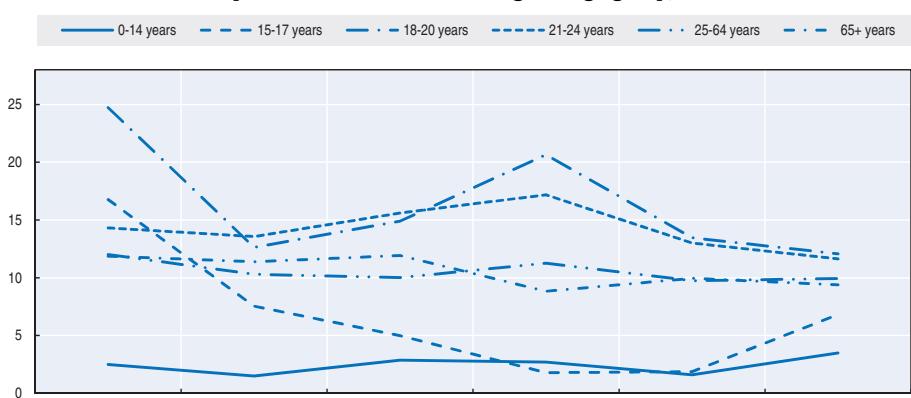
Figure 23.3. Road fatality rates by age group Deaths per 100 000 inhabitants in a given age group, 2009-14
Figure 23.4. Road fatality rate by age and road user group Fatalities per 100 000 inhabitants, 2014
2009 2010 2011 2012 2013 2014
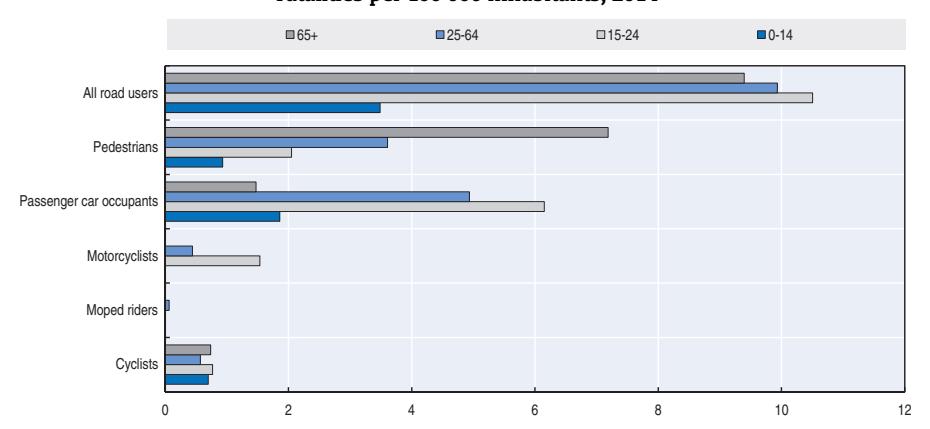
Since 2010, the situation has being improving on rural roads, but there is a lack of progress on urban roads and motorways.
Economic costs of traffic crashes
Traffic crashes represent a significant cost for society, estimated in 2014 at around EUR 365 million, i.e. 1% of GDP. Costs are estimated using a "capital approach" method.
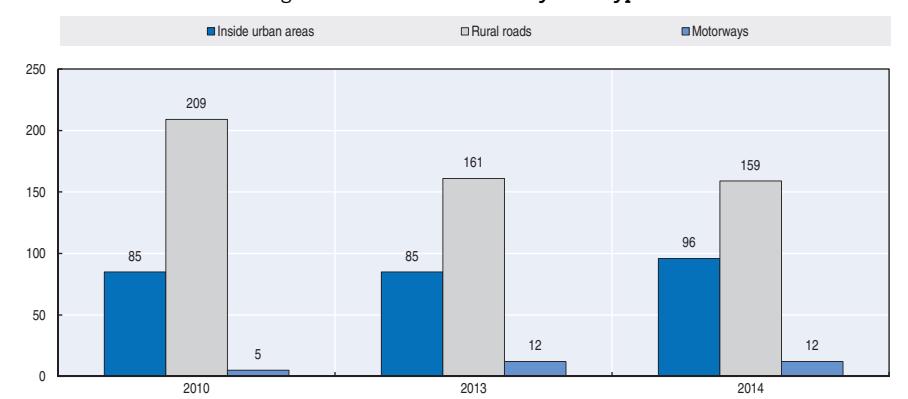
Figure 23.5. Road fatalities by road type
Table 23.4. Costs of road crashes, 2014
| Unit cost | Total | |
|---|---|---|
| Fatalities | EUR 159.4 million | |
| Injured persons | EUR 205.1 million | |
| Property damage costs | Not included | |
| Total | EUR 364.5 million | |
| Total as % of GDP | 1% |
Recent trends in road user behaviour
Speed
According to police data, inappropriate speed is the main cause of traffic crashes in Lithuania. Speeding at 30 km/h above the limit is considered a serious violation, incurring severe sanctions, including immediate licence withdrawal for novice drivers.
Observations in 2013 indicate that 13% to 24% of all drivers exceed the speed limit by more than 10 km/h on different types of state roads. In 2014 research showed that 33% of drivers exceed the speed limit by more than 10 km/h in urban areas. The table below summarises the main speed limits in Lithuania.
Table 23.5. Passenger car speed limits by road type, 2016
| General speed limit | Comments | |
|---|---|---|
| Urban roads | 50 km/h | - |
| Rural roads | 90 km/h (70 km/h on gravel roads) | 70 km/h for novice drivers (driving experience of less than 24 months) |
| Motorways | 120 or 130 km/h (110 km/h in winter) | 90 km/h for novice drivers |
Drink driving
The general maximum authorised blood alcohol content (BAC) in Lithuania is 0.4 g/l and since 1 May 2015, 0.0 g/l for novice drivers (less than 24 months driving experience), professional drivers, moped and motorcycle drivers.
Drivers that tested positive for being under the influence of alcohol have their licence withdrawn for 12-36 months and are fined EUR 150-900. The most dangerous violations (and repeat drink-driving offences) can be punished by an administrative arrest for 10-30 days. In 2014, drink driving contributed to 9% of road crashes.
Between 2004 and 2014, the number of alcohol related crashes was halved. However, the share of crashes due to drink driving has remained stable at about 10%.
Important legislation changes entered into force in 2016. Since 1 January 2016, it is forbidden to sell alcohol in petrol stations. Since 1 April 2016, driving with a BAC of 1.5 g/l and above is considered as a crime and subject to a sanction of up to one year imprisonment.
Drugs and driving
Drivers that test positive for driving under the influence of drugs are subject to a fine of EUR 300-900 and licence withdrawal of 12-36 months. They can also be subject to 10-30 days administrative arrest.
In 2014, it was reported that none of injury road crashes involved drivers under the influence of drugs.
Distraction
It is not permitted to drive using a hand-held mobile phone. Hands-free mobile phones may be operated. There is no estimate of the number of fatal crashes due to the use of mobile phones.
Seat belts and helmets
Seat belt wearing is compulsory in all seats. Children below 135 cm in height must use dedicated child restraints.
According to police data, in 2013, 45% of killed car occupants and 30% of killed drivers were not wearing a seat belt when the crash occurred.
Based on a 2014 survey on seatbelt wearing rate on main roads, 97 % of car drivers and 95% of front seat passengers were wearing a seatbelt, while only 33% of rear seat passengers did so.
| % | |
|---|---|
| 2014 | |
| Front seat | |
| General (driver + passengers) | 96* |
| Driver | 97* |
| Passenger | 95* |
| Rear seats | |
| General | 33* |
Table 23.6. Seat belt wearing rate by car occupancy and road type
All riders of powered two-wheelers are required to wear a helmet. Cyclists under 18 years old must wear a helmet.
* Seatbelt wearing rate on main roads.
National road safety strategies and targets
Organisation of road safety
The main stakeholder is the Ministry of Transport and Communications of the Republic of Lithuania, supported by the Lithuanian Road Administration. Police and municipalities are also agencies responsible for road safety.
Nominated by the government, the State Traffic Safety Commission comprises representatives of state and municipal administration bodies and NGOs. The commission makes recommendations on road safety policy.
Road safety strategy for 2011-2017
Following the encouraging results in the past decade, Lithuania has developed a new National Traffic Safety Development Programme for 2011-17, based on the long-term vision that no one should be killed or seriously injured on Lithuanian roads.
Road safety targets
The main goal is to reach a mortality rate of fewer than six killed per 100 000 inhabitants (or 60 per million inhabitants), in order to be ranked among the best performing countries in the European Union. To achieve this objective, it is planned to improve:
- road user behaviour
- vehicle safety
- infrastructure
- the rescue service quality
- the crash data collection system.
Monitoring targets
Lithuania successfully achieved the target set in the EU White Paper of reducing the number of traffic deaths by 50% in the period 2001-10. The number of fatalities was reduced by 58%, from 706 to 299.
The figure below illustrates the trends towards the EU target to halve the number of road fatalities between 2010 and 2020. In addition, a national target has been set to reach a fatality rate of fewer than six fatalities per 100 000 inhabitants by the year 2017
The National Traffic Safety Development Programme also included a midterm goal of less than 7.2 deaths per 100 000 population in 2014. In 2014, the rate was 9.1 deaths per 100 000 inhabitants, well above the target.
Recent safety measures (2013-16)
Road safety management
Recent road safety management measures focused on the following areas:
- implementation of the EU Directive 2008/96/EC on road infrastructure safety management
- implementation of road network safety management (high risk site ranking, black spot management); road safety inspections; road safety audits and road safety impact assessment.
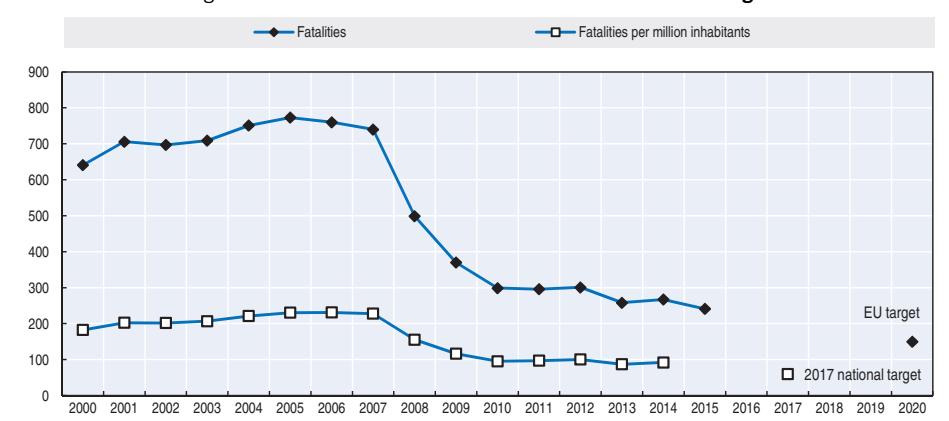
Figure 23.6. Trends in road fatalities towards national target
Road users
Drink driving
- Since 1 January 2016, it is forbidden to sell alcohol in petrol stations.
- Since 1 April 2016, driving with a BAC of 1.5 g/l and above is considered as a criminal offence and is subject to a sanction of up to one year's imprisonment.
Cyclist safety
● Since 2014, cyclists are required to wear a bright coloured and reflective vest during the day (it was already compulsory at night), or alternatively to ride with lights on.
Infrastructure
● In 2014, a national method to manage city black spots was approved and a pilot project was implemented for the five largest cities.
Vehicles
- In 2014, registration of modified right-hand drive vehicles has been forbidden.
- Since 2014, "End of life" vehicles cannot be registered and are not allowed to circulate.
References
Websites
- Ministry of Transport and Communications of the Republic of Lithuania: http://sumin.lrv.lt/.
- Road and Transport Research Institute: www.ktti.lt.
- Lithuanian Road Administration: www.lra.lt.
- State Enterprise Regitra: www.regitra.lt/en/general/.
Chapter 24
Luxembourg
This chapter presents 2014 and 2015 road safety data for Luxembourg. It looks at trends in traffic and road safety from the years 1990 to 2015 and road user behaviour patterns. This includes data on speed, drink driving, drugs and driving, distracted driving, fatigue, and seat belt and helmet use. The chapter reviews Luxembourg's road safety strategy and national targets to 2020 along with the most recently implemented safety measures and current research.*
* All data stem from STATEC unless otherwise noted. For more information please contact: Marie-Jo.Airoldi@statec.etat.lu.
Traffic volume increases each year in Luxembourg as the number of cross border workers and heavy goods vehicles from France, Belgium and Germany increases. In 2015 there were 36 road deaths and 319 seriously injured persons. Speeding is responsible for 38% of all deaths and injuries and has become a priority for Luxembourg's road safety strategy. Since 2000, road deaths and injuries have been reduced by half with a current fatality rate of 6.4 for 100 000 inhabitants.
Road safety data collection
Definitions applied in Luxembourg
- Road fatality: Person killed in a traffic crash or who died because of an injury within 30 days of the crash.
- Serious injury: Injury causing a person to be hospitalised for at least 24 hours.
- Slight injury: Injury requiring less than 24 hours of hospitalisation.
Luxembourg is not using the Maximum Abbreviated Injury Scale of three or more (MAIS+3) to define serious injuries for the time being but the administrations concerned and hospitals are working towards that objective.
Data collection
Data are collected by National Police called to the scene of crashes. In the case of injury or fatal accident, the reports are transmitted to the national statistical institute (STATEC) for data compilation.
Additionally, STATEC is making up a list of fatal crashes based on media releases. This list is used to double check the number of fatal crashes.
Most recent safety data
Road crashes in 2015 – final data
In 2015, the number of fatalities was 36, i.e., an increase of one fatality in comparison to 2014. There were 319 seriously injured persons. Speeding is the presumed contributing factor for 38% of all fatalities and serious injuries. It is estimated that 20% of road fatalities or seriously injured casualties are due to drink driving and 15% due to drivers not respecting the priority indicators.
Road crashes in 2014
In 2014, 35 people lost their lives on the road in Luxembourg, a decrease of 10 fatalities compared with 2013. Compared to 2010, the number of persons seriously injured decreased by 8%. In the period March to October 2014, eight motorcyclists were victims of a fatal road crash.
Speeding was the presumed contributing factor for 48% of all fatalities. It is estimated that 19% of road fatalities and 22% of seriously injured casualties are due to drink driving.
Trends in traffic and road safety (1990-2015)
Traffic
As Luxembourg is bordered by larger countries there is much traffic in transit (including heavy goods vehicles) as well as many workers who cross the border every day to go to work. Traffic increases every year.
Since 1990, the number of vehicles has almost doubled. However, the vehicle fleet in Luxembourg is not an adequate measure of road mobility. The number of cars circulating and kilometres driven in Luxembourg depends to a large extent on foreign vehicles (including heavy vehicles) traveling to and through Luxembourg. Luxembourg has 563 000 inhabitants (as of 31 December 2014), and it has more than 160 000 workers who commute to work from Belgium, France and Germany, many of whom travel daily by car. The number of cross border workers increased by 90% from 2000 to 2014, reaching a total of 168 700 non-resident workers. Moreover, fuel is cheaper than in neighbouring countries, which attracts many car drivers from elsewhere to refuel in Luxembourg.
Road safety
Crashes and casualties
Fatalities peaked in 1970 with 132 road deaths.
Between 1990 and 2014, the number of fatalities has globally followed a downward trend with some fluctuations. In recent years (2000-14), the number of fatalities has been halved
Many crashes happen in the rush hour period (between 7 and 8 a.m. and between 5 and 6 p.m.) when border workers (45% of the working population) are on the roads. About a quarter of those seriously injured or killed in road crashes are foreigners.
Rates
Since 1990, the death rate per 100 000 inhabitants has decreased by more than 60%, while the number of vehicles per 1 000 inhabitants has increased by more than 30%.
In 2015, the fatality rate was 6.4 road deaths per 100 000 inhabitants.
| 2014 % change from | |||||||||
|---|---|---|---|---|---|---|---|---|---|
| 1990 | 2000 | 2010 | 2013 | 2014 | 2013 | 2010 | 2000 | 1990 | |
| Reported safety data | |||||||||
| Fatalities | 71 | 76 | 32 | 45 | 35 | -22.2 | 9.4 | -53.9 | -50.7 |
| Injury crashes | 1 216 | 901 | 876 | 949 | 908 | -4.3 | 3.7 | 0.8 | -25.3 |
| Injured persons hospitalised | 556 | 400 | 266 | 316 | 245 | -22.5 | -7.9 | -38.8 | -55.9 |
| Deaths per 100 000 inhabitants | 18.7 | 17.5 | 6.4 | 8.4 | 6.4 | -24.0 | -0.1 | -63.7 | -66.0 |
| Deaths per 10 000 registered vehicles | 3.3 | 2.4 | 0.8 | 1.0 | 0.8 | -20.2 | 4.4 | -65.9 | -75.5 |
| Traffic data | |||||||||
| Registered vehicles1 (thousands) | 214 | 319 | 411 | 442 | 431 | -2.5 | 4.8 | 35.2 | 101.5 |
| Registered vehicles per 1 000 inhabitants | 564 | 736 | 819 | 823 | 785 | -4.7 | -4.3 | 6.7 | 39.1 |
Table 24.1. Road safety and traffic data
1 2 http://dx.doi.org/10.1787/888933385552
Road safety by user group
Since 1990 the number of fatalities and serious injuries has decreased for all user groups. The reduction was more substantial for car occupants, with the number killed or
1. Registered vehicles including mopeds.
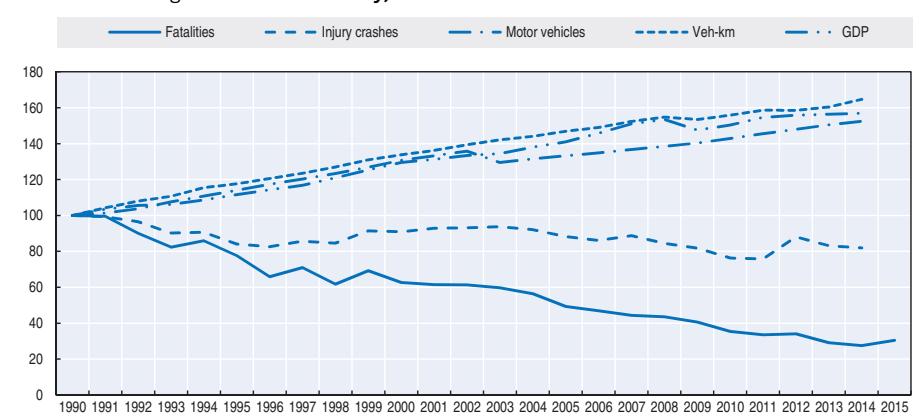
Figure 24.1. Road safety, traffic and GDP trends index 1990 = 100
Source: World Bank for Gross Domestic Product (GDP; constant prices).
seriously injured in road accidents halved between 2000 and 2014. Motorcycle fatalities and serious injuries only dropped by 16 % between 2000 and 2014, while the number of pedestrians killed or seriously injured decreased by 42%.
1990 2000 2010 2013 2014 2014 % change from 2013 2010 2000 1990 Cyclists 1 1 1 0 0
Table 24.2. Road fatalities by road user group
Passenger car occupants 51 53 27 30 24 -52.9 Pedestrians 10 11 1 5 3 -70 Others 1 3 2 2 -
Total 71 76 32 45 35 -22.2% 9.4% -53.9% -50.7%
Moped riders 0 0 0 0 0 Motorcyclists 8 8 1 8 8
Road safety by age group Since 1990, all age groups have benefited from the improvement in road safety.
Road safety by road type
In Luxembourg most fatal crashes occur on rural roads. These crashes can be attributed, to a large extent, to high speed or drink-driving.
Figures too small for meaningful comparisons
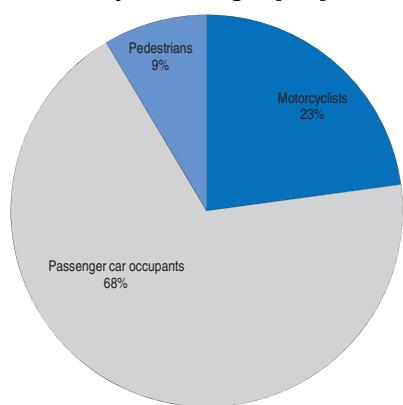
Figure 24.2. Road fatalities by road user group in percentage of total 2014
Table 24.3. Road fatalities by age group
| | | | | | | 2014 % change from | | | | | | | |-------|------|------|------|------|------|--------------------|------|---------------------------------------------|-------|--|--|--| | Age | 1990 | 2000 | 2010 | 2013 | 2014 | 2013 | 2010 | 2000 | 1990 | | | | | 0-5 | 1 | 1 | 0 | 1 | 1 | | | | | | | | | 6-9 | 2 | 1 | 0 | 0 | 0 | | | | | | | | | 10-14 | 1 | 1 | 0 | 1 | 0 | | | | | | | | | 15-17 | 2 | 1 | 0 | 0 | 0 | | | | | | | | | 18-20 | 11 | 5 | 6 | 1 | 3 | | | Figures too small for meaningful comparison | | | | | | 21-24 | 8 | 11 | 4 | 4 | 2 | | | | | | | | | 25-64 | 34 | 45 | 19 | 29 | 26 | | | | | | | | | 65 | 11 | 10 | 3 | 0 | 3 | | | | | | | | | Total | 71 | 76 | 32 | 45 | 35 | -22.2 | 9.4 | -53.9 | -50.7 | | | |
Figure 24.3. Road fatalities by road type
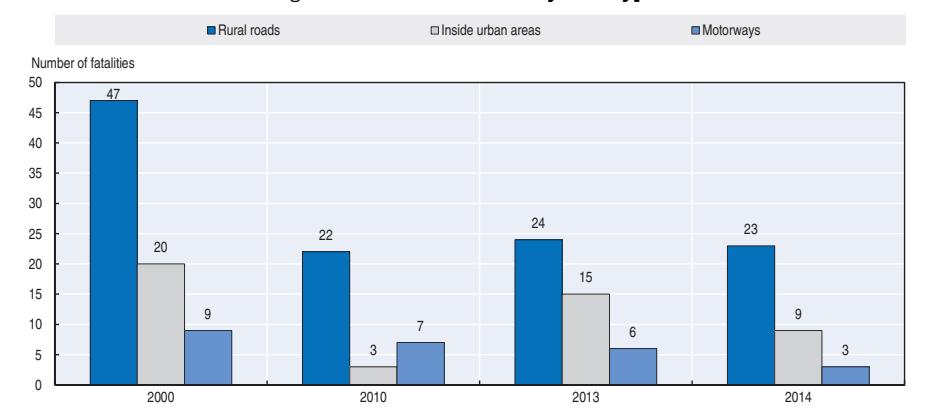
Economic costs of traffic crashes
There is no information available.
Recent trends in road user behaviour
Speed
The table below summarises the main speed limits in Luxembourg.
Table 24.4. Passenger car speed limits by road type, 2016
| Urban roads | 50km/h |
|---|---|
| Rural roads | 90km/h |
| Motorways | 130km/h 110km/h (in rain) |
Drink driving
In Luxembourg, the maximum authorised blood alcohol content (BAC) is 0.5 g/l and 0.2 g/l for novice and professional drivers.
An alcohol-related crash is defined as an injury crash where at least one of the involved drivers or pedestrians has a BAC above 0.5 g/l.
In 2015, 30% of the fatal crashes were classified as alcohol-related.
Drugs and driving
The maximum blood drug content authorised for the following drugs is: THC, 2 ng/mL; amphetamine, 50 ng/ml; methamphetamine, 50 ng/ml; MDMA, 50 ng/ml; MDA, 50 ng/ml; morphine, 20 ng/ml; cocaine, 50 ng/ml; benzoylecgonine, 50 ng/ml.
In 2015, two fatal crashes were classified as drug-related.
Distraction
The use of hand-held phones while driving is forbidden. The use of hands-free devices while driving has been authorised since 2009. A new law with tougher sanctions was adopted in April 2015. It also concerns the use of laptops and tablets while driving
In 2015, according to police records, one fatal crash was due to distraction by electronic devices.
Fatigue and sleepiness
In 2015, according to police records, one fatal crash was due to fatigue.
Seat belts and helmets
Seat belt use has been compulsory in front seats since 1975 and in rear seats since 1992. The use of child restraints has been compulsory since 1992. In 2015, the use of the seat belt reached 90% in the front seat of passenger cars and 76% in rear seats.
Helmets have been compulsory for all motorcycle and moped riders since 1976. The compliance rate is not available, but estimated to be 100%.
National road safety strategies and targets
Organisation of road safety
The Department of Transport in the Ministry of Sustainable Development and Infrastructure is responsible for road safety.
Road safety strategy for 2011-20
In 2014, a round table gathered all national road transport actors to elaborate an action plan to improve road safety. Priorities include:
- reducing speeding
- safety of vulnerable road users
- strengthening the demerit point system introduced in 2002
- road safety campaigns to raise awareness of pollution and dangerous behaviour
- implementation of automatic speed controls
- improvement in road infrastructure.
Road safety targets
Luxembourg adopted the European Union (EU) target to halve the number of fatalities by 2020. The target was defined by analysing the reasons and circumstances under which fatal and serious injury crashes occur.
Monitoring
To meet the EU target, there should be no more than 16 fatalities by 2020. It should be noted that in 2010 – which is the base year for the EU target – the number of road fatalities in Luxembourg was very low (32 deaths), which makes the achievement of the target even more challenging.
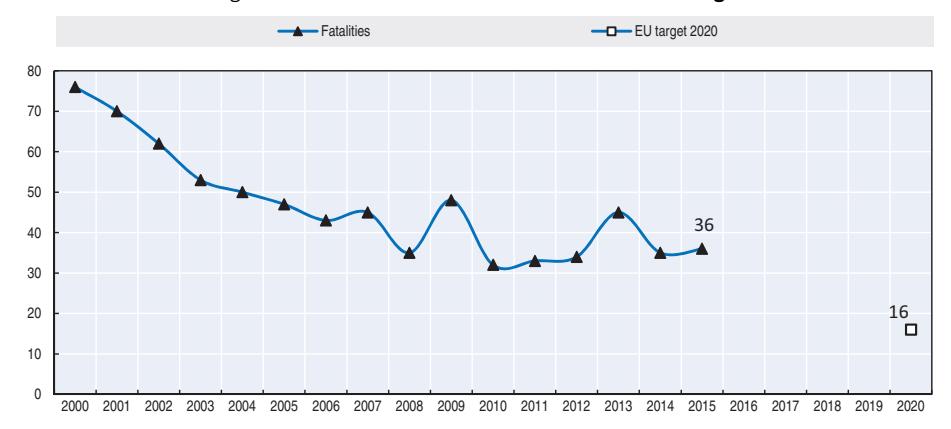
Figure 24.4. Trends in road fatalities towards EU target
ROAD SAFETY ANNUAL REPORT 2016 © OECD/ITF 2016 327
Recent safety measures (2013-16)
Road safety management
● The government agreed to sign a "National Charter for Road Safety" to increase its commitment to road safety.
Speed management
- Speed cameras and section control systems are progressively being implemented.
- In 2014, the Ministry of Sustainable Development and Infrastructure issued guidelines on traffic calming in urban areas (www.mt.public.lu/presse/communiques/2013/05/14apais/ apais\_trafic.pdf).
Road users
- More severe sanctions for traffic regulation violations have been introduced. In 2015, a sanction on using a laptop or a tablet while driving was introduced.
- Parliament is considering a new law punishing impaired driving more severely (demerit point system).
- Since 2015, moped drivers must undertake practical lessons and sit a theory exam in order to obtain their license.
Infrastructure
- A new working group to analyse and improve cycling networks was created within the Ministry of Sustainable Development and Infrastructure.
- In 2014, the Ministry of Sustainable Development and Infrastructure issued new guidelines on pedestrian crossings in urban areas www.mt.public.lu/presse/communiques/2014/04/ 22stats/CCE\_pass\_pietons.pdf (accessed 9 May 2016).
Recent and ongoing research
● In 2015, STATEC published a research report on crashes involving motorcyclists www.statistiques.public.lu/fr/publications/series/regards/2015/04-15-accidents-motocyclistes/ index.html (accessed 9 May 2016).
References
Websites
- Road safety Luxembourg: www.securite-routiere.lu.
- Ministry of Sustainable Development and Infrastructure: www.mt.public.lu.
- STATEC: www.statistiques.public.lu.
Chapter 25
Malaysia
This chapter presents 2014 road safety data for Malaysia along with provisional data for 2015. It looks at trends in traffic and road safety from the years 1990 to 2014 and road user behaviour patterns. This includes data on speed, drink driving, drugs and driving, distracted driving, fatigue and seat belt usage. The chapter reviews Malaysia's road safety strategy and national targets to 2020 along with recently implemented safety measures and current research.*
* Data included in this report are provided by the Malaysian Institute of Road Safety Research (MIROS) unless otherwise noted, and have not yet been validated by IRTAD. For more information please contact: allyana@miros.gov.my.
For the second consecutive year, a decrease was seen in the number of fatalities on Malaysian roads. In 2014, there were 6 674 road deaths reported, a 3.5% decrease over 2013. This is the largest reduction in the number of road fatalities in the past 10 years. Motorcyclists are still the most vulnerable road user group, representing 62% of all fatalities for a 49% share of vehicles on the road. A new road safety plan was launched in 2014 and covers the period 2014-20. The plan is aligned with the Global Decade of Action for Road Safety and aims at reducing by 50% the predicted number of fatalities for 2020.
Road safety data collection
Definitions applied in Malaysia
- Road fatality: Death resulting from a road crash within 30 days after the crash.
- Seriously injured person: Person injured as a result of a road crash as referred to in Section 320 of the Penal Code.
- Slight injuries: Any injury not covered by the above definitions of a fatality or serious injury.
Data collection
The Royal Malaysian Police (RMP) is the agency responsible for collecting crash data. In Malaysia, all road crashes must be reported to the police. Since 1992 police have used a standardised form, POL27, to collect all relevant information for each crash. The form covers information on vehicles involved, environment, injury, location and background of the crash as well as information on the victims. Malaysia has begun work to evaluate underreporting.
In 2008, the Malaysian Institute of Road Safety Research (MIROS) developed a system called M¬ROADS to simplify data use by automating the data query request. M-ROADS serves as an intelligence system to provide road safety stakeholders with accurate, continuous and comprehensive information on road accidents. M-ROADS builds on input from existing nationwide road accident data collected by the traffic police to generate analysis and findings. A newer version of M-ROADS was recently launched in 2015 with many improvements such as a mobile application to ease data collection on site.
To align with the Decade of Action plan, other road authorities such as the Kuala Lumpur municipality and Malaysia Highway Authority have started to collect accident data systematically.
Most recent safety data
Road crashes in 2015 – provisional data
In 2015, there were 6 706 reported road deaths, an increase of 0.5% when compared to 2014. Motorcyclists are the largest user group affected by road crashes.
Road crashes in 2014
Based on data by the Royal Malaysian Police, there were 6 674 road deaths in 2014, a 3.5% decrease compared to 2013. This is the largest reduction in the number of road fatalities in the past 10 years.
Motorcyclists are the most affected by road crashes. In 2014, they represented 62.6% of all fatalities while car drivers and passengers represented 18.8% of fatalities.
Similar to the previous year, most road deaths (35%) occurred on federal trunk roads.
Trends in traffic and road safety (1990-2014)
Traffic
Since 2000 the number of registered vehicles has more than doubled, with powered two-wheelers representing nearly half of the fleet. The volume of traffic has followed a similar trend with a 5% increase for the year 2014 alone.
The motorisation rate in Malaysia is quite high with 828 registered motor vehicles per 1000 inhabitants. This includes the motorcycle fleet.
Road safety
Crashes and casualties
Between 2004 and 2012, fatalities increased every year. For the first time a decrease was observed in 2013 and was confirmed in 2014. The number of fatalities decreased by 3.5% in 2014 compared to 2013. The number of reported injured road users (serious and slight) and injury crashes have shown a marked declining trend. This information is based on police recorded data, and it is likely that there is large underreporting for injury crashes.
At the end of 2014, four years after the launch of the Decade of Action for Road Safety, the number of road fatalities had decreased by 3%.
Rates
The mortality rate is high (22 deaths per 100 000 inhabitants in 2014). However, the risk in terms of deaths per distance travelled or per registered vehicle has decreased significantly since 2000, due to the large rise in motorisation in Malaysia.
Between 2000 and 2014, the death rate in terms of deaths per 100 000 inhabitants declined by 15%, as a result of rapid growth in the population. Risks expressed in terms of deaths per 10 000 registered vehicles both decreased by 53%.
| 2014 % change from | |||||||||
|---|---|---|---|---|---|---|---|---|---|
| 1990 | 2000 | 2010 | 2013 | 2014 | 2013 | 2010 | 2000 | 1990 | |
| Reported safety data | |||||||||
| Fatalities | 4 048 | 6 035 | 6 872 | 6 915 | 6 674 | -3.5 | -2.9 | 10.6 | 64.9 |
| Deaths per 100 000 inhabitants | 22.7 | 25.9 | 24.0 | 23.1 | 22.0 | -4.6 | -8.4 | -15.1 | -3.0 |
| Deaths per 10 000 registered vehicles | 5.7 | 3.4 | 2.9 | 2.7 | -8.9 | -21.9 | -53.3 | ||
| Traffic data | |||||||||
| Registered vehicles (thousands) | 10 599 | 20 189 | 23 706 | 25 101 | 5.9 | 24.3 | 136.8 | ||
| Registered vehicles per 1 000 inhabitants including motorised two wheelers |
456 | 706 | 792 | 828 | 4.7 | 17.3 | 81.8 |
Table 25.1. Road safety and traffic data
1 2 http://dx.doi.org/10.1787/888933385567
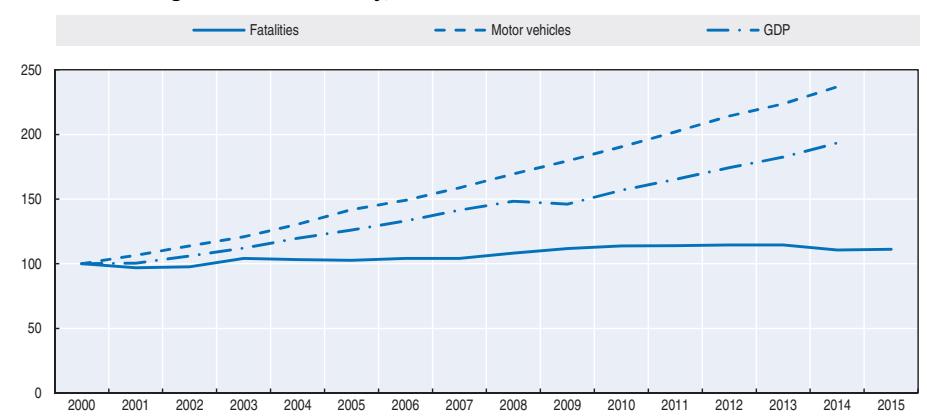
Figure 25.1. Road safety, traffic and GDP trends index 2000 = 100
Source: World Bank for Gross Domestic Product (GDP; constant prices).
Road safety by user group
In 2014, motorcycles represented 49% of the fleet but accounted for 63% of road deaths. Between 2000 and 2014 the number of motorcyclists killed increased by 19%.
In 2014, the situation improved for all road users except pedestrians.
| 2000 | 2010 | 2012 | 2013 | 2014 | 2013 | 2012 | 2010 | 2000 | |
|---|---|---|---|---|---|---|---|---|---|
| Cyclists | 247 | 192 | 156 | 159 | 124 | -22.0 | -20.5 | -35.4 | -49.8 |
| Motorcyclists | 3 519 | 4 036 | 4 178 | 4 294 | 4 179 | -2.7 | 0.0 | 3.5 | 18.8 |
| Passenger car occupants | 1 253 | 1 421 | 1 435 | 1 399 | 1 258 | -10.1 | -12.3 | -11.5 | 0.4 |
| Pedestrians | 721 | 626 | 530 | 455 | 515 | 13.2 | -2.8 | -17.7 | -28.6 |
| Others | 295 | 579 | 618 | 608 | 598 | -1.6 | -3.2 | 3.3 | 102.7 |
| Total | 6 035 | 6 872 | 6 917 | 6 915 | 6 674 | -3.5 | -3.5 | -2.9 | 10.6 |
Table 25.2. Road fatalities by road user group
Road safety by age group
Over the past 10 years the fatalities distribution by age show the highest fatalities among young persons aged 16 to 25.
The young (18-20) and the elderly (above 65) have the highest fatality rate, about 30 deaths per 100 000 inhabitants.
Road safety by road type
In Malaysia, roads are classified in five categories: Motorways, federal roads, state roads, municipal roads and others. The number of fatalities on federal roads is the highest, followed by state roads. Based on police reported data, 86% of fatalities occurred outside urban areas.
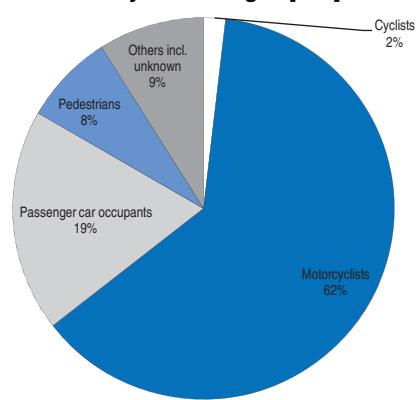
Figure 25.2. Road fatalities by road user group in percentage of total 2014
Table 25.3. Road fatalities by age group
| Age | | | | 2014 % change from | | | | |-------|-------|-------|-------|--------------------|-------|--|--| | | 2012 | 2013 | 2014 | 2013 | 2012 | | | | 0-5 | 24 | 59 | 75 | 27.1 | 212.5 | | | | 6-10 | 59 | 47* | 66 | 40.4 | 11.9 | | | | 11-15 | 385 | 296* | 326 | 10.1 | -15.3 | | | | 16-20 | 1 032 | 960 | 1 131 | 17.8 | 9.6 | | | | 21-25 | 1 116 | 1 139 | 891 | -21.8 | -20.2 | | | | 26-30 | 789 | 856 | 855 | -0.1 | 8.4 | | | | 31-65 | 2 897 | 2 890 | 2 716 | -6.0 | -6.2 | | | | 65 | 615 | 668 | 614 | -8.1 | -0.2 | | | | Total | 6 917 | 6 915 | 6 674 | -3.5 | -3.5 | | |
Figure 25.3. Road fatality rates by age group Deaths per 100 000 inhabitants in a given age group, 2010-13
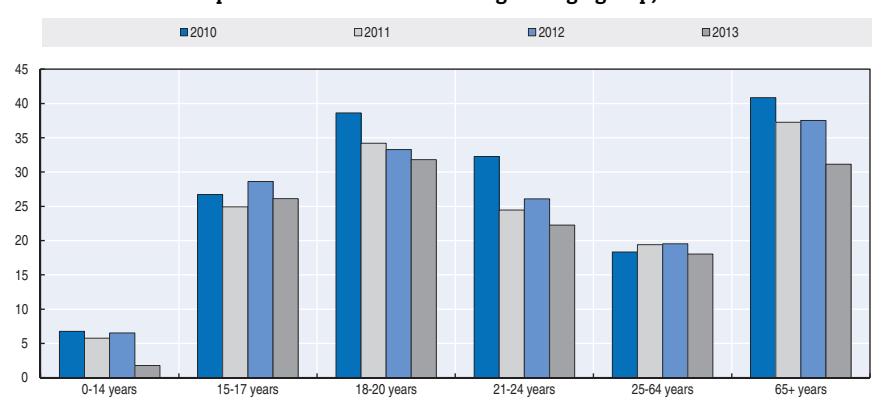
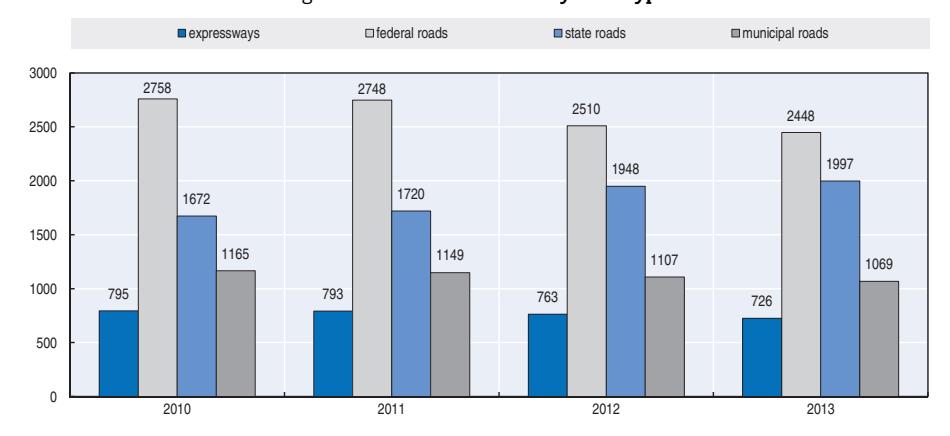
Figure 25.4. Road fatalities by road type
Economic costs of traffic crashes
Traffic crashes represent a significant cost for the Malaysian society. Based on a willingness-to-pay estimation, each year traffic crashes cost around 1.6% of national GDP. The statistical value of life in Malaysia is RM 1.3 million, around EUR 330 000 (Nor et al., 2003; Mohd Yussof et al., 2011).
Recent trends in road user behaviour
Speed
Based on the MIROS study on contributing factors, speeding is one of the main causes of road crashes. The table below summarises the main speed limits in Malaysia.
Table 25.4. Passenger car speed limits by road type, 2016
| Urban roads | 50 km/h |
|---|---|
| Rural roads | 90 km/h |
| Motorways/Expressway | 110 km/h |
A study undertaken in 2015 (Firdaus et al., 2015) shows that the compliance by Malaysian drivers to the 90 km/h posted speed limit on rural roads varies from 53% to 90%.
Another study in one state in Malaysia concluded that more than 50% of the drivers ignored speed limits of lower than 90 km/h especially during off-peak periods. The study also found that more than 70% of drivers complied with the speed limit of 90 km/h or higher. Most of the non-compliant drivers were observed during the period after midnight until early morning (Othman, 2015).
Drink driving and drugs and driving
In Malaysia, according to the Road Traffic Act, it is an offence to drive a vehicle with a blood alcohol content (BAC) over the legal limit of 0.8 g/l.
Islam is the state religion in Malaysia and around 60% of the population is Muslim. Alcohol is available at licensed outlets for the consumption of non-Muslim citizens. Policereported data indicate that drink driving is not an issue in Malaysia, with less than 0.5% of drivers in fatal crashes testing positive for blood-alcohol content.
However, in a retrospective sectional study based on post-mortem files from the Department of Forensic Science of the Kuala Lumpur Hospital, 391 drivers killed in crashes over a four-year period revealed that 23% were positive for alcohol, 11% were positive for drugs and 2.3% were positive for both drugs and alcohol. Among illicit drugs, the opiate group (5.4%) was at the top of the list of drugs detected among fatally injured drivers. The distribution was 2.8% positive for amphetamines, 1.0% for cannabis and 0.8% for ketamine. This study is representative of the situation in Kuala Lumpur only, and not that of the whole country (Norlen et al., 2012).
Fatigue and sleepiness
Information on fatigue is not available from the national crash database collected by the police. A cross-sectional study conducted in urban areas of West Malaysia assessed drivers' conditions in terms of fatigue, sleep quality and risk of Obstructive Sleep Apnoea (OSA). The study revealed that out of 130 drivers, 17.7% were fatigued, 34.7% had poor sleep quality and 14.6% fell into the category of those at high risk from OSA. The study also found that medicinal intake and neck circumference were the most significant factors contributing to fatigue (Ilhamah et al., 2015).
Seat belts and helmets
Seat belt use has been compulsory in front seats since 1978 and in rear seats since 1 January 2009.
The compliance rates among drivers and front passengers are, respectively, about 85% and 75%. Awareness of the regulation is high. The compliance rate for rear seats was 40% shortly after the law came into force in 2009 but is now declining. Following intense enforcement activities in February 2012 the seat belt wearing rate for drivers increased to 91%. The seat belt wearing rate for front seat passengers was 83%, but only 11% for rear seat passengers (Wahida et al., 2015).
In 2014, the seat belt wearing rate decreased for both drivers and passengers. The compliance rate among drivers and front seat passengers were 82% and 68% respectively, and the seat belt wearing rate for rear seats was 9% (Wahida et al., 2015). The study also shows that women were significantly more likely to wear seat belts compared to men in front seats and that drivers in urban areas were significantly more likely to wear their seat belts than those in rural areas.
Table 25.5. Seat belt wearing rate by car occupancy and road type % 2009 2012 (intensive enforcement) 2014
| | 2009 | 2012 (intensive enforcement) | 2014 | | |----------------------|--------------------------------|------------------------------|------|--| | Front seat | | | | | | Drivers | 85 | 91 | 82 | | | Passengers | 75 | 83 | 68 | | | Rear seat passengers | | | | | | Adults | 40 (after law came into force) | 11 | 9 | |
ROAD SAFETY ANNUAL REPORT 2016 © OECD/ITF 2016 335
Helmet wearing has been compulsory for motorcycles since 1973. However, there is still an alarmingly high rate of motorcyclist fatalities due to head injuries. In general, the helmet wearing rates are higher in urban areas than in rural areas. A nationwide study in 2015 concluded that that the helmet wearing rate is high (94.40%) and the rate of proper helmet wearing is acceptable at 77.05% (Rabihah et al., 2015).
National road safety strategies and targets
Organisation of road safety
The Road Safety Department of the Ministry of Transport is the lead agency for road safety in Malaysia. The Malaysian Institute of Road Safety Research (MIROS) provides support by conducting road safety research to assist in elaborating strategies to reduce road traffic deaths.
The other main stakeholders involved in road safety in Malaysia are principally the Royal Malaysian Police, the Public Work Department, the Road Transport Department, the Malaysian Highway Authority, the Ministry of Transport, the Ministry of Health, the Ministry of Education, the Land Public Transport Commission and other road-related agencies. In addition, several non-governmental organisations are actively involved in road safety in Malaysia.
Road safety strategy for 2014-2020
A new road safety plan was launched in 2014 and covers the period 2014-20. The plan is aligned with the Global Decade of Action for Road Safety and designed to:
- increase efforts to reduce the number of traffic casualties
- support the recommendations of the United Nations (UN) in the success of the Decade of Action
- gain political support and adequate resources for highway security initiatives. It is based on the five Pillars of the UN Decade of Action Plan:
- road safety management
- safer roads and mobility
- safer vehicles
- safer road users
- post-crash response.
Road safety targets
The plan has adopted the target set by the Global Decade of Action for Road Safety 2011-20, to reduce the predicted number of road deaths in 2020 by 50%.
Table 25.6. Fatalities target
| 2015 | 2020 | |
|---|---|---|
| Predicted number of fatalities (business as usual) | 8 760 | 10 716 |
| Fatality target with the implementation of the plan | 6 570 | 5 358 |
Monitoring
Based on a report by MIROS, in the absence of a comprehensive road safety programme, there would be 8 760 road fatalities in 2015 and 10 716 in the year 2020. The target is therefore to have less than 5 358 deaths by 2020. This corresponds to an effective reduction of 22% in the number of road deaths when compared to 2010 level.
The road safety plan's progress is monitored by key performance indicators aligned with the recommendations of the Global Plan for the Decade of Action for Road Safety.
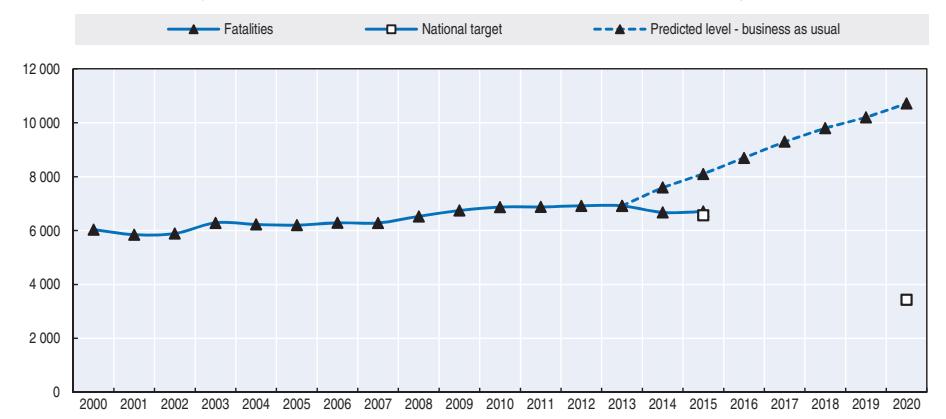
Figure 25.5. Trends in road fatalities towards national target
Recent safety measures (2013-16)
Road users
Automated Enforcement System (AES)
● After a long preparatory phase, the programme of cameras to enforce speeding and red light violations was implemented in September 2013. The programme began at 14 locations. Before implementation, compliance with speed limits on weekdays was on average 63%; it increased to 91% following camera installation. The prevalence of driving through a red light was at 4.3% before the camera installation and decreased to 2.2 % after the camera was installed. The programme promises to continue to encourage safer driver behaviour and should contribute to future reductions in crashes and casualties.
Child Car Seat Campaign
● The Road Transport Department (RTD) recently launched a campaign to promote the use of child car seats. The campaign is an advocacy programme for RTD to encourage the use of child restraints before making it mandatory supposedly in 2017. The Deputy Transport Minister said the government wants to educate the public to use child restraining systems (CRS) in order to reduce fatalities involving children.
Vehicles
Safety Star Grading for Bus Operators
● To complement the 2010 Code of Practice, MIROS introduced in 2013 the Safety Star Grading for Bus Operators. This is a consumer-based programme aimed at providing the general public an indicator on the safety performance of bus operators to make an informed choice on their transport operator. It also benefits the bus industry by improving its image and reputation, thus spurring improvement in their safety operations. This programme was launched on 30 July 2013 by the Deputy Transport Minister, who concurrently announced the assessment results for the first express bus companies which had volunteered for the assessment. Three of the 11 companies that participated were awarded with safety star grading (Ilhamah et al., In Press)
New Car Assessment Programme (NCAP)
● MIROS is the lead agency for the ASEAN New Car Assessment Programme. The programme aims at developing and maintaining a vehicle safety database to rank the make and type of vehicle in terms of safety performance. MIROS's full scale crash laboratory facility has been in operation since May 2012. NCAP awards a safety star rating to new cars based on safety performance in a crash test. This consumer-based programme will assist consumers in choosing a safer car. The programme is supported by Automobile Associations from Malaysia, the Philippines and Singapore. In January 2013, ASEAN NCAP published results for seven popular models in the region.
Recent and ongoing research
● Primary road accident
An Accident Prediction Model was developed by utilising negative binomial regression. Based on the model, it was predicted that accident frequency along Malaysian primary roads increases with an increase in the number of access points per kilometre, curve section per kilometre and the presence of higher traffic volume than 10 000 vehicles per day.
● Motorcycle lanes
Three research studies were undertaken to assess the effectiveness of non-exclusive motorcycle lanes, which are relatively cheaper to create than exclusive lanes. One study found that 16% of motorcyclists did not use the provided facilities and another 2% misused the facilities. A second study found that when the motorcycle lane width was 2-2.5 metres and coupled with a 1 metre clear zone, motorcycle lane use increased. The third study calculated that crash risks went from zero to 1.25 crashes per kilometre per year for a non-exclusive motorcycle lane (Syed Tajul Malik Syed et al., in press; Alvin Poi, in press, Allyana et al., 2014a).
● Impact studies of Automated Enforcement System (AES) implementation
Four studies were carried out to assess the effectiveness of automated enforcement system cameras. The studies were related to observation of compliance with speed limits and traffic lights as well as the perception and acceptance of road users towards the system. (Allyana et al., 2014b; Hawa Mohammed Jamil et al., 2014)
● Risk at three-legged intersection
A study was carried out to determine the risk at three-legged intersections with the influence of traffic volume. The crash risks at these intersections were identified based on the risk per million vehicles entering the intersection during a five-year period. The result showed that the risk at three legged unsignalised intersections is four times higher than at a signalised intersection (Azzuhana et al., 2015).
● High visibility vest for motorcyclists
- A study was conducted to determine the impact of wearing a high visibility vest (HVV) among motorcyclists in enhancing their conspicuity to other road users. The results showed that motorcyclists who donned HVVs were more conspicuous compared to those who do not where one while on the road. (Sharifah, L. et al., 2015).
- Injury patterns for motorcyclists
- The research studied the profile of motorcycle crash victims and other factors determining the nature and severity of injuries. Excluding skin injuries, 73% of all the motorcyclist's injuries are skeletal limb injuries with 40% of them from the lower limbs. The femur was found to be the commonest bone injured. Riders are more likely to suffer skeletal injuries than the pillion passenger they carried on the same motorcycle. This study provides useful information in the clinical management of motorcyclists and may have an impact on vehicle insurance policies. (Zarir Hafiz et al., 2015)
References
- Allyana, S. et al. (2014b), Impact Studies of Automated Enforcement System Implementation, Malaysian Institute of Road Safety Research, Kuala Lumpur.
- Allyana, S., A. Poi and W. Wong (2014a), Towards Safer And Cost Effective Motorcycle Lanes In Malaysia, SEARSS International Seminar & Workshop On Safer Motorcycling & Safer Roads, 26-28 October 2014, Bali, Indonesia.
- Azzuhana et al. (2015), "Crash Risk At Three Legged Intersections: Case Study In Selangor And Negeri Sembilan", Proceeding Conference of ASEAN Road Safety, 3-6 November 2015, Kuala Lumpur.
- Hawa Mohamed, J. et al. (2014), The Effectiveness of Automated Enforcement System in Reducing Red Light Running Violations in Malaysia: Pilot Locations, Malaysian Institute of Road Safety Research, Kuala Lumpur.
- Ilhamah, O. et al. (In Press), Safety Star Grading Assessment Phase 1, MIROS Research Report.
- Ilhamah O. et al. (2015), "Driver Fatigue and Factors Associated Among Commercial Truck Drivers in Malaysia", Proceeding Conference of ASEAN Road Safety, 3-6 November 2015, Kuala Lumpur.
- Mohd Yusoff et al. (2011), Malaysian Value of Fatal and Non-Fatal Injury due to Road Accident: The Willingness to Pay Using Conjoint Analysis Study, Proceedings of the Eastern Asia Society for Transportation Studies, Vol. 8, 2011.
- Nor, G. and M. Faudzi (2003), Value of Life Of Malaysian Motorists: Estimates From A Nationwide Survey, Journal of the Eastern Asia Society for Transportation Studies, Vol. 5, October, 2003.
- Norlen, M. et al. (2012), Alcohol and Drug use Among Fatally Injured Drivers in Urban Area of Kuala Lumpur, MRR 02/2012, Kuala Lumpur: Malaysian Institute of Road Safety Research.
- Othman (2015), Speed limit to what extent it is obeyed? Proceeding Conference of ASEAN Road Safety, 3-6 November 2015, Kuala Lumpur.
- Rabihah et al. (2015), Helmet Wearing Rate: A Study in Malaysian Primary Roads, Proceedings of Conference of ASEAN Road Safety, 3-6 November 2015, Kuala Lumpur.
- Wahida, A. et al. (2015), "Safety Seatbelt Wearing among Vehicle Occupants in Malaysia: Status of 5-years implementation of Rear Seatbelt Regulations", Fact sheet Vol. 1. Factsheet retrieved from: www.miros.gov.my (accessed 9 May 2016).
- Wahida, A. et al. (2015), Seatbelt Wearing In Malaysia: A Nationwide Roadside Observation Among Vehicle Occupants, Proceeding Conference of ASEAN Road Safety, 3-6 November 2015, Kuala Lumpur.
- Zarir Hafiz et al. (2015), "Pattern of Injuries Sustained by Riders And Pillion Passengers in non-Fatal Motorcycle Crashes", Malaysian Institute of Road Safety Research.
Websites
- Road Safety Department: www.jkjr.gov.my.
- MIROS Malaysian Institute of Road Safety Research: www.miros.gov.my.
- ASEAN New Car Assessment Program: www.aseancap.org.
- Road Safety Plan Malaysia 2014-20 (in Malaysian).
Chapter 26
Morocco
This chapter presents 2014 road safety data for Morocco along with provisional data from 2015. It looks at trends in traffic and road safety from the years 1990 to 2014 and road user behaviour patterns. This includes data on speed, drink driving, drugs and driving, distracted driving, fatigue and seat belt usage. The chapter reviews Morocco's road safety strategy and national targets to 2025 along with recently implemented safety measures.*
* Morocco joined the International Road Traffic and Accident Database (IRTAD) group in 2014 as an observer country. The data in this report, unless otherwise noted, were provided by the National Committee for the Prevention of Traffic Crashes (CNPAC) and have not been validated by IRTAD. For more information please contact: boulaajoul@cnpac.gov.ma; bardan@cnpac.gov.ma.
In 2014, Morocco recorded its lowest figure for reported road deaths in the last 15 years, with a total of 3 489 road deaths, a 9% decrease when compared to 2013. This is equivalent to a mortality rate of 10.5 per 100 000 inhabitants. However, the number of fatalities increased by 15% in 2015. Motorisation is still very low with an average of 100 registered vehicles per 1 000 inhabitants. Thus the majority of fatalities are seen amongst vulnerable users, pedestrians, cyclists and motorcyclists. Morocco's new road safety strategy has established a target of less than 2 800 fatalities by 2020 and less than 1 900 fatalities by 2025.
Road safety data collection
Definitions applied in Morocco
- Road fatality: Any person killed immediately or dying within 30 days as a result of a road crash.
- Seriously injured person: Any person injured in a road crash requiring hospitalisation for six days or more.
- Slightly injured person: Any person injured in a road crash requiring medical treatment or hospitalisation of less than six days.
Data collection
In Morocco, crash data are collected at the scene of the crash by police: the Gendarmerie in rural areas and the national police in urban areas.
Police are expected to attend all injury or fatal crashes. Data related to accidents involving material damage only are not recorded.
Crash information is filled in on a form similar to that used in France. This form contains information on the circumstances of the crash, the location, the casualties, etc. It is planned to progressively introduce Global Information System information into police reports.
Data are consolidated at the national level by the Roads Directorate, part of the Ministry of Equipment, Transport and Logistics, and are entered into a Database administered by the same entity since the 1970s.
Police are in contact with hospitals to complete their reports in case of injuries; however there is no detail on the specific level of injuries such as classifications using the International Classification of Diseases 10 (ICD-10) system.
The level of underreporting is not known. In its 2015 global status report (WHO, 2015), the World Health Organization estimated that in 2013 the total number of road fatalities was between 5 800 and 7 000 whereas the reported number was 3 832.
Most recent safety data
Road crashes in 2015 – provisional data
The provisional data for 2015 as follows:
- 78 864 injury crashes, a 14.9% increase compared to the reported number in 2014
- 3 565 road deaths, a 5.4% increase compared to the reported number in 2014
- 9 957 seriously injured persons, a 6.3% increase compared to the reported number in 2014.
Road crashes in 2014
In 2014, there were 3 489 reported road deaths, a 9% decrease when compared to 2013. This was the lowest figure for the last 15 years.
Among the road fatalities recorded in 2014:
- 64% died on roads outside built-up areas.
- 83% were male.
- 28% were less than 24 years old.
- 59% were vulnerable road users (pedestrians, cyclists and motorcyclists).
- About 30% were recorded during the holiday period of July, August and September.
Trends in traffic and road safety (1990-2014)
Traffic
Motorisation is growing quickly in Morocco. Between 2000 and 2014, the number of motorised vehicles doubled. However, with 100 registered vehicles for 1 000 inhabitants, motorisation is in its infancy, and one can expect a large increase in the vehicle fleet in coming years. This will require the implementation of a wide range of road safety measures to avoid an explosion in the number of traffic crashes.
Road safety
Crashes and casualties
The number of police reported road fatalities peaked in 2011, with 4 222 persons killed. In the succeeding 3 years (2012-14), there was a continuous decrease in road fatalities.
Between 1990 and 2014, the number of reported road fatalities increased by 25%. Following an increasing trend, the number of road fatalities recorded a noticeably lower figure in 1996 (2 807 fatalities), when compared to the five previous years. This was attributed to an important effort in enforcement and a strong mobilisation of different road safety services.
From 1996 until 2004, when a National Road Safety Strategy was adopted, the number of road fatalities increased. During the implementation of the national strategy (2004-13), the number of fatalities fluctuated. Measures taken as part of the strategy included:
- speed control
- black spot treatment
- construction of pedestrian and bicycle paths
- awareness campaigns for speed, seat belt and helmet use, fatigue and distraction, etc.
- reform of vehicle inspection
- reform of driving license exam
- introduction of a penalty point system.
Rates
In 2014, the mortality rate was 10.5 deaths per 100 000 inhabitants; while the fatality risk was 10.1 per 10 000 registered vehicles. These rates are high when compared with OECD countries.
Table 26.1. Road safety and traffic data
| 2014 % change from | |||||||||
|---|---|---|---|---|---|---|---|---|---|
| 1990 | 2000 | 2010 | 2013 | 2014 | 2013 | 2010 | 2000 | 1990 | |
| Reported safety data | |||||||||
| Fatalities | 2 777 | 3 627 | 3 778 | 3 832 | 3 489 | -9.0 | -7.6 | -3.8 | 25.6 |
| Injury crashes | 32 992 | 48 350 | 65 461 | 67 926 | 68 279 | 0.5 | 4.3 | 41.2 | 107.0 |
| Deaths per 100 000 inhabitants | 11.5 | 12.7 | 11.8 | 11.8 | 10.5 | -10.7 | -11.4 | -17.6 | -8.6 |
| Deaths per 10 000 registered vehicles | 29.0 | 21.7 | 13.5 | 11.7 | 10.1 | -13.7 | -25.2 | -53.5 | -65.2 |
| Traffic data | |||||||||
| Registered vehicles (thousands) | 956 | 1 675 | 2 791 | 3 286 | 3 438 | 4.6 | 23.2 | 105.3 | 259.6 |
| Registered vehicles per 1 000 inhabitants | 40 | 59 | 88 | 100 | 102 | 1.9 | 16.1 | 72.8 | 156.6 |
Source: CNPAC.
1 2 http://dx.doi.org/10.1787/888933385576
Figure 26.1. Road safety, traffic and GDP trends index 1990 = 100
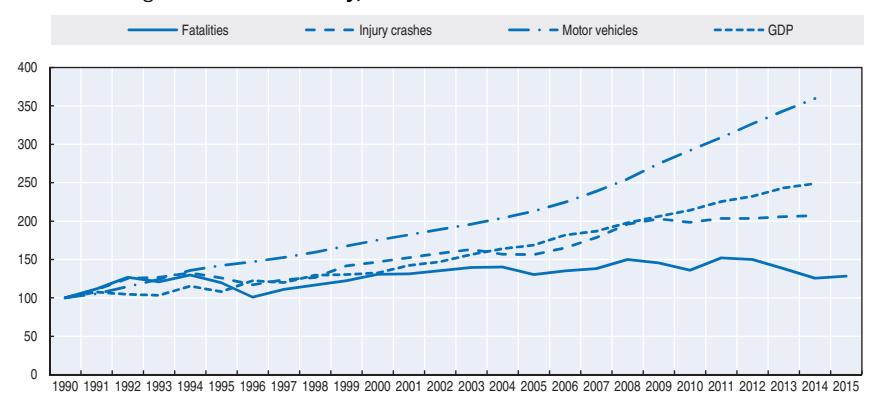
Source: CNPAC, World Bank for growth domestic product (GDP; constant prices).
Road safety by user group
Passenger car occupants are the main victims of traffic crashes, representing 33% of all casualties, followed by pedestrians (26%) and motorcyclists (25%). Vulnerable road users (pedestrians, cyclists and motorcyclists) accounted for 59% of the total number of fatalities in 2014.
The decrease in the number of fatalities in 2014 benefited to all groups of road users, with the exception of pedestrians (+6.3%).
Road safety by age group
In 2014, the reduction in fatalities benefited all age groups, with best achievements for the 6-9, 10-14 and 0-5 age groups.
Road safety by road type
More than two-thirds of crashes occur in built up areas, but the most severe crashes occur on rural roads, where two-thirds of the fatalities are recorded. Crashes outside urban areas are often related to speeding, leading to more severe consequences.
Table 26.2. Reported road fatalities by road user group
| 2010 | 2013 | 2014 | 2014 % change from | ||||||
|---|---|---|---|---|---|---|---|---|---|
| 1990 | 2000 | 2013 | 2010 | 2000 | 1990 | ||||
| Cyclists | 124 | 233 | 219 | 225 | 193 | -14.2 | -11.9 | -17.2 | 55.6 |
| Motorcyclists | 371 | 414 | 714 | 811 | 862 | 6.3 | 20.7 | 108.2 | 132.3 |
| Passenger car occupants | 926 | 1 266 | 1 436 | 1 375 | 1 143 | -16.9 | -20.4 | -9.7 | 23.4 |
| Pedestrians | 987 | 1 132 | 995 | 1 004 | 992 | -1.2 | -0.3 | -12.4 | 0.5 |
| Others incl. unknown | 369 | 582 | 414 | 417 | 299 | -28.3 | -27.8 | -48.6 | -19.0 |
| Total | 2 777 | 3 627 | 3 778 | 3 832 | 3 489 | -9.0 | -7.6 | -3.8 | 25.6 |
Source: CNPAC.
Figure 26.2. Road fatalities by road user group in percentage of total 2014
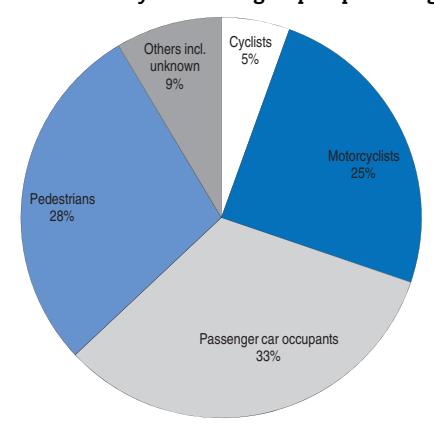
Table 26.3. Road fatalities by age group
| Age | 2012 | 2013 | 2014 | 2014 % change from 2012 |
|---|---|---|---|---|
| 0-5 | 168 | 155 | 137 | -18.5 |
| 6-9 | 149 | 99 | 109 | -26.8 |
| 10-14 | 139 | 105 | 111 | -20.1 |
| 15-17 | 112 | 82 | 102 | -8.9 |
| 18-20 | 189 | 177 | 170 | -10.1 |
| 21-24 | 362 | 347 | 325 | -10.2 |
| 25-64 | 2 513 | 2 383 | 2 097 | -16.6 |
| > 65 | 426 | 400 | 376 | -11.7 |
| Total | 4 167 | 3 832 | 3 489 | -16.27 |
Source: CNPAC.
In 1990, the total length of motorways was less than 100 km and accounted for 2% of fatalities. In 2014, the total length of motorways amounted to 1 494 km and accounted for 6% of fatalities. In 2014, in urban areas, pedestrians and motorcyclists represented 82% of fatalities.
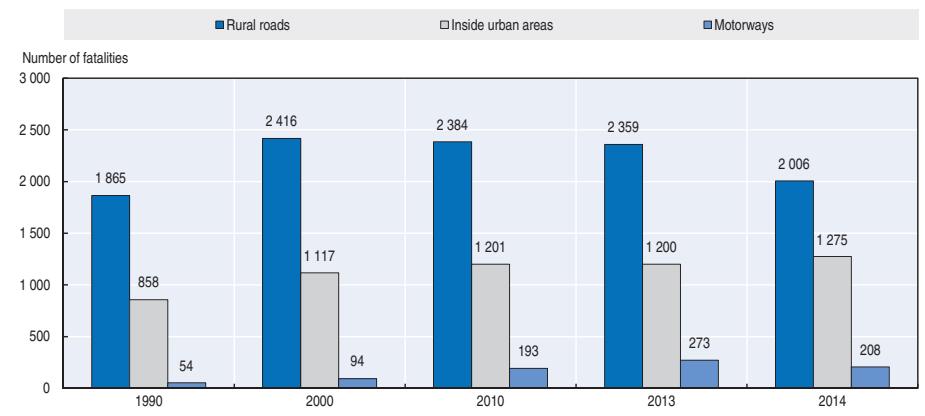
Figure 26.3. Road fatalities by road type
Source: CNPAC.
Economic costs of traffic crashes
Traffic crashes represent a significant cost for the Moroccan society. In 2014, it was estimated that crashes cost EUR 1.7 billion. Based on estimates from the World Bank, crashes account for 2% of Morocco's GDP.
Recent trends in road user behaviour
Speed
The table below summarises the main speed limits in Morocco.
Table 26.4. Passenger car and truck speed limits by road type, 2016
| General speed limit passenger cars | General speed limit trucks > 3.5 t | |
|---|---|---|
| Urban roads | 60 km/h | 60 km/h |
| Rural roads | 100 km/h | 90 km/h |
| Motorways | 120 km/h | 100 km/h |
Source: CNPAC.
Drink driving
In 2010, Morocco enacted a law prohibiting driving under the influence of alcohol. The law fixed the maximum permissible blood alcohol content (BAC) to 0.2 g/l when measured by blood sample and 0.1 mg/l when measured by breath testing.
In 2014, on the basis of police data, alcohol use was cited as a contributing factor in 2.8% of all crashes.
Drugs and driving
According to the Highway Code, it is forbidden to drive under the influence of illicit drugs. This measure is not yet enforced.
Distraction
The use of hand-held phones while driving is forbidden. The use of hands-free devices while driving is authorised. In 2015, it was estimated that 3.6% of drivers were using a mobile phone while driving.
Fatigue and sleepiness
In 2014, on the basis of police data, it was estimated that about 1.2% of crashes were due to fatigue.
Seat belts and helmets
Seat belt use has been compulsory for front seats in rural areas since 1977, and since 2005 for front seats in urban areas and rear seats in rural areas. According to an observational study conducted in August 2015, the wearing rate was 67% for drivers and 63% for front seat passengers.
Since 1976, all riders of powered two-wheelers (PTWs) are required to wear a helmet. In August 2015, the helmet wearing rate was 65% for drivers and 22% for passengers.
National road safety strategies and targets
Organisation of road safety
The agency responsible for the management of road safety is the Directorate of Road Transport and Road Safety in the Ministry of Transport, Infrastructure and Logistics. In 2006, several committees dedicated to road safety were created:
- The Interministerial Committee for Road Safety chaired by the Chief of the Government, responsible for the validation of national road strategies, as well as the co-ordination, monitoring and evaluation of the implementation of the action plans.
- The Permanent Committee for Road Safety chaired by the Minister of Transport, Infrastructure and Logistics, which acts as the technical secretariat for the Interministerial Committee.
- The regional committees for road safety.
The Ministry of the Interior, the Ministry of Justice, the Ministry of Health, the Ministry of National Education, the Ministry of High Education and Scientific Research, the police, the Gendarmerie and the National Committee for Traffic Accidents Prevention are represented in these various committees.
The government is currently working towards the creation of a national road safety agency.
Road safety strategies 2004-2013 and 2016-2025
In 2014 and 2015, the Ministry of Equipment, Transport and Logistics, with the technical assistance of the World Bank and co-operation with various stakeholders, conducted a detailed evaluation of the 2004-13 national road safety strategy and prepared the new road safety strategy for the period 2016-25.
The aim of the new road safety strategy is the development of responsible road behaviour and a safe road system. The strategy will focus on the following five pillars:
● pedestrians
- motorcycles
- single vehicle crashes
- children
- professional transport.
Road safety targets
The former strategy (2004-13) did not set quantified targets. The new national road safety strategy (2016-25) has the following targets:
- Reduce the number of deaths to less than 2 800 by 2020 (decrease of 25% over the five years from 2016 to 2020).
- Reduce the number of deaths to less than 1 900 fatalities by 2025 (decrease of 50% over the 10 years from 2016 to 2025).
Monitoring
Monitoring of the implementation of the strategy is ensured through regular meetings of the Interministerial Committee for Road Safety.
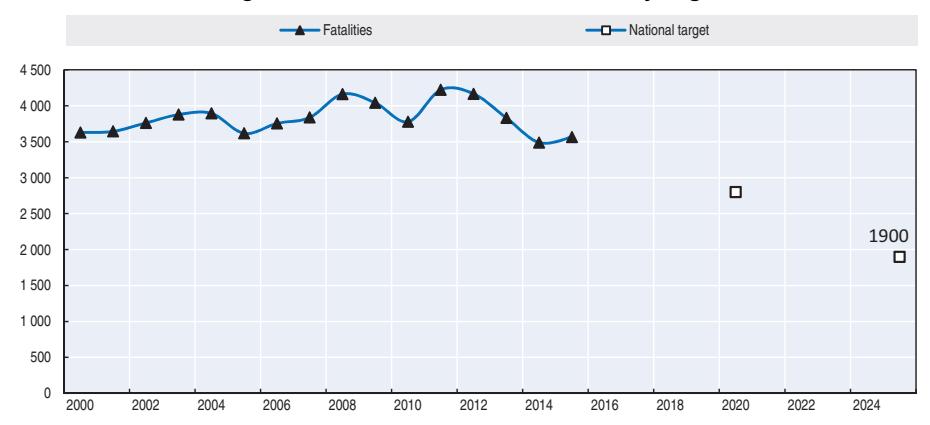
Figure 26.4. Trends towards national fatality target
Recent safety measures (2016)
The Ministry of Transport, Infrastructure and Logistics has prepared a road safety action plan for 2016. The main measures of the plan are summarised below.
Road safety management
● Initiatives from all road safety stakeholders are co-ordinated through co-ordination committees to ensure their actions focuses on the priority areas of the safety strategy.
Road users
● The automated speed enforcement system is being enhanced.
● Communication campaigns are implemented on specific topics: speed, vulnerable road users, seat belts, helmet use, and use of mobile phone while driving.
Infrastructure
- The infrastructure is being improved with identification and elimination of black spots, installation of protective barriers and construction of bicycle paths.
- Protected crossings near schools and in residential areas are being constructed.
Vehicles
● Technical inspection of vehicles is being modernised and the number of technical inspection centres is increasing.
Post-crash measures
- The ambulance fleet is being modernised.
- Training on trauma and emergency care for the staff of emergency' structures is being developed.
Recent and ongoing research
● Road user behaviour measured through roadside surveys: Seat belts and helmets, crossing through a red traffic light or a stop sign, etc.
References
WHO (2015), Global status report on road safety 2015, World Health Organization, Geneva.
Websites
- Comité National de Prévention des Accidents de la Circulation (CNPAC): www.cnpac.ma.
- Ministry of Transport: www.mtpnet.gov.ma.
Chapter 27
Mexico
This chapter presents 2014 road safety data for Mexico along with trends in traffic and road safety from the years 1990 to 2014 and road user behaviour patterns. This includes data on speed, drink driving, drugs and driving, distracted driving, fatigue and seat belt usage. The chapter reviews Mexico's road safety strategy, recently implemented safety measures and current research.*
* The Instituto Mexicano del Transporte (IMT) joined the International Road Traffic and Accident Database (IRTAD) Group in 2016. Data included in this report have not been validated by IRTAD. All data stem from IMT and the Ministry of Health. For more information please contact: mendoza@imt.mx and sergio.rosas@salud.gob.mx.
Mexico, as the newest member of the International Road Traffic and Accident Database (IRTAD), has, since 2010, recorded a decrease of 13% in the number of road crashes, following many years with little movement. During the same five-year period a reduction in fatalities of 4% was noted. In parallel, between 2010 and 2014 the number of registered vehicles increased by 20%, and the number of registered motorcycles nearly doubled reaching nearly 2.3 million units. In 2014, 15 886 fatalities were reported, almost identical to that of 2013. This translates into a fatality rate of 13.3 per 100 000 inhabitants.
Road safety data collection
Definitions applied in Mexico
- Road fatality: Any person who dies following a road crash. When a person does not die at the scene of the crash, but later at hospital or during the transfer to hospital, it is reported as an "injured" person. In this report, road fatalities are those registered in the mortality database of the National Health Information System (SINAIS), and recorded as caused by a motor vehicle traffic crash according to the codes of the International Classification of Diseases (10th Review).
- Injured person: A person suffering minor or severe injuries following a road crash.
All traffic safety related definitions are available through the national statistics agency (INEGI, 2009).
Data collection
The main sources of information for road crashes are the National Institute of Statistics and Geography (INEGI) for urban and suburban areas and the Federal Police (PF) for federal areas. Crash statistics include data on the date and time of the crash, location, type of crash, vehicle type, crash contributing factors, road user category and condition of the casualties (injured or killed). INEGI is also in charge of compiling statistics at a national level.
Crash data for urban and suburban areas are collected on a form developed by INEGI; through the state and municipal safety and traffic agencies. Crash statistics are compiled following the recommendations of the Organization of American States (OAS).
Crashes occurring on the federal road network are reported on a different form through the regional offices of the PF located in 140 areas around the country. These crash forms are then processed in the crash database for federal roads.
Currently, Mexico does not have an integrated road crash database that gathers data from INEGI and the PF. As both systems (INEGI and PF) have different variables and definitions, it is complex to have a precise count of the total number of crashes in the whole country. The most accurate source of data on road deaths and serious injuries is the health database of the Ministry of Health, which is based on health certificates and hospital discharges. Injury data are recorded based on the international classification of diseases (ICD), tenth edition.
Efforts are underway to improve the data collection and monitoring process of road crashes. As part of the Road Safety Programme 2013-18, state observatories are being established in 26 of the 32 federal entities. Sixteen of these report crash data on a common platform (RAVMex) through mobile and web applications, which also enable reporting on contributing factors to crashes. The registration of injury data is also being improved through multisector collaboration.
Most recent safety data
Road crashes in 2014
In 2014, the Ministry of Health reported 378 240 road crashes (STCONAPRA, 2014). According to INEGI, 15 886 persons were killed in these crashes, a 0.2% increase when compared to 2013.
Trends in traffic and road safety (1990-2014)
Traffic
The motor vehicle fleet is increasing rapidly in Mexico. Between 2010 and 2014, the number of registered vehicles increased by 20%. The number of registered motorcycles nearly doubled from 1.15 to 2.27 million units (INEGI, 2016).
The federal highway network consists of approximately 52 000 kilometres, which represent 34% of the national road network. Between 1997 and 2014, the length of the federal highway network increased by 9% but the traffic in vehicle kilometres increased by 68%. The length of the national network of paved roads increased by 63%.
Road safety
Crashes and casualties
In the last 25 years, 15 000 deaths were recorded on average every year. The number of registered fatalities peaked in 2009 at 17 816. In the last five years, a downward trend was observed. Since 2010, the number of crashes decreased by 13% and the number of fatalities by 4%.
Almost seven out of ten deaths in Mexico are vulnerable road users (pedestrians, cyclists and motorcyclists). The situation regarding motorcyclists is particularly worrying. Since 2010, the number of motorcyclists killed increased by 90%.
Rates
The stabilisation in the number of road fatalities and the growth of the population led to a decrease in the fatality rate per 100 000 inhabitants, from 17.2 in 1990 to 13.3 in 2014.
Road safety by user group
Since 1990, the number of people killed among car occupants and pedestrians decreased, but increased for cyclists and in particular motorcyclists. In 2014, the situation continued to deteriorate for motorcyclists and cyclists with a respective increase of 18% and 16% in the number or fatalities.
Road safety by age group
Since 1990, the number of fatalities has decreased for young people up to 17 but increased for all other age groups. In the last two years, improvements were observed again for young people. The largest increase concerned the age group 21-24.
Table 27.1. Road safety and traffic data
| 2014 % change from | |||||||||
|---|---|---|---|---|---|---|---|---|---|
| 1990 | 2000 | 2010 | 2013 | 2014 | 2013 | 2010 | 2000 | 1990 | |
| Reported safety data | |||||||||
| Fatalities | 13 974 | 14 027 | 16 559 | 15 856 | 15 886 | 0.2 | -4.1 | 13.2 | 13.7 |
| Injury crashes | 101 896 | 114 405 | 100 557 | 94 963 | -5.6 | -17.0 | -6.8 | - | |
| Injured persons hospitalised | - | - | 32 743 | 31 320 | 26 389 | -15.7 | -19.4 | - | - |
| Deaths per 100 000 inhabitants | 17.2 | 14.4 | 14.7 | 13.4 | 13.3 | -0.9 | -10.0 | -7.8 | -22.9 |
| Deaths per 10 000 registered vehicles | 14.2 | 9.0 | 5.2 | 4.3 | 4.2 | -3.2 | -20.2 | -53.5 | -70.5 |
| Traffic data | |||||||||
| Registered vehicles (thousands) | 9 862 | 15 612 | 31 636 | 36 743 | 38 024 | 3.5 | 20.2 | 143.6 | 285.6 |
| Registered vehicles per 1 000 inhabitants | 121 | 101 | 282 | 310 | 318 | 2.3 | 12.8 | 214.0 | 161.7 |
1 2 http://dx.doi.org/10.1787/888933385589
Figure 27.1. Road safety, traffic and GDP trends index 1990 = 100
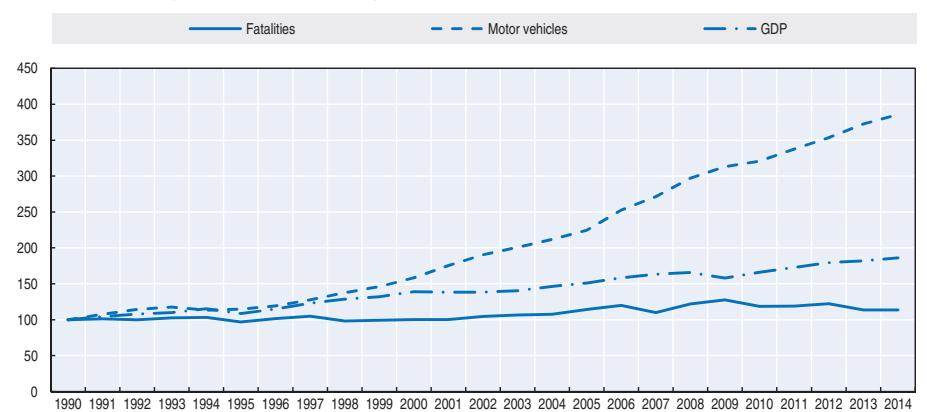
Source: World Bank for Gross Domestic Product (GDP; constant prices).
Table 27.2. Road fatalities by road user group
| 2014 % change from | |||||||||
|---|---|---|---|---|---|---|---|---|---|
| 1990 | 2000 2010 |
2013 2014 |
2013 | 2010 | 2000 | 1990 | |||
| Cyclists | 67 | 107 | 178 | 164 | 190 | 15.9 | 6.0 | 77.6 | 183.6 |
| Motorcyclists | - | 166 | 704 | 1 154 | 1 360 | 17.9 | 93.2 | 719.2 | - |
| Passenger car occupants | - | 3 117 | 3 719 | 3 056 | 2 755 | -9.8 | -25.9 | -11.6 | - |
| Pedestrians | 5 206 | 5 509 | 4 786 | 4 816 | 4 821 | 0.1 | 0.7 | -12.5 | -7.4 |
| Others | 8 576(1) | 5 136 | 7 172 | 6 666 | 6 760 | 1.5 | -5.7 | 31.5 | - |
| Total | 13 974 | 14 027 | 16 559 | 15 856 | 15 886 | 0.2 | -4.1 | 13.2 | 13.7 |
Note: Passenger car occupants included. Until 1990 there was no distinction between different categories of motor vehicles.
People over 65 years old are the most vulnerable in traffic with a fatality rate of 23.9 fatalities per 100 000, i.e. nearly twice that of the average population. They are particularly vulnerable as pedestrians (Secretaría de Salud, 2016).
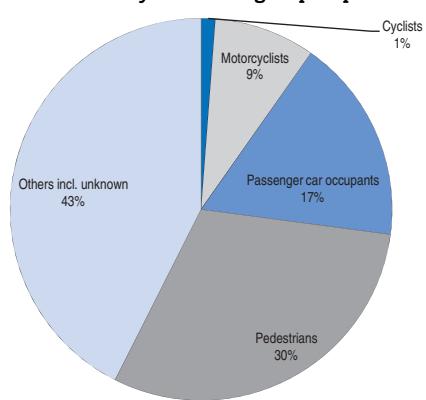
Figure 27.2. Road fatalities by road user group in percentage of total 2014
Table 27.3. Road fatalities by age group
| 2000 | 2014 % change from | ||||||||
|---|---|---|---|---|---|---|---|---|---|
| Age | 1990 | 2010 | 2013 | 2014 | 2013 | 2010 | 2000 | 1990 | |
| 0-5 | 827 | 632 | 627 | 503 | 439 | -12.7 | -30.0 | -30.5 | -46.9 |
| 6-9 | 521 | 348 | 272 | 235 | 214 | -8.9 | -21.3 | -38.5 | -58.9 |
| 10-14 | 634 | 563 | 442 | 362 | 372 | 2.8 | -15.8 | -33.9 | -41.3 |
| 15-17 | 726 | 656 | 815 | 651 | 614 | -5.7 | -24.7 | -6.4 | -15.4 |
| 18-20 | 1 073 | 961 | 1 269 | 1 176 | 1 167 | -0.8 | -8.0 | 21.4 | 8.8 |
| 21-24 | 1 343 | 1 369 | 1 592 | 1 541 | 1 594 | 3.4 | 0.1 | 16.4 | 18.7 |
| 25-64 | 7 183 | 7 699 | 9 366 | 9 246 | 9 319 | 0.8 | -0.5 | 21.0 | 29.7 |
| 65 | 1 498 | 1 640 | 1 961 | 1 914 | 1 910 | -0.2 | -2.6 | 16.5 | 27.5 |
| Total including unknown | 13 974 | 14 027 | 16 559 | 15 856 | 15 886 | 0.2 | -4.1 | 13.2 | 13.7 |
Figure 27.3. Road fatality rates by age group Deaths per 100 000 inhabitants in a given age group, 1990-2014
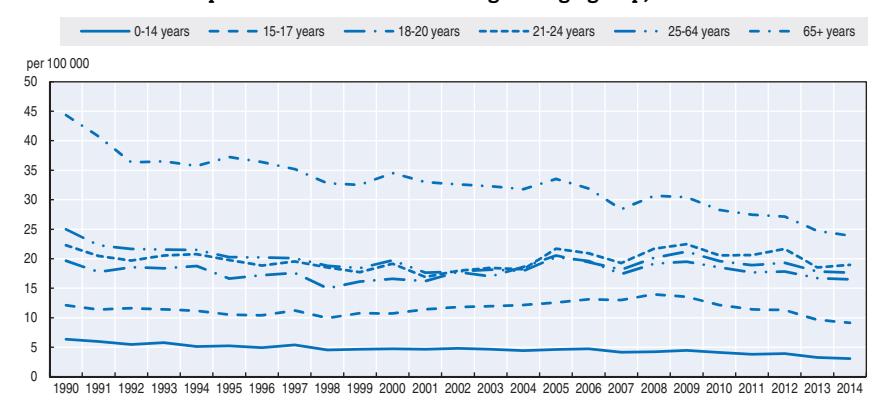
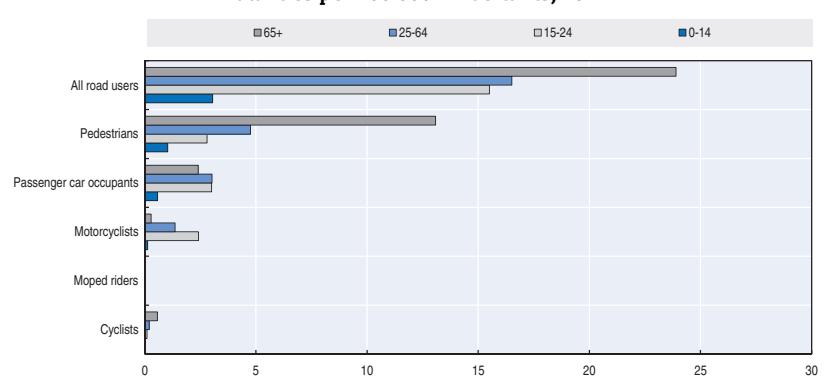
Figure 27.4. Road fatality rate by age and road user group Fatalities per 100 000 inhabitants, 2014
Economic costs of traffic crashes
Traffic crashes represent huge costs to society. In 2013, they were estimated at USD 23.7 billion, i.e. 1.9% of GDP. These costs are estimated based on a human capital approach, as there are not yet any studies available on the statistical valuation of life using a willingness-to-pay approach (IMT, 2015; INEGI, 2016).
Table 27.4. Costs of road crashes, 2014
| Unit cost USD | Total | |
|---|---|---|
| Fatalities | 400 000 | 6.3 billion |
| Injuries | 17.4 billion | |
| Total | 23.7 billion | |
| Total as % of GDP | 1.9% | |
Recent trends in road user behaviour
Speed
In 2014, 60% of road fatalities occurring on the federal highway network were reported by the federal police as due to excessive speed.
Speed measurement on the federal highway network conducted in 2012 revealed an average speed of 63.9 km/h on urban roads and 83.4 km/h on motorways. The 85th percentile speeds (speed at which 85% of vehicles are not exceeding) were respectively 79.5 and 100.5 km/h.
The table below summarises the main speed limits in Mexico.
Table 27.5. Passenger car speed limits by road type, 2016
| General speed limit | |
|---|---|
| Urban roads | 10-80 km/h |
| Other roads | 50 km/h |
| High speed roads | 100 km/h |
| Motorways | 110 km/h |
Source: Gaceta Oficial del Distrito Federal (2015) and Diario Oficial de la Federación (2012)
Drink driving
On federal roads and highways the maximum authorised blood alcohol content (BAC) is 0.8 g/l and 0.3 g/l for truck and coach drivers. On urban roads, the maximum BAC level differs by state.
A crash is defined as an alcohol-related crash when one of the participants (including cyclists and pedestrians) has a BAC above the legal limit.
There are several estimations of the contribution of drink driving to fatal crashes. According to the statistics office (INEGI, 2016), in 2014, on urban roads, 9% of fatalities were due to a drunk drivers. However it is important to note that the BAC level of those involved in the crash was only available for 53% of the road deaths. The table below indicates the share of road fatalities due to drink driving. According to data from the Ministry of Health, drink driving was the main contributing factor for 23% of the road deaths in 2009 (Secretaría de Salud, 2010).
Table 27.6. Share of fatalities due to drinking and driving
| Year | Alcohol test
% | | | | | | |
|------|-------------------|----------|---------|--|--|--|--|
| | Positive | Negative | No data | | | | |
| 2000 | 10.2 | 37.2 | 52.6 | | | | |
| 2005 | 11.3 | 44.3 | 44.5 | | | | |
| 2010 | 8.7 | 46.8 | 44.5 | | | | |
| 2011 | 8.4 | 51.4 | 40.2 | | | | |
| 2012 | 10.3 | 35.3 | 54.4 | | | | |
| 2013 | 9.6 | 38.5 | 51.9 | | | | |
| 2014 | 8.9 | 37.8 | 53.3 | | | | |
Source: INEGI (2016).
Drugs and driving
A crash is defined as drug related when one of the participants (including pedestrians or cyclists) has consumed one or more psychoactive drugs.
The Mexican authorities conduct regular checking on the federal highway network to test the physical and physiological conditions of professional drivers.
There is no data available to estimate deaths due to drugs and driving.
Distraction
There is no official definition of distracted driving. In Mexico, only hand-free devices are allowed while driving. There is no data on the contribution of distracted driving to road crashes.
Sleepiness and fatigue
There is no data on the contribution of sleepiness and fatigue to fatal crashes.
Seat belts and helmets
Seat belt wearing has been compulsory in front seats since 2012. They are compulsory in rear seats since 2015.
Table 27.7. Seat belt wearing rate by car occupancy and road type
| 2000 | |
|---|---|
| Front seat (driver + passengers) | 29% |
| Rear seats | 4% |
Source: World Health Organization (WHO; 2011).
The use of safety helmets is mandatory for all drivers and passengers of motorcycles, on the whole network (federal highway network; urban and suburban roads). The table below illustrates the evolution of helmet use by drivers and passengers between 2010 and 2014.
Safety helmets are not mandatory for cyclists.
Table 27.8. Evolution in the use of safety helmets 2010-14
| 2010 | 2011 | 2012 | 2013 | 2014 | |
|---|---|---|---|---|---|
| Driver | 64.4% | 72.1% | 62.3% | 79.8% | 81.9% |
| Passengers | 58.9% | 69.6% | 78.6% | 70.2% | 57.3% |
Source: STCONAPRA (2014).
National road safety strategies and targets
Road safety strategy for 2011-20
To support the Decade of Action for Road Safety, Mexico launched in 2011 its National Road Safety Strategy 2011-20 (DOF, 2011). The strategy was developed jointly by the Ministry of Communications and Transport (SCT) and the Ministry of Health. Its main target is to reduce by 50% the number of fatalities and to reduce as much as possible injuries and disabilities due to road crashes. The strategy suggests the adoption of a general road safety law and the creation of a national road safety agency and a national road safety council.
The strategy is based on the Global Plan for the Decade of Action (United Nations Road Safety Collaboration, 2011) and is organised around the following pillars:
- Road safety management: The main objectives are to strengthen the co-operation between federal, state and municipal agencies involved in traffic safety, to develop a nation-wide legal framework for road safety and to improve crash data.
- Safer infrastructure: The main objectives are to upgrade the infrastructure to adopt a legislative framework to facilitate the improvement of the planning, design, construction and maintenance of the road network.
- Safer vehicles: The focus is on the adoption of standards for minimum safety requirements for the vehicles operated on Mexican roads. The focus will also be on the mandatory use of child restraint systems.
- Road user behaviour: Activities include awareness campaigns, enforcement and a review and homogenisation of the driving licence requirements.
- Post-crash care: The main objective is to have top quality emergency and hospital services, specialised in road traffic injuries. Activities will focus on the development of protocols for the rehabilitation of road crash victims and prevention programmes.
Recent safety measures (2013-16)
Legislation
- Preparation of a national road safety law, including the creation of a National Road Safety Agency and a National Crash Investigation Agency.
- The National Advisory Committee on Standardization of Land Transport (CCNN-TT), co-ordinated by the Secretariat of Communications and Transportation, is reviewing and updating the Mexican Official Standards contributing to road safety, including:
- ❖ road signing and signalisation
- ❖ road guardrails
- ❖ emergency braking lanes on highways
- ❖ maximum weight and dimension of vehicles
- In 2016, standards are being developed by the Ministry of Heath for motorcycle helmets, speed cameras and blood alcohol measurement.
Road safety data management
● A task force on crash statistics and performance indicators is working towards the improvement of the national crash data system. In 2015, 26 regional road safety observatories were established. A new web-based application has been developed to link different road crash databases into a common platform (RAVMex).
Road users
- Review and update of the minimum training programme for professional drivers to obtain a federal license.
- Ongoing project on the effective regulation of driving time.
- Since 2009, the health agency has promoted and strengthened strategic action against drink driving. In 2016, regular alcohol checkpoints will be implemented in 158 municipalities. This is four times as many as in 2010. During 2015, more than 20 000 alcohol checkpoints were set up, with 985 874 breath tests conducted (13% of them positive).
- Training for trainers is one of the components of the National Training Programme in Road Safety.
- The National Training Programme in Road Safety started in 2010. As of 2015, 1 196 trainers have been trained in road safety, and 14 690 promoters have given awareness talks to over 2 million citizens.
- The Ministry of Health has trained 1 871 First Aid instructors in 28 states
Infrastructure
- A project was conducted to assess the performance and condition of the federal highway network using the methodology of the international road assessment programme (iRAP). This has facilitated the development of an investment plan for safer roads. The iRAP Mexico project has helped address significant road safety problems and identify appropriate solutions (e.g. vertical signs and road markings).
- Several important infrastructure improvement projects are being carried out such as the installation of protective barriers, improved intersections, pedestrian bridges, bus stops, road markings, and emergency braking ramps.
● In Mexico the priority is shifting from car occupants to the most vulnerable road users. Mexico has more than 1 400 road safety auditors in 30 states including 162 members of the Federal Police. Each state is required to implement at least three changes in infrastructure giving priority to pedestrians under a philosophy of Vision Zero.
Recent and ongoing research
● Risk factors: the study focused on the prevalence of risk factors in traffic crashes. The following safety performance indicators monitored helmet wearing, BAC level, use of seat belts, use of protective clothing, etc. In 2015, surveys were conducted in 43 municipalities in 28 states. The results show that helmet use is higher for motorcycle drivers (72.8% to 81.9%) than their passengers (41.3% to 57.3%). The use of protective clothing is globally low (i.e., between 1% and 20%).
References
- DOF (2011), "Acuerdo por el que se da a conocer la Estrategia Nacional de Seguridad Vial 2011-20", Diario Oficial de la Federación, Mexico.
- DOF (2012), "Reglamento de Tránsito en Carreteras y Puentes de Jurisdicción Federal", Publicado el 22 de noviembre de 2012, Diario Oficial de la Federación, Mexico.
- Gaceta Oficial del Distrito Federal (2015), "Reglamento de Tránsito del Distrito Federal", Publicado el 17 de agosto de 2015.
- IDB (2013), "The Costs of Road Injuries in Latin America 2013", IDB Road Safety Strategy INE/TSP, Technical Notes N-IDB-TN-597, Inter-American Development Bank, Washington, DC, USA.
- IMT (2015), "Anuario estadístico de Accidentes en Carreteras Federales, 2014", Sanfandila, Querétaro, 2015.
- IMT (2015), "Comparación Estadística entre la Clasificación por Estrellas y la Accidentalidad en Carreteras Federales", Publicación Técnica No. 438, Instituto Mexicano del Transporte, Sanfandila, Querétaro, 2015.
- INEGI (2009), Síntesis Metodológica de la Estadística de Accidentes de Tránsito Terrestre en Zonas Urbanas y Suburbanas, Instituto Nacional de Estadística y Geografía, Aguascalientes, México.
- INEGI (2016), Vehículos Registrados en Circulación, Instituto Nacional de Estadística y Geografíah, Mexico, www.inegi.org.mx/est/lista\_cubos/consulta.aspx?p=adm&c=8 (accessed 19 May 2016).
- INEGI (2016), Volumen y crecimiento. Población total por entidad federativa, 1895 a 2010, Instituto Nacional de Estadística y Geografía, Mexico, http://www3.inegi.org.mx/sistemas/sisept/Default.aspx? t=mdemo148&s=est&c=29192 (accessed 19 May 2016).
- INEGI (2016), "Mortalidad", Instituto Nacional de Estadística y Geografía, Mexico, www.inegi.org.mx/est/ lista\_cubos/consulta.aspx?p=adm&c=4 (accessed 19 May 2016).
- INEGI (2016), "Accidentes de tránsito terrestre en zonas urbanas y suburbanas", Instituto Nacional de Estadística y Geografía, Mexico, www.inegi.org.mx/est/contenidos/proyectos/registros/economicas/ accidentes/descripciones.aspx (accessed 19 May 2016)
- INEGI (2016), "Producto Interno Bruto Variación Anual", Instituto Nacional de Estadística y Geografía, Mexico, www.inegi.org.mx/est/contenidos/proyectos/cn/pibt/ (accessed 19 May 2016)
- INEGI (2016), "Base de datos del Sistema Estatal y Municipal", Instituto Nacional de Estadística y Geografía, Mexico, http://sc.inegi.org.mx/cobdem/resultados.jsp?w=95&Backidhecho=101&Back constem=99&constembd=029&tm=%27Backidhecho:3,Backconstem:2,constembd:3%27 (accessed 19 May 2016).
- Secretaría de Salud (2010), Dirección General de Epidemiología, Sistema de Vigilancia Epidemiológica de las Adicciones (SISVEA), Informe 2009, Mexico.
Secretaría de Salud/STCONAPRA (2014), "Informe sobre la situación de la seguridad vial en México", Primera Edición, Ciudad de México, Mexico.
Secretaría de Salud (2016), Dirección General de Información en Salud. Base de datos sobre defunciones, Secretaría de Salud, Mexico, www.dgis.salud.gob.mx/contenidos/basesdedatos/std\_defunciones.html (accessed 19 May 2016).
WHO (2011), "Basal Diagnostic of RE-10 (INSP-JHU)", Information obtained from three cities: Guadalajara, Leon and Cuernavaca, 2011, World Health Organization, http://conapra.salud.gob.mx/Interior/ Documentos/OMS\_2013/mexico\_OMS.pdf (accessed 19 May 2016).
United Nations Road Safety Collaboration (UNRSC) (2011), Global Plan for the Decade of Action for Road Safety 2011-2020, World Health Organization, Geneva.
Websites
- Instituto Mexicano del Transporte (IMT): www.imt.mx.
- Consejo Nacional para la Prevencion de Accidentes (STCONAPRA): http://conapra.salud.gob.mx./
- Instituto Nacional de Estadistica y Geographia (INEGI): www.inegi.org.mx/.
Chapter 28
The Netherlands
This chapter presents 2014 road safety data for the Netherlands along with fatality data from 2015. It looks at trends in traffic and road safety from the years 1990 to 2014 and road user behaviour patterns. This includes data on speed, drink driving, drugs and driving, distracted driving, fatigue and seat belt usage. The chapter reviews the Dutch road safety strategy and national targets to 2020 and the progress achieved thus far. It also looks at ongoing research and recently implemented safety measures.*
* Statistics in the Netherlands distinguish between reported and actual (or real) numbers of casualties. The former category covers casualties reported by the police. Actual numbers are higher, as they take into account data available from sources such as court files and death certificates. This report uses the real number of fatalities unless there is a specific reference to the "reported" numbers. All data stem from SWOV, the Ministry of Infrastructure and the Environment and IRTAD unless otherwise noted. For more information please contact: niels.bos@swov.nl.
Dutch roads are among the safest in the world for motorists. In 2014, there were 570 fatalities, identical to the number recorded for 2013, equalling a fatality rate of 3.4 per 100 000 inhabitants. However, the 2015 fatality total shows a 9% increase with 621 fatalities. Overall, between 2000 and 2014 road deaths were reduced by 51%; however, the number of people seriously injured increased by nearly 44%. Of these, less than 10% are occupants of passenger vehicles, and an increasing proportion of those injuries do not involve any motorised vehicle. This is largely due to an increase in cycling, E-bikes and electric mobility scooter use by senior citizens. The focus of the Dutch road safety strategy is to improve cycling infrastructure and safety for vulnerable users.
Road safety data collection
Definitions applied in the Netherlands
- Road fatality: Death resulting from a road crash within 30 days of the crash.
- Seriously injured: Person admitted to hospital for an injury with a Maximum Abbreviated Injury Score of two or more (MAIS2+).
- Slightly injured: Other injury, not admitted or admitted with a Maximum Abbreviated Injury Scale score of one (MAIS1).
Data collection
In the Netherlands, Statistics Netherlands works together with the Ministry of Infrastructure and the Environment (Rijkswaterstaat) to match police-reported fatalities with other records including court files and death certificate records to arrive at the actual number of road traffic fatalities. Both the police-reported number and the actual number have been published annually since 1996. This report uses the actual number of fatalities unless there is a specific reference to "reported" numbers. In 2014, the police number was 84% of the actual number. For more information: www.swov.nl/UK/Research/cijfers/ Cijfers\_Registratiegraad-UK.htm (accessed 17 May 2016).
Police reporting of road crashes does not meet the requirements of the Institute for Road Safety Research (SWOV, Stichting Wetenschappelijk Onderzoek Verkeersveiligheid) and the Ministry of Infrastructure and the Environment. A national information system for the police implemented in 2009 led to lower data quality and a smaller number of reported crashes. New procedures are intended to improve the police data as from 2015 at the earliest.
Research on serious traffic injuries shows that the number of police-reported hospitalised casualties is not a good indicator. SWOV matches the Dutch police data to hospital discharge records and the MAIS score is affixed based on the ICD-derived AIS scores of patients whose injuries were coded in ICD9cm (International Classification of Diseases, 9th revision Clinical modification, WHO 1980).
The estimated actual number of serious injuries is now based on the data from both police and hospital databases, and the definition of a serious injury is based on the MAIS, not the police report. Based on this method, the Netherlands is also able to report on MAIS2 or MAIS3+.
Ambulance data are being made available for traffic safety research (years 2009-14). There are different reporting systems and external causes are not always recorded. Although this data source has unknown quality, its usefulness is under investigation so as to have more information on accident locations.
At the National Road Safety Congress on 24 April 2014, the Dutch Association of Insurance companies, the national police and road safety data consultant Via launched the STAR Safety Deal. Eleven national stakeholders signed an agreement to facilitate crash reporting by road users. The STAR initiative launched a smartphone app in March 2016, enabling road crash reports by individuals, supported and (partly) verified by police or an insurance company. Crashes can also be reported via the online tool, www.mobiels chademelden.nl. This source too is of unknown quality. Hopes are that serious crashes with bicycles and without motor vehicles involved can be reported with this app. Currently, less than 5% of these crashes are reported by the police, while they are the cause of more than half of all serious road injuries in the Netherlands.
Most recent safety data
Road crashes in 2015 – final actual data
In 2015 there were 621 road fatalities, an increase of 9% compared to 2014.
A larger number of male car occupants and senior citizens on mobility scooters were killed.
Road crashes in 2014
In 2014, as in 2013, 570 people lost their lives in road traffic crashes. The number of serious injuries (MAIS3+) was estimated at 7 500 which indicates an increase of 17%. The number of MAIS2+ increased by 10% to 20 700 (Bos, 2015).
Trends in traffic and road safety (1990-2014)
Traffic
Between 1990 and 2014, the number of motorised vehicles increased by 68% and the overall vehicle distance travelled by 34%. Passenger car mobility has decreased among younger drivers during recent years, levelling the rate of growth.
Since 2000, the proportion of mobility across the main transport modes has remained almost unchanged (KiM, 2013). In 2014, slightly less than half of all trips were made by car (46%), slightly over a quarter of trips by bicycle (27%), one in twenty-five trips (4%) by public transport (train, tram, bus or metro), and one-fifth of trips (21%) by some other means (mainly walking, including taxi, mobility scooter) (KiM, 2015).
Of the total distance travelled in 2014, cars accounted for 72%, public transport for 12% and bicycles for 9%.
From 2000 to 2014, the distance cycled increased by 24%. The largest share of this growth has been from electric bicycles, which have rapidly increased in popularity (KiM, 2013, 2014, 2015). Distances per bicycle trip have increased due to better services offered to cyclists, the expansion of urban areas and the rising popularity of electric bikes. The current estimate (2013 data) is that 10% of Dutch people own electric bikes, and for people aged 65 and over, that proportion is 25%. E-bike users travel twice as far as those in the same age group riding regular bicycles. In 2014, the bicycle mobility of persons of 65 years and older is for 37% on E-bikes (KiM, 2015).
Road safety
Crashes and casualties
Between 1990 and 2014, the number of fatalities decreased by 61%. From 2000 to 2014, the number of fatalities fell by 51% (numbers from 1990-95 were adjusted to compensate for police underreporting).
Weijermars et al. (2014a) studied the major road safety developments in the Netherlands in the period 2000-12 and underlying contributory factors. On the favourable side, the number of actual fatalities in the period of 2000-13 decreased from 1 166 to 570. Less favourable developments were that the number of cyclist fatalities did not decrease significantly. The number of fatalities among senior citizens decreased at a lower rate than for other age categories. Also, the number of those seriously injured has increased. The number of casualties in crashes in which no motorised vehicles were involved more than doubled between 2000 and 2011.
The traffic system changed considerably in the period of 2000-12F. The design of the underlying road network improved and enforcement for a number of risk-increasing behaviours (speeding, drink driving, failing to use seat belts and helmets) was intensified in the period 2000-10 but decreased after 2010. Moreover, the European New Car Assessment Programme (Euro NCAP) for passenger cars played a major role in stimulating the production of safer vehicles. Passive vehicle safety systems such as airbags and seat belts played an important role in reducing injuries, and active safety systems, car bonnets and exterior airbags help protect pedestrians and cyclists in case of a crash. Improvements in the medical care, including more regionalisation, mobile medical teams and air ambulances, have further contributed to the decrease in fatalities. The national road safety policy emphasis has shifted to vulnerable road users (Weijermars et al., 2014b).
Analysis of seriously injured data
Figure 28.1 shows the development in the number of serious road injuries in the period 2000 to 2014 (injury severity MAIS = 2). Although a decline seemed to have started in 2012 and 2013, the entire period shows an increasing trend. The number of those seriously injured reached a new high in 2014 at 20 700 (SWOV, 2015b).
During the last ten years, the largest increase in the proportion of serious road injuries occurred in crashes not involving a motor vehicle. The number of serious road injuries among occupants of passenger cars and vans is the only group that has shown a significant decline over the last ten years. In 2009, this group constituted about 15% of the number of serious road injuries in the hospital register. Presently, less than 10% of the serious road injuries are occupants of passenger cars or delivery vans.
Mortality rates
In 2014, there were 3.4 road fatalities per 100 000 inhabitants. Between 2000 and 2014, the mortality rate, expressed in terms of deaths per 100 000 inhabitants, fell by 54%.
Figure 28.1. Estimated number of serious road injuries in the Netherlands since 2000. Total numbers and distribution between crashes involving (M) or not involving (N) a motor vehicle
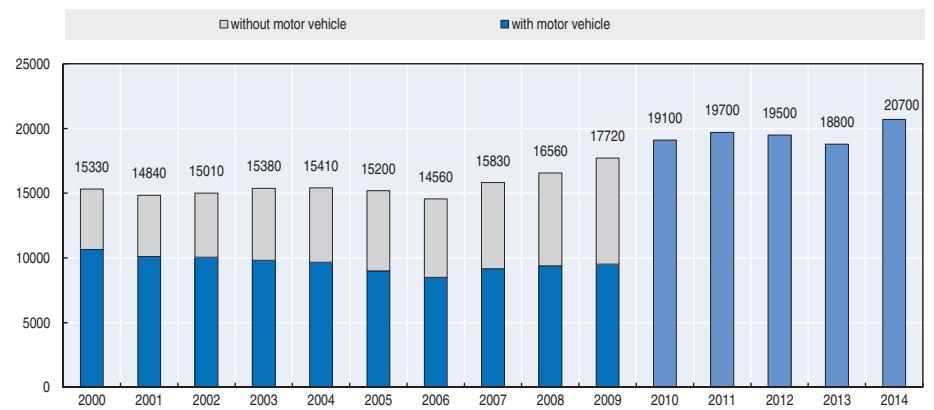
Note: Following 2009, the precise distribution between N-casualties and M-casualties cannot be determined. Source: DHD, IenM, and SWOV.
Table 28.1. Road safety and traffic data – numbers on crashes reported by the police
| 2013 | 2014 % change from | ||||||||
|---|---|---|---|---|---|---|---|---|---|
| 1990 | 2000 | 2010 | 2014 | 2013 | 2010 | 2000 | 1990 | ||
| Reported safety data | |||||||||
| Fatalities | 1 376 | 1 082 | 537 | 476 | 476 | 0 | -11.4 | -56.0 | -65 |
| Deaths per 100 000 inhabitants | 9.2 | 6.8 | 3.2 | 2.8 | 2.8 | -0.3 | -12.7 | -58.5 | -69 |
| Deaths per 10 000 registered vehicles | 2.2 | 1.3 | 0.52 | 0.44 | 0.44 | -0.1 | -14.8 | -65.6 | -79 |
| Deaths per billion vehicle km | 13.1 | 9.0 | 4.0 | 3.6 | 3.6 | 0.3 | -10.6 | -60.0 | -72 |
| Injury crashes | 44 916 | 37 947 | 19 3782 | ||||||
| Traffic data | |||||||||
| Registered vehicles1 (thousands) |
6 382 | 8 385 | 102 96 | 10 698 | 10 712 | 0.1 | 4.0 | 27.8 | 68 |
| Distance travelled (million km) | 105 400 | 119 700 | 132 800 | 132 100 | 131 700 | -0.3 | -0.8 | 10.0 | 25 |
| Registered vehicles per 1 000 inhabitants | 429 | 529 | 621 | 638 | 637 | -0.2 | 2.5 | 20.4 | 49 |
1. Including mopeds.
1 2 http://dx.doi.org/10.1787/888933385599
Table 28.2. Road safety data – actual (real) data
| | | | | | 2014 % change from | | | | |----------------------------------------|-------|-------|-------|-------|--------------------|-------|-------|--| | | 2000 | 2010 | 2013 | 2014 | 2013 | 2010 | 2000 | | | Actual safety data | | | | | | | | | | Fatalities | 1 166 | 640 | 570 | 570 | 0 | -10.9 | -51.1 | | | Injured persons with score MAIS3+ | 5 220 | 5 700 | 6 500 | 7 500 | 15.4 | 31.6 | 43.7 | | | Deaths per 100 000 inhabitants | 7.3 | 3.9 | 3.4 | 3.4 | -0.3 | -12.3 | -53.9 | | | Deaths per 10 000 registered vehicles1 | 1.4 | 0.62 | 0.53 | 0.53 | -0.1 | -14.4 | -61.7 | | | Deaths per billion vehicle kilometres | 9.7 | 4.8 | 4.3 | 4.3 | 0.3 | -10.2 | -55.6 | |
2. Following 2009 the reporting of minor crashes sharply dropped. No information on progress in safety can be derived from the numbers.
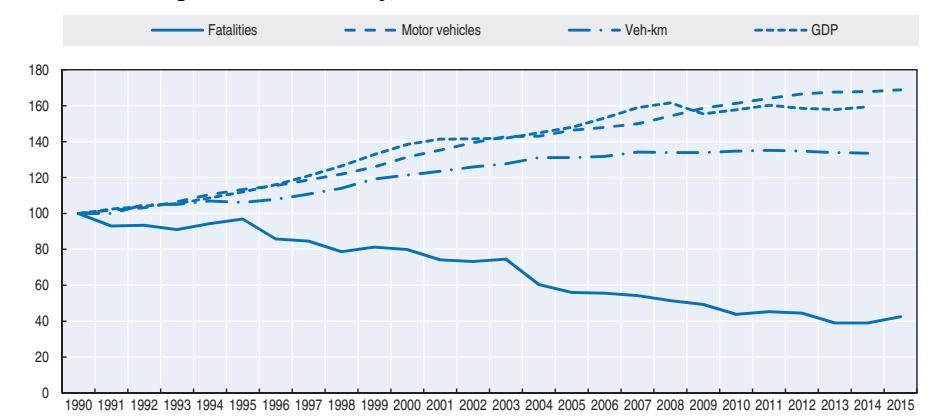
Figure 28.2. Road safety, traffic and GDP trends index 1990 = 100
Note: Source: World Bank for Growth Domestic Product (GDP; constant prices).
Road safety by user group
Over the long term all user groups, but especially car occupants, have benefited from safety improvements.
In the period 2000-14, all crashes involving a passenger car showed a strong decrease in the number of fatalities. The number of pedestrians and moped riders killed decreased by more than 50%. The number of cyclists killed fell by 21%.
In 2014 the number of fatalities was equal to that of 2013. The significant drop among motorcycle riders has been undone. The number of cyclists killed in traffic remains high. Pedestrians were less often killed in traffic. Since 2013 it is possible to report electric bicycles in police crash forms. There were 16 reported fatalities in 2013 and 2014 among E-bikes riders, i.e. 12% of the total number of reported cyclists killed in traffic.
Regarding injuries, many persons are injured in crashes without the involvement of a motor vehicle. While in some countries these victims are not considered as road traffic victims, their number in the Netherlands exceeds the number of those seriously injured in motor vehicle crashes.
In 2014 the actual number of seriously injured (MAIS2+) was 20 700, of which 7 500 were MAIS3+. Half of the seriously injured resulted from bicycle crashes (bicycle alone, bicycle-bicycle, bicycle-pedestrian). Special attention is now being given to this growing group of injured persons.
Road safety by age group
The number of fatalities varies with age. Inexperienced riders and drivers are killed more often in traffic, as are vulnerable road users. People aged over 65 represent another vulnerable group, especially while cycling.
| 2014 % change from | |||||||
|---|---|---|---|---|---|---|---|
| 2000 | 2010 | 2013 | 2014 | 2013 | 2010 | 2000 | |
| Cyclists | 233 | 162 | 184 | 185 | 0.5 | 14.2 | -21 |
| Moped riders | 104 | 43 | 48 | 43 | -10.4 | 0.0 | -59 |
| Motorcyclists | 95 | 63 | 29 | 55 | 89.7 | -12.7 | -42 |
| Passenger car occupants | 543 | 246 | 193 | 187 | -3.1 | -24.0 | -66 |
| Pedestrians | 114 | 72 | 56 | 49 | -12.5 | -31.9 | -57 |
| Others | 77 | 54 | 60 | 51 | -15.0 | -5.6 | -34 |
| Total | 1 166 | 640 | 570 | 570 | 0.0 | -10.9 | -51 |
Table 28.3. Road fatalities by road user group – actual data

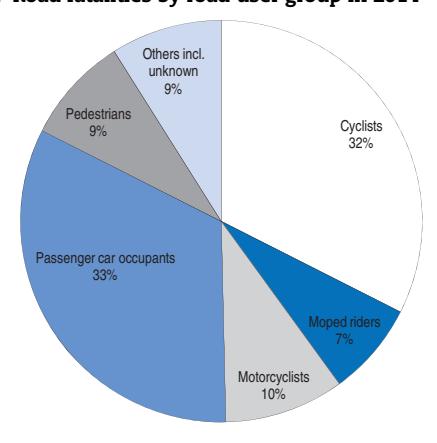
Table 28.4. Road fatalities by age group – actual data
| 2014 % change from | |||||||
|---|---|---|---|---|---|---|---|
| Age group | 2000 | 2010 | 2013 | 2014 | 2013 | 2010 | 2000 |
| 0-5* | 17 | 4 | 3 | 4 | 33.3 | 0.0 | -76 |
| 6-9 | 15 | 5 | 2 | 5 | 150 | 0.0 | -67 |
| 10-14* | 27 | 9 | 4 | 10 | 150 | 11.1 | -63 |
| 15-17 | 57 | 20 | 14 | 17 | 21.4 | -15.0 | -70 |
| 18-20* | 119 | 46 | 39 | 35 | -10.3 | -23.9 | -71 |
| 21-24 | 115 | 52 | 44 | 33 | -25.0 | -36.5 | -71 |
| 25-64 | 548 | 295 | 234 | 223 | -4.7 | -24.4 | -59 |
| 65 | 268 | 209 | 230 | 243 | 5.7 | 16.3 | -9 |
| Total | 1 166 | 640 | 570 | 570 | 0.0 | -10.9 | -51 |
* Fatalities among the 5, 10+11 and 20 year olds have been estimated for the years after 2011.
Road safety by road type
In 2014, 42% of reported fatalities occurred on rural roads, 33% on urban roads and 13% on motorways. For another 11% the road type is unknown. The decrease in fatalities over the last 20 years has been achieved mainly through the improvement of rural roads. Traffic has significantly increased on motorways.
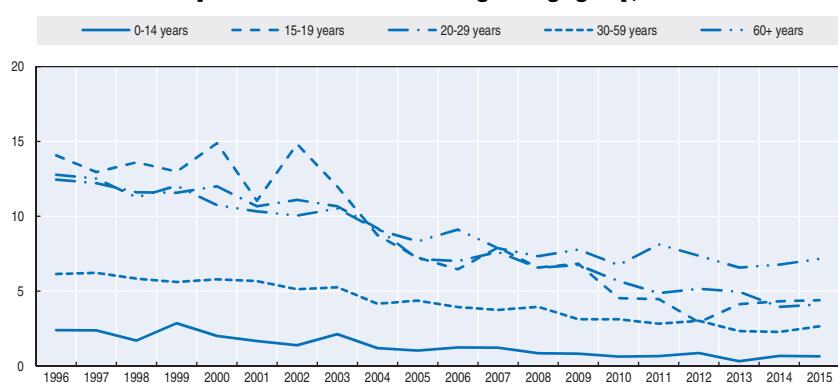
Figure 28.4. Reported road death rates by age group Fatalities per 100 000 inhabitants in a given age group, 1990-2014
Figure 28.5. Reported mortality by age and road user group Fatalities per 100 000 inhabitants in 2014
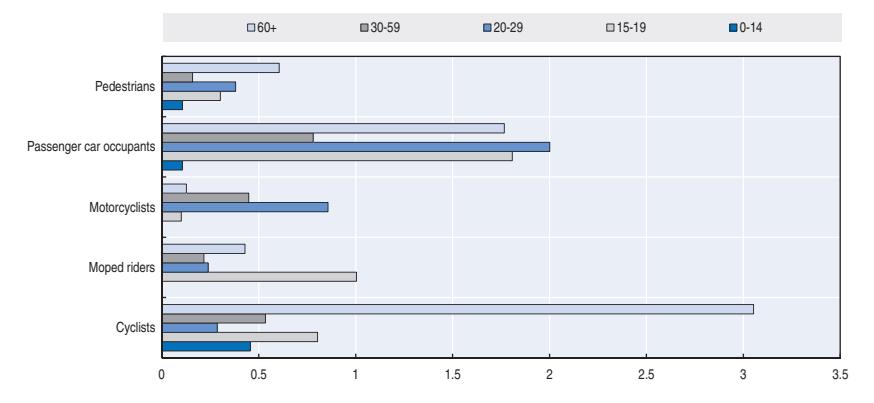
Economic costs of traffic crashes
Traffic crashes represent a significant cost for society, estimated in 2009 at around EUR 13 billion, equivalent to 2.2% of the Dutch gross domestic product (SWOV, 2014). The following six categories have been included in the estimate:
- medical costs
- production loss
- loss of quality of life (based on a willingness-to-pay method)
- property damage
- settlement costs
- congestion costs.
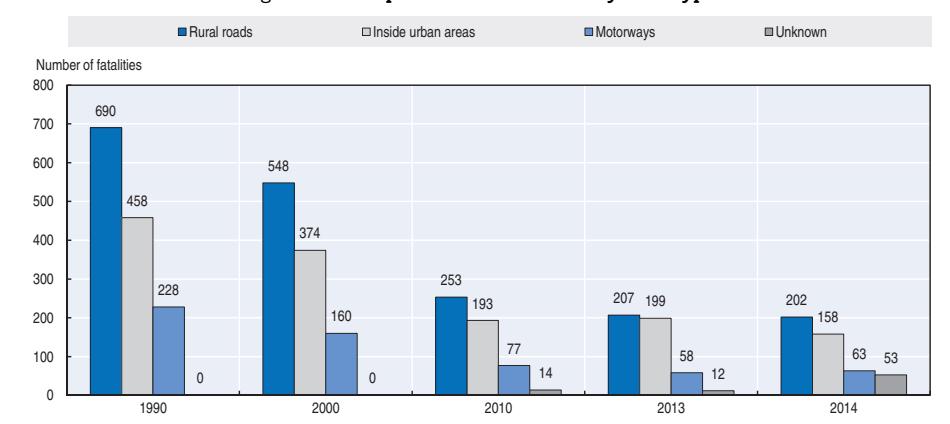
Figure 28.6. Reported road fatalities by road type
Table 28.5. Costs of road crashes, 2009
| Unit | Total | |
|---|---|---|
| Fatalities | EUR 1.9 billion | |
| Serious Injuries (MAIS2+) | EUR 5.2 billion | |
| Slight injuries | EUR 2.1 billion | |
| Property/damage costs | EUR 3.9 billion | |
| Total | EUR 13.1 billion | |
| Total as % of GDP | 2.2% |
Recent trends in road user behaviour
Speed
Between 1 September 2012 and 2015, speed limits were raised to 130 km/h on about 1 200 km of motorways, i.e. half of the motorway network .On these motorways a speed of 130 km/h is allowed during the day and at night (except where speed limits are lowered due to environmental concerns). A trial evaluation of limit change on eight motorway road sections indicated that limit change on most sections was associated with a 2 to 3 km/h increase in mean speed and 2.5 to 3.5 km/h increase for V85 speed (Beenker et al., 2012)
The table below summarises the main speed limits in the Netherlands. For an explanation on the road categorisation Advancing Sustainable Safety see www.sustainablesafety.nl.
Table 28.6. Speed limits by road type, 2016
| Urban access roads | 30 km/h |
|---|---|
| Urban distributor roads | 50 km/h |
| Rural access roads | 60 km/h |
| Rural distributor roads | 80 km/h |
| Through-roads | 100 km/h |
| Motorways | 130 km/h |
Drink driving
Until 2006, the maximum authorised blood alcohol content (BAC) was 0.5 g/l for all drivers of motor vehicles, but in 2006 a lower limit of 0.2 g/l was applied for novice drivers during their first five years. For cyclists the legal limit is also 0.5 g/l. There is no limit for pedestrians.
Alcohol-related fatalities are defined according to the SafetyNet definition: Any death occurring within 30 days as a result of a fatal road crash in which any active participant was found with a blood alcohol level above the legal limit.
In the Netherlands, testing of a deceased person for recent use of psychoactive substances is prohibited. Police reports regarding the use of psychoactive substances by seriously injured road users is not reliable. Regional hospital studies found that in the period 2000-04, 28% of seriously injured drivers had a BAC of 0.5 g/l or more, and in the period 2007-09 this proportion remained the same.
Drugs and driving
Legislation on driving under the influence of illicit drugs was expected to be introduced in 2015 but was postponed to a later date (probably 2017). This legislation entails legal limits being set for five different types of drugs. Furthermore, zero tolerance limits are proposed for combined use of drug-drug and drug-alcohol. Saliva testers and a test on physical features and behavioural characteristics will be made available to police in the Netherlands to enforce the proposed legislation.
Results of hospital studies show that approximately 10% of the seriously injured drivers were positive for illicit drugs. As for alcohol, Dutch legislation prohibits post mortem drug testing.
Distraction
Holding a phone while driving has been illegal in the Netherlands since April 2002. Additional legislation relevant to distracted driving is applicable in cases where behaviour that explicitly endangers road safety is directly observed.
A survey conducted in 2015 among over 900 Dutch car drivers indicated that 61% had never used a hand-held phone while driving in the past 12 months, whereas nearly 5% did so regularly or even at nearly every trip. Almost one-fifth of Dutch drivers reported using a hands-free phone frequently or even nearly every trip. In 2011, slightly over 100 000 Dutch drivers were fined for hand-held phone use while driving, in 2012 about 64 000 drivers and in 2013 about 69 000 drivers. In 2012, the fine for hand-held phone use while driving was increased from EUR 180 to EUR 220.
Phone use is estimated to contribute to 3% to 4% of bicycle crashes involving injuries (Goldenbeld et al., 2010). This excludes listening to music.
Sleepiness and fatigue
A 2015 survey on fatigue among more than 1 500 Dutch car drivers suggests that driver fatigue is considered a widespread problem. Nearly half of Dutch drivers (47%) reported that sleepiness negatively affected their driving performance, 60% said they continued to drive after starting to feel sleepy and 10% continued driving even when the drive took more than one hour. Almost one-quarter took no break when they started to feel sleepy. One in ten Dutch drivers said that they were aware of an increased driving risk from their sleepiness.
Seat belts and helmets
Seat belt use has been compulsory in front seats since 1975 and in rear seats since 1992. At the last national seat belt measurement in the Netherlands in 2010, the rate of seat belt use was above 95% in front and rear seats in passenger cars. For vans (87%) and trucks, the rate of use was lower. No seat belt measurements have been performed since 2010.
Helmet wearing has been compulsory on motorcycles since 1972 and on mopeds (up to 50 cc, maximum speed 45 km/h) since 1975. A helmet is not compulsory on light mopeds (up to 50 cc, maximum speed 25 km/h) and bicycles. The latter moped category constitutes a road safety problem, as these mopeds are regularly modified to much higher maximum speeds.
The proportion of riders wearing a helmet depends on the vehicle type: nearly all motorcycle riders wear helmets. In 2008, 96% of moped riders, but very few light moped riders, wore helmets. The use of moped helmets by passengers has increased and in 2008, 86% wore them. No national monitoring of helmet wearing has occurred since 2008.
National road safety strategies and targets
Organisation of road safety
In the Netherlands, the Ministry of Infrastructure and the Environment (Directorate General Mobility – Roads and Traffic Safety section) is the central agency for road safety, responsible for overseeing and co-ordinating all road safety activities. In particular, it is responsible for:
- Co-ordination of intergovernmental working processes and road safety decision making at the level of central government and co-ordination of national mass media campaigns. Regional and local governments have their own authority over their roads and the safety of their infrastructure. The ministry is responsible for road safety policy and together with decentral governments they set policy targets.
- Periodic review of legislation, rules and standards against best practice; recommendations for improvement; monitoring and evaluation; establishing and supporting data systems used to monitor road safety.
- Compilation and dissemination of national statistics, co-operating with the Ministry of Infrastructure and the Environment, Statistics Netherlands and SWOV.
Road safety strategy for 2008-2020
Road safety policy in the Netherlands is guided by a philosophy of sustainable road safety, based on several key concepts, including that the human being is the reference standard and prevention is preferable to a curative approach. The policy follows five safety principles: road functionality; homogeneity of mass and speed and direction; physical and social tolerance; recognition and predictability of roads and behaviour; and state of awareness.
In 2008, the Road Safety Strategic Plan 2008-2020 (SPV) was developed by the then Ministry of Transport and received support in Parliament. The SPV is based on three cornerstones: co-operation, an integral approach and sustainable safety. Continuation of measures that have proven successful is ensured. Measures to reduce the risk of vulnerable road users and a tougher approach on traffic offenders are among 12 areas of focus. Mobility demands and the social context of road users are taken into account.
In 2012, the strategic plan was revised in agreement with its four-yearly evaluation conducted by SWOV. The Policy Stimulus Road Safety Initiative contains extra measures aimed at road safety improvement for cyclists, elderly road users, infrastructure, and road users in general.
Road safety targets
The current targets in the SPV for 2020 are a maximum of 500 road fatalities and a maximum of 10 600 MAIS2+ road injuries. If current developments and efforts continue, the target for 2020 with respect to fatalities seems feasible. Without additional safety measures it will be very difficult to achieve the target for serious road injuries.
Monitoring
The plan is assessed regularly and adapted if necessary.
A recent SWOV report (Aarts et al.) indicates that it is uncertain, even unlikely, that the targets for traffic fatalities and serious road injuries will be met. SWOV was asked to identify additional measures that could increase the feasibility of the targets. The results have been summarised in a number of possible scenarios concerning choices for road safety in the Netherlands.
The annual assessment report on road safety developments in 2014 observes that the Policy Stimulus Road Safety Initiative has correctly identified cyclists and the over 60s as the most important target groups requiring attention (Duivenvoorden et al., 2015).
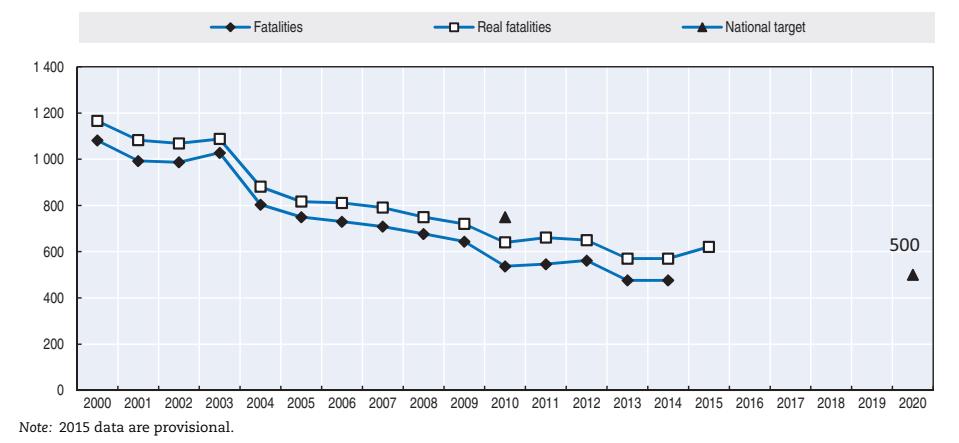
Figure 28.7. Trends in road fatalities towards national target
Recent safety measures (2013-16)
Road safety management
● Mandatory inquiries into fatal crashes on the Trans-European Transport Network are effective as of 1 January 2014.
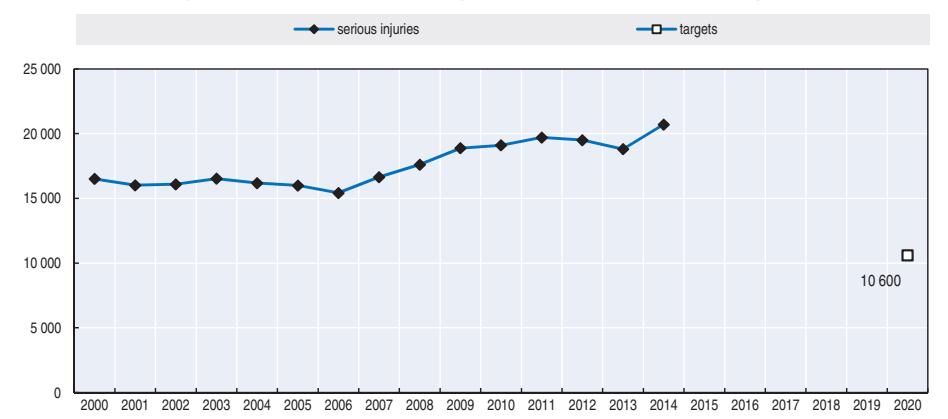
Figure 28.8. Trends in seriously injured towards national target
● Since March 2016, it is possible to self-report road crashes with an app (in IOS and Android). The European Damage Form is no longer required by insurers if all motor vehicles involved are Dutch. Injury crashes and crashes without motor vehicles can also be reported. The police will start to use (a similar version of) this app for their data entry.
Road users
Speed management
● The new limit of 130 km/h on motorways was introduced in September 2012 on 60% of the motorway network. On a third of this length the limit is dynamic, with 130 km/h permitted only between 7 pm and 6 am. On roads with environmental or safety concerns the 120 km/h limit or the 100 km/h limit was maintained. Preliminary analysis in 2014 showed hardly any change in the level of safety, however in 2015 an increased number of fatalities on roads with the 130 km/h-limit was reported. Further investigation will follow.
Enforcement
● Since 1 January 2015 a new regulation has been operative for repeat traffic offenders that enables imposition of higher sanctions if the violation is repeated within a 2 year time frame. Major violations under this new regime include: driving without a licence, dangerous road behaviour, not correctly securing load, driving without a licence plate, ignoring stop signs and using the emergency lane on motorways. Min V&J, 2014).
Education and licensing
● Licensing for driving tractors was changed on 1 July 2015. The category T replaces the T-certificate. This concerns agricultural and forestry tractors and motor vehicles with limited speed. In anticipation of the new category, theoretical and practical examinations to obtain the T certificate have been adapted to emphasise driving on public roads and road safety.
Cycling safety
- The Policy Stimulus Road Safety Initiative contains extra measures aimed at cyclists. It requires municipalities to survey road safety bottlenecks for cyclists and to make plans for improvement containing behavioural measures as well as infrastructural measures. To monitor progress in this domain all municipalities were asked to complete a survey on their cycling policies (Weijermars et al., 2014b, Duivenvoorden et al., 2015).
- The Royal Dutch Touring Club (ANWB) has initiated a project to improve the safety of the cycling infrastructure in the Netherlands – and, in the longer term, also in other countries: the Safe Cycling Network. This project was inspired in part by the international European Road Assessment Programme (EuroRAP/iRAP). The objective is to develop a system of expertise to help road authorities assess cycling infrastructure (and therefore cycling safety). Unsafe cycling infrastructure needs to be surveyed and measures taken.
Mopeds
- The proper place for slow mopeds (speeds no higher than 25 km/h) is an issue: Should they use cycling paths or roadways in urban areas? The ministry has now allowed municipalities to make their own choice.
- Since July 2014 a new rule for the confiscation of a moped licence, in the case of a tunedup moped, has been in operation. This enables police to confiscate the licence when the measured speed of a moped is higher than allowed after a measurement correction (Minister van Veiligheid en Justitie, 2013).
Infrastructure
● Provincial authorities have long-range traffic, transport and mobility plans in which infrastructure measures play an important role. These include reconstruction of risky intersections, construction of roundabouts, safer roadsides, upgrading or downgrading roads to achieve more credible speed limits, more recognisable and uniform road markings, safer cycling facilities, safer cycling crossings, safer cycling paths, and better integration of maintenance and infrastructure improvement.
Vehicles
● The development of passive vehicle safety systems and the increasing penetration rate of safety technologies play an important role in reducing injuries. Recent examples are active bonnet safety systems and airbags on the outside of the vehicle body to protect pedestrians and cyclists in case of a crash.
Post-crash measures
● Trauma care is undergoing regionalisation and Mobile Medical Teams have been introduced, four of which have an air ambulance at their disposal (Weijermars et al., 2014a). These and further improvements in medical care have contributed to the decrease in the number of fatalities in the period 2000-12.
Recent and ongoing research
● Estimating the number of serious road injuries, by linking police and hospital data. Efforts to obtain ambulance data. For further details see Bos, N.M. et al. (2015), Serious road injuries 2014; Estimate of the number of serious road injuries in 2014. SWOV, The Hague, www.swov.nl/ rapport/r-2015-18.pdf.
- Annual monitor of the road safety situation in The Netherlands and evaluation of policies. For further details see Groot-Mesken, J. de et al. (2015) Monitor Policy Stimulus Road Safety 2015. www.swov.nl/rapport/r-2015-20.pdf; Duivenvoorden, C.W.A.E. et al. (2015), Monitor Policy Stimulus Road Safety 2015 – Research justification. SWOV, The Hague, www.swov.nl/ rapport/r-2015-20a.pdf.
- Automated vehicles and taking back control of the vehicle. For further details see Vlakveld, W. (2015), Transition of control in highly automated vehicles. A literature review. SWOV, The Hague, www.swov.nl/rapport/r-2015-22.pdf; Vlakveld, W., L. Vissers, K. Hulleman and N. van Nes (2015), An empirical exploration of the impact of transition of control on situation awareness for potential hazards. SWOV, The Hague, www.swov.nl/rapport/r-2015-23.pdf.
- Road Safety Outlook 2020 and 2030. For further details see Weijermars, W.A.M., F.D. Bijleveld, S. Houwing, H.L. Stipdonk and A. Dijkstra (2015), Road safety forecasts for 2020 and 2030; Estimate of the expected numbers of fatalities and serious road injuries. SWOV, The Hague, www.swov.nl/rapport/r-2015-17a.pdf.
References
- Aarts L.T., R.G. Eenink, W.A.M. Weijermars (2014), Achieving the road safety targets: Exploring the opportunities for increasing the feasibility. SWOV, The Hague, www.swov.nl/rapport/R-2014-37.pdf English summary page 6: www.swov.nl/rapport/R-2014-37a.pdf.
- Beenker, N., B. van Engelenburg and A. van Veluwen (2012), "Verkeerskundige evaluatie proeftrajecten 130 km/h", Nationaal Verkeerskunde Congres, 2012.
- Duivenvoorden, C. et al. (2013), Evaluation of an initiative to reward correct traffic behaviour in the Province of Limburg: Study into the effects of a pilot with individual and collective town area-related rewards for speed behaviour in urban areas, SWOV, Leidschendam, www.swov.nl/rapport/r-2013-07.pdf.
- Goldenbeld, C and S.Houwing (2015), Staandehoudingen in het verkeer, SWOV, Den Haag.
- Goldenbeld, Ch., M. Houtenbos, and E. Ehlers (2010), The use of portable media players and mobile phones while cycling; Results of a large-scale internet survey, SWOV, Leidschendam, www.swov.nl/rapport/r-2010-05.pdf.
- KIM (2013), Mobility Report 2013, Netherlands Institute for Transport Policy Analysis, www.kimnet.nl/ binaries/kimnet/documenten/rapporten/2013/10/29/mobiliteitsbalans-2013/mobiliteitsbalans-2013.pdf.
- KIM (2014), Mobility Report 2014, Netherlands Institute for Transport Policy Analysis, web.minienm.nl/ mob2014/documents/Mobiliteitsbeeld_2014.pdf.
- KIM (2015), Mobility Report 2015, Netherlands Institute for Transport Policy Analysis, web.minienm.nl/ mob2015/documents/Mobiliteitsbeeld_2015.pdf.
- Minister van Veiligheid en Justitie (2013), Toezeggingen en verzoeken verkeershandhaving, Brief aan de Tweede Kamer, 18 november 2013, Kamerstuk 29398, nr. 387, Ministerie van Veiligheid en Justitie, The Hague.
- Minister van Veiligheid en Justitie (2014), Stand van zaken aanpak veelplegers in het verkeer, Brief aan de Tweede Kamer, 25 september 2014, kenmerk 544441, Ministerie van Veiligheid en Justitie, The Hague.
- SWOV (2011), Driver fatigue: prevalence and state awareness of drivers of passenger cars and trucks; A questionnaire study among driving licence holders in the Netherlands SWOV Leidschendam, www.swov.nl/rapport/r-2011-04.pdf.
- SWOV (2012a), Road safety of children in the Netherland,. SWOV Fact sheet, www.swov.nl/rapport/ Factsheets/UK/FS\_Children.pdf.
- SWOV (2012b), Traffic education for children 4-12 years old, SWOV Fact sheet, www.swov.nl/rapport/ Factsheets/UK/FS\_Traffic\_education\_children.pdf.
- SWOV (2012c), Seat belts, airbags and child protection device, SWOV Fact sheet, www.swov.nl/rapport/ Factsheets/UK/FS\_Seatbelts.pdf.
- SWOV (2014), Road crash costs, SWOV Fact sheet, www.swov.nl/rapport/Factsheets/UK/FS\_Costs.pdf.
ROAD SAFETY ANNUAL REPORT 2016 © OECD/ITF 2016 377
- SWOV (2015a). Fear appeals and confronting information campaigns. SWOV Fact sheet, July 2015, www.swov.nl/rapport/Factsheets/UK/FS\_Fear\_appeals.pdf.
- SWOV (2015b). Serious road injuries in the Netherlands. SWOV Factsheet December 2015, www.swov.nl/ rapport/Factsheets/UK/FS\_Serious\_road\_injuries.pdf.
- SWOV (2016). Phone use by cyclists and pedestrians. SWOV Facstheet, January 2016, www.swov.nl/rapport/ Factsheets/UK/FS\_Use\_of\_media\_devices\_cyclists.pdf.
- Van Schagen, I. et al. (2010), Speed measurements during the public information campaign 'Keep to the limit', SWOV, Leidschendam, www.swov.nl/rapport/d-2010-09.pdf.
- Van Schagen, I. and S. de Craen (2014), Accompanied driving put into practice; Survey among 2toDrivers and their coaches. SWOV, The Hague, www.swov.nl/rapport/r-2014-15a.pdf.
- Weijermars, W. et al. (2014a), Road safety assessment 2000-2012; Causes and consequences of road unsafety, SWOV, The Hague, www.swov.nl/rapport/r-2014-24.pdf.
- Weijermars, W. et al. (2014b), Monitor Policy Stimulus Road Safety 2014 Research justification, SWOV, The Hague, www.swov.nl/rapport/r-2014-36a.pdf.
Websites
- SWOV Dutch research institute for safety research: www.swov.nl.
- Ministry of Infrastructure and the Environment www.government.nl/ministries/ministry-of-infrastructureand-the-environment.
- Statistics Netherlands www.cbs.nl.
- Cycling Embassy www.dutchcycling.nl.
Chapter 29
New Zealand
This chapter presents 2014 road safety data for New Zealand along with provisional data from 2015. It looks at trends in traffic and road safety from the years 1990 to 2014 and road user behaviour patterns. This includes data on speed, drink driving, drugs and driving, distracted driving, fatigue and other factors involved in road crashes. The chapter reviews New Zealand's current road safety strategy, "Safer Journeys", along with the most recently implemented safety measures.*
* All data stem from the New Zealand Ministry of Transport and IRTAD unless otherwise noted. For more information please contact w.jones@transport.govt.nz or b.johnston@transport.govt.nz.
Since 2010, New Zealand, with its population of 4.6 million, has implemented a new road safety strategy, "Safer Journeys", based on the Safe System approach, which, along with its action plans, will address road safety issues up until 2020.
Following a period of positive developments in road safety, 2014 data and initial results from 2015 show a negative trend developing, with 295 deaths in 2014, a 16.6% increase in fatalities over 2013. Provisional data from 2015 show an additional 9% increase in road deaths with the likelihood of this trend continuing into 2016. No clear explanation for this reversal has yet been identified.
Road safety data collection
Definitions applied in New Zealand
- Road fatality: Any person killed immediately or dying within 30 days as a result of a road crash.
- Serious injuries: Fractures, concussion, internal injuries, crushing, severe cuts and lacerations, severe general shock necessitating medical treatment, and any other injury involving removal to and detention in hospital, as recorded in police records.
- Minor injuries: Injuries such as sprains and bruises.
Data collection
New Zealand road crashes are usually attended by police officers. Police complete traffic crash reports, which are forwarded to the New Zealand Transport Agency to be coded and the information entered into the Crash Analysis System.
Fatal crashes are all reported. When a traffic crash results in injuries, the law requires that the crash be reported, but comparisons with hospital data indicate that only about two-thirds of such crashes are reported to the New Zealand Transport Agency.
Statistical linking is done to derive reporting rates needed to calculate social costs of crashes.
Most recent safety data
Road crashes in 2015 – provisional data
In the 12 months to the end of December 2015, 320 people died on New Zealand roads. This represents a 9% increase compared to the same period in 2014.
2015 is the second consecutive year with a marked increase in the number of road fatalities. Since 2013, the number of road deaths has increased by 26%. While this increase needs to be analysed in the light of the good results of 2013 (when the lowest toll since 1952 of 295 fatalities was reached), it represents nevertheless a worrying trend. Preliminary data as of 31 March 2016 shows a 12% increase when compared to the same period in 2015.
There is no immediate reason to explain this increase. There have been increases in the amount of travel in the last two years but the increase in the road fatality toll is much larger.
Road crashes in 2014
In 2014, 295 people lost their lives in a traffic crash, a 16.6% increase when compared to 2013. The number of injury crashes, however, decreased by 5%.
2014 was the midpoint for the second action plan for New Zealand's road safety strategy to 2020, "Safer Journeys". There is an increasing awareness of the importance of the role that technology will play in road safety in the near and medium-term future. Preparatory work began to ensure the regulatory framework is not an inadvertent barrier to its uptake. The third action plan is likely to reflect this.
Trends in traffic and road safety (1990-2014)
Traffic
Between 1990 and 2014, the number of motorised vehicles increased by 55%. Since 2000, the number of registered vehicles increased by 31% and the overall vehicle kilometres driven by 23%. However, since 2007, there has been a marked slowdown in the growth of road traffic. This has begun to pick up again with an increase of 2.3% from 2013 to 2014.
Figures for 2014 indicate that the vehicle fleet has increased by nearly 3% from 2013. Provisional fleet figures show a further increase from 2014 to 2015 of over 3%.
Road safety
Crashes and casualties
Between 1990 and 2014, the number of fatalities decreased by 60%. Fatalities declined by 36% between 2000 and 2014. The reported number of injury crashes has increased since 2000, which can be partly attributed to better crash reporting by the police after 2001. However, injury crashes have decreased over the last six years.
New Zealand has made substantial changes to land transport policy since 1990 to reduce road trauma. Main measures include:
- graduated driving licence system and a photo licence
- compulsory breath testing carried out through road side testing
- speed cameras
- new drug driving laws
- increased penalties for serious offences
- increased minimum driving age from 15 to 16 years
- lowered blood alcohol concentration to zero for drivers less than 20 years of age and to 0.5 g/l for drivers 20 and over
- introduction of alcohol interlocks as part of the penalty regime
- development of a speed management programme.
The development and subsequent implementation of the "Safer Journeys" strategy adopted in 2010 and based on the Safe System approach has been a major change in the way New Zealand addresses road safety. (See road safety strategy section below)
Rates
Between 1990 and 2014, the mortality rate, expressed in terms of deaths per 100 000 population, decreased by 69%. In 2014, it was at 6.5.
Road safety by user group
All user groups have benefited from improvement since 1990.
Since 2000, there is a mixed picture. There has been a marked decrease in the fatalities among cyclists (-47%) and car occupants (-49%); however the number of motorcyclists and pedestrians killed increased significantly (respectively by 39% and 23%). The increase in
| 2014 % change from | |||||||||
|---|---|---|---|---|---|---|---|---|---|
| 1990 | 2000 | 2010 | 2013 | 2014 | 2013 | 2010 | 2000 | 1990 | |
| Reported safety data | |||||||||
| Fatalities | 729 | 462 | 375 | 253 | 295 | 16.6 | -21.3 | -36.1 | -59.5 |
| Injury crashes | 12 818 | 7 830 | 10 886 | 9 348 | 8 882 | -5.0 | -18.4 | 13.4 | -30.7 |
| Injured persons hospitalised | 5 718 | 3 054 | 2 881 | 2 833 | 2 672 | -5.7 | -7.3 | -12.5 | -53.3 |
| Deaths per 100 000 population | 21.4 | 12.0 | 8.6 | 5.7 | 6.5 | 15.6 | -23.8 | -45.4 | -69.4 |
| Deaths per 10 000 registered vehicles | 3.3 | 1.8 | 1.2 | 0.8 | 0.9 | 13.4 | -25.2 | -51.1 | -73.8 |
| Deaths per billion vehicle kilometres | 13.6 | 9.4 | 6.2 | 7.1 | 14.0 | -24.5 | -48.1 | ||
| Traffic data | |||||||||
| Registered vehicles1 (thousands) | 2 198 | 2 602 | 3 231 | 3 305 | 3 398 | 2.8 | 5.2 | 30.6 | 54.6 |
| Vehicle kilometres (millions) | 33 856 | 39 980 | 40 703 | 41 632 | 2.3 | 4.1 | 23.0 | ||
| Registered vehicles per 1 000 population | 645 | 674 | 740 | 739 | 753 | 1.9 | 1.9 | 11.7 | 16.9 |
Table 29.1. Road safety and traffic data
1 2 http://dx.doi.org/10.1787/888933385602
40 60 80 100 140 160 180 200 Fatalities Injury crashes Motor vehicles GDP
Figure 29.1. Road safety, traffic and GDP trends index 1990 = 100
Source: World Bank for Gross Domestic Product (GDP; constant prices).
motorcyclists' mortality is due in part to an increase in motorcycle ownership and to the increasing power of motorcycles being purchased.
1990 1991 1992 1993 1994 1995 1996 1997 1998 1999 2000 2001 2002 2003 2004 2005 2006 2007 2008 2009 2010 2011 2012 2013 2014 2015
In 2014, the situation deteriorated for all road users, and in particular for pedestrians, with 13 more deaths and for passenger car occupants, with 16 more deaths.
Road safety by age group
Since 1990, the reduction in fatalities has benefited all age groups; however, the improvement for the elderly was much smaller than the other age groups. This is partly explained by demographic changes. Since 2000, the over 65 age group has risen from 15% to 18% of the population and from 12% to 15.5% of driver licence holders. The elderly are particularly vulnerable as pedestrians.
In 2014, the number of fatalities increased among all age groups except the 15-20 year olds.
1. Registered vehicles excluding mopeds.
Table 29.2. Road fatalities by road user group
| 2014 % change from | |||||||||
|---|---|---|---|---|---|---|---|---|---|
| 1990 | 2000 | 2010 | 2013 | 2014 | 2013 | 2010 | 2000 | 1990 | |
| Cyclists | 27 | 19 | 10 | 8 | 10 | 25.0 | 0 | -47.4 | -63.0 |
| Motorised two wheeler users | 114 | 31 | 50 | 39 | 43 | 10.3 | -14.0 | 38.7 | -62.3 |
| Passenger car occupants | 465 | 358 | 259 | 166 | 182 | 9.6 | -29.7 | -49.2 | -60.9 |
| Pedestrians | 104 | 35 | 35 | 30 | 43 | 43.3 | 22.9 | 22.9 | -58.7 |
| Others | 19 | 19 | 21 | 10 | 17 | 70.0 | -19.0 | -10.5 | -10.5 |
| Total | 729 | 462 | 375 | 253 | 295 | 16.6 | -21.3 | -36.1 | -59.5 |
Figure 29.2. Road fatalities by road user group in percentage of total 2014
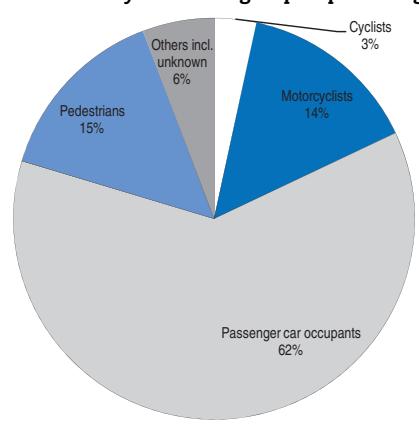
The fatality rate of young people aged 18-20 is very high (12 deaths per 100 000 inhabitants), twice the rate of the average population, but this was a significant decrease over 2013 (from 16 to 12).
Table 29.3. Road fatalities by age group
| | | | | | | 2014 % change from | | | | | |-------|------|------|------|------|------|--------------------|-------|-------|-------|--| | Age | 1990 | 2000 | 2010 | 2013 | 2014 | 2013 | 2010 | 2000 | 1990 | | | 0-14 | 52 | 41 | 18 | 6 | 12 | 100.0 | -33.3 | -70.7 | -76.9 | | | 15-17 | 65 | 36 | 26 | 13 | 10 | -23.1 | -61.5 | -72.2 | -84.6 | | | 18-20 | 108 | 34 | 41 | 30 | 24 | -20.0 | -41.5 | -29.4 | -77.8 | | | 21-24 | 131 | 42 | 46 | 20 | 27 | 35.0 | -41.3 | -35.7 | -79.4 | | | 25-64 | 290 | 232 | 175 | 128 | 153 | 19.5 | -12.6 | -34.1 | -47.2 | | | 65 | 65 | 76 | 69 | 54 | 60 | 11.1 | -13.0 | -21.1 | -7.7 | | | Total | 729 | 462 | 375 | 253 | 295 | 16.6 | -21.3 | -36.1 | -59.5 | |
Road safety by road type
In 2014, 72% of fatalities occurred on rural roads. Improvements over the last 30 years have been faster on urban roads and motorways.
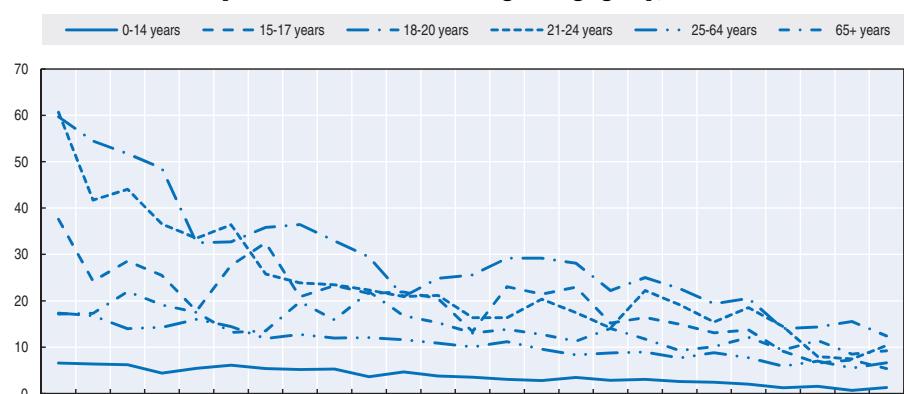
Figure 29.3. Road fatality rates by age group Deaths per 100 000 inhabitants in a given age group, 1990-2014
Figure 29.4. Road fatality rate by age and road user group Fatalities per 100 000 inhabitants, 2014
1990 1991 1992 1993 1994 1995 1996 1997 1998 1999 2000 2001 2002 2003 2004 2005 2006 2007 2008 2009 2010 2011 2012 2013 2014
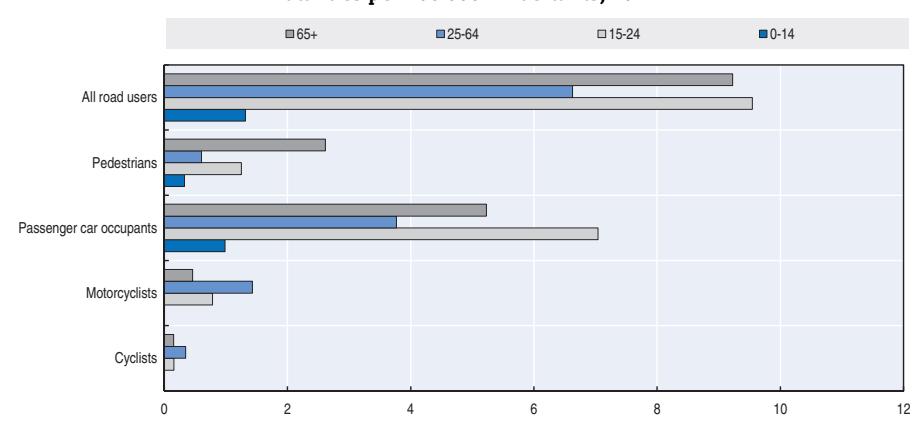
Economic costs of traffic crashes
In New Zealand, the social cost of a road crash or a road injury includes the following components:
- loss of life and life quality
- loss of output due to temporary incapacitation
- medical costs
- legal costs
- vehicle damage costs.
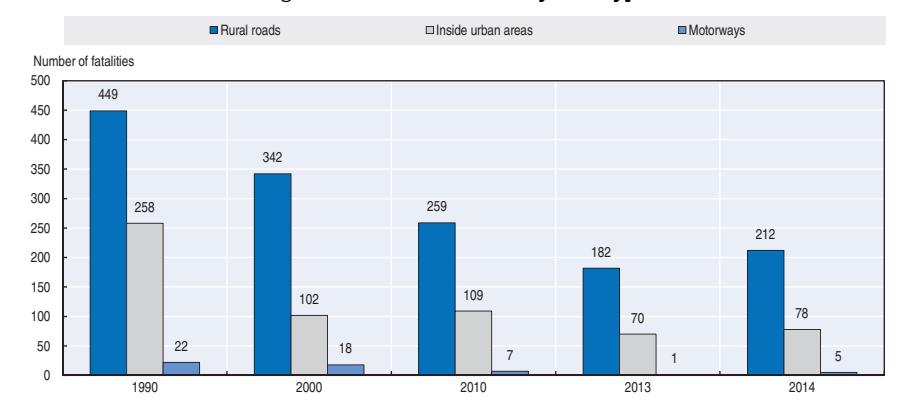
Figure 29.5. Road fatalities by road type
Social cost components are either measurable or can be estimated in dollar terms. A "willingness-to-pay" valuation technique is used to express pain and suffering from loss of life or life quality in dollar terms. Various methodologies have been developed to estimate the value of other social cost components.
The New Zealand Ministry of Transport released its report "Social Cost of Road Crashes and Injuries 2015" in March 2016. The total social cost of motor vehicle injury crashes in 2014 is estimated at NZD 3.47 billion, at June 2015 prices. This represents an increase of 5.8% compared to the previous year.
Loss of life and/or life quality due to permanent impairment accounted for approximately 91% of the total social cost of injury crashes. Vehicle damage accounted for around 5%, and other cost components (medical costs, legal and court costs and loss of output costs) for around 4%.
Full information is provided at: www.transport.govt.nz/assets/Uploads/Research/ Documents/Social-cost-of-road-crashes-and-injuries-2015-update.pdf (accessed 18 April 2016).
| Unit cost1 | Total2 | |
|---|---|---|
| Fatalities | NZD 4.095 million | 1.20 billion |
| Serious injuries | NZD 430 400 | 1.58 billion |
| Slight injuries | NZD 23 000 | 0.69 billion |
| Total cost of injuries | 3.47 billion | |
| Property damage crashes | NZD 3 000 | 0.59 billion |
| Total | 4.06 billion |
Table 29.4. Costs of road crash injuries and crashes, 2014
Recent trends in road user behaviour
Speed
The tables below illustrate the main speed limits in New Zealand and the percentage of drivers above the speed limit. Much progress has been accomplished since 2001 in
1. The unit costs for injuries includes the cost of associated property damage.
2. The total cost includes an allowance for under reporting of crashes.
reducing the number of violations. However, nearly half (46%) of drivers exceed the 50 km/h limit in urban areas, which is worrying for ensuring the safety of vulnerable road users.
In 2014, speed was a contributing factor in 28% of road fatalities.
Table 29.5. Passenger car speed limits by road type, 2016
| General speed limit | Comments | |
|---|---|---|
| Urban roads | 50 km/h | The general urban limit is 50 km/h but specific sections may have higher or lower limits |
| Rural roads | 100 km/h | The general open road speed limit is 100 km/h but specific rural roads may have lower limits. |
| Motorways | 100 km/h |
Table 29.6. Percentage of drivers above the posted speed limit
| Speed (survey unimpeded speeds) | 2005 | 2010 | 2015 |
|---|---|---|---|
| % exceeding open road 100 km/h limit | 36 | 29 | 23 |
| % exceeding urban 50 km/h limit | 63 | 58 | 46 |
Drink driving
In 2014, New Zealand lowered the blood alcohol content (BAC) level from 0.8 g/l to 0.5 g/l. Drivers with a BAC over 0.8 g/l must appear in court; a BAC between 0.5 g/l and 0.8 g/l results in an infringement fee and demerit points. In 2011, a zero drink-drive limit was introduced for drivers under 20. The earlier limit was 0.3 g/l.
Alcohol related road deaths are those in which any motor vehicle driver was found with a blood alcohol level above the legal limit, or where the reporting officer suspected alcohol was a contributing factor. Over a quarter of road fatalities are attributed to an alcohol related crash.
Table 29.7. Road deaths in alcohol related crashes
| Road deaths in alcohol related crashes | 2000 | 2005 | 2010 | 2012 | 2013 | 2014 |
|---|---|---|---|---|---|---|
| Number of deaths in alcohol crashes | 103 | 106 | 119 | 93 | 67 | 70 |
| Proportion of total road traffic deaths | 22% | 26% | 32% | 30% | 26% | 24% |
Drugs and driving
Drug related crashes include crashes where the reporting officer suspected drug use was a contributing factor based on the crash investigation. In 2014, there were 11 road deaths (4%) for which the presence of drugs was found.
A number of recent studies have been undertaken on the issue of drugs and driving.
Table 29.8. Road deaths in drug related crashes
| Road deaths with drugs | 2000 | 2005 | 2010 | 2012 | 2013 | 2014 |
|---|---|---|---|---|---|---|
| Number with alcohol and drugs | 4 | 14 | 9 | 10 | 4 | 4 |
| Number with drugs no alcohol | 6 | 9 | 25 | 9 | 10 | 7 |
| Total number with drugs | 10 | 23 | 34 | 19 | 14 | 11 |
| Proportion of total road deaths | 2% | 6% | 9% | 6% | 6% | 4% |
Distraction
Diverted attention includes a range of activities where drivers' attention is directed away from safe driving towards competing events, objects or people, inside or outside the vehicle. 'Attention diverted by' is largely synonymous with distraction, and in the Crash Analysis System covers activities such as: talking with passengers, using cell phones, eating and drinking, reaching or searching for objects in the vehicle, adjusting vehicle controls, adjusting the radio/in-vehicle entertainment system and changing CDs/cassettes, smoking, etc.
The Land Transport Road User Rule was amended in August 2009 to include a ban on the use of hand-held mobile phones while driving. Based on police records, fatal crashes due to the use of cell phones are not frequent. Mobile phone use continues to be a problem with 60% of New Zealand drivers admitting to using their phone while driving. Publicity campaigns addressing the problem were introduced in 2015.
Table 29.9. Road deaths due to the use of mobile phones while driving
| 2000 | 2005 | 2010 | 2012 | 2013 | 2014 | |
|---|---|---|---|---|---|---|
| Deaths due to the use of mobile phone | 2 | 10 | 6 | 3 | 1 | 3 |
Fatigue and sleepiness
In 2014 fatigue was identified as a contributing factor in 31 fatal crashes, which resulted in 33 deaths (11%).
Table 29.10. Road deaths in a fatigue related crash
| 2000 | 2005 | 2010 | 2012 | 2013 | 2014 | |
|---|---|---|---|---|---|---|
| Deaths with fatigue | 70 | 51 | 56 | 46 | 32 | 33 |
| Proportion of deaths with fatigue | 15% | 13% | 15% | 15% | 13% | 11% |
Seat belts and helmets
Seat belt use has been compulsory in front seats since 1972 and in rear seats since 1979.
In November 2013, the mandatory use of child restraints in vehicles was extended by two years, with all children required to be correctly secured in an approved restraint until they reach the age of seven.
Based on a roadside survey conducted in 2014, the rate of seat belt use is about 97% in front seats, 92% for adults in rear seats, and 93% for children in appropriate child restraints. In the three years 2011 to 2013, 31% of road crash fatalities were not wearing a safety belt.
Helmet wearing has been compulsory on motorcycles since 1956 if travelling over 50 km/h, and since 1973 at all speeds. Compliance is virtually 100%. Helmet wearing has been compulsory on mopeds (up to 50 cc, maximum speed 45 km/h) since 1973.
A helmet has been compulsory on bicycles since 1994.
Table 29.11. Seat belt wearing rate by car occupants and helmet wearing by cyclists
| % | |||||
|---|---|---|---|---|---|
| 2005 | 2010 | 2012 | 2014 | 2015 | |
| Seat belts used/Helmets worn | |||||
| Adult front seat | 95 | 96 | 96 | 97 | - |
| Adult rear seat | 86 | 88 | - | 92 | - |
| Child restraint – under 5 years | 89 | 93 | 92 | 93 | - |
| Bicycle helmets | 91 | 93 | 92 | - | 94 |
National road safety strategies and targets
Organisation of road safety
Road safety in New Zealand is managed through five transport partners. The Ministry of Transport is the government's principal transport policy adviser and has a dedicated team for road safety policy. The Ministry is the lead agency for road safety.
The New Zealand Transport Agency is a Crown agency responsible for the planning and funding of land transport. It produces road safety campaigns and implements road safety policy, integrating road safety aspects into road design and maintenance. It is responsible for developing, constructing, maintaining and operating the State highway network.
The New Zealand Police are responsible for road policing and enforcement. The Accident Compensation Corporation provides "no fault" cover for anyone in New Zealand who is injured in or by a motor vehicle on a public road. It has a major role in accident prevention activities.
Local government is responsible for developing, maintaining and operating the network of local roads, including setting of speed limits and delivering public transport infrastructure and services. Decisions about construction, maintenance and management of the road networks must consider safety.
In 1993, road safety policy development was separated from delivery with the creation of a new entity called the Land Transport Safety Authority, now called the New Zealand Transport Agency. Around the same time, traffic policing was merged into the New Zealand Police.
Road safety strategy for 2010-20
"Safer Journeys" is New Zealand's Road Safety Strategy 2010–2020, which was released in March 2010. The strategy's vision is a safe road system increasingly free of death and serious injury, and introduces the Safe System approach to New Zealand.
The government released a 2011-12 Action Plan outlining actions to help achieve the Safer Journeys' objectives. The action plan assigns responsibility to specific agencies, and progress is monitored by the National Road Safety Committee. A second action plan for 2013-15 was completed in 2015 and a third action plan for 2016-20 was released in May 2016. An interim evaluation was undertaken in 2015. In summary, the evaluation found that "Safer Journeys" was a professionally developed, well regarded, sound road safety strategy, supported by action plans and that it was having a significant and positive impact on the wider road safety partnership; achieving good to excellent results in its priority areas. It recommended that the next action plan focus on motorcycle safety, heavy vehicle and workplace safety, pedestrian and cyclist safety, and technology. The 3rd Action Plan was informed by this evaluation.
Road safety targets
The Road Safety Strategy 2010-2020 does not include a general fatality target, but has several sub-targets and performance indicators.
Monitoring
Crash outcomes and road user behaviour that relate to Safer Journeys' focus areas are regularly monitored. Other targeted studies are carried out for specific areas such as young driver crashes.
Recent safety measures (2013-16)
Road safety management
Safe System
A series of "signature projects" started in 2014 for challenging public and private, national and regional issues. The Safer Journeys Signature Programme was one of the key actions in the second Safer Journeys Action Plan 2013-15. The programme has a learning focus and demonstrates innovation, while giving effect to safe system principles with the ultimate aim of reducing road casualties. There are currently three projects in the Programme, which involve a number of organisations working in partnership:
- Visiting Drivers Project aims to improve road safety for all road users including visitors (domestic and international) while maintaining New Zealand's reputation as an attractive and safe tourist destination.
- Future Streets Project aims to make cost effective changes to urban streets that improve road safety and make walking and cycling easier and safer.
- Behind the Wheel Mangere/Young Drivers Project aims to support young people to become safe and fully licensed drivers.
A fourth project focused on rural road safety was formally disestablished by the National Road Safety Committee in September 2015. A review of the project identified key lessons learnt including the importance of partners reaching a shared understating of problems and goals, the need for effective project governance and leadership, and communicating effectively with stakeholders and the wider the community.
A Safe System film was released in November 2014 to change approaches to and understanding of road safety: www.saferjourneys.govt.nz/about-safer-journeys/the-safesystem-approach/.
Some 400 sector professionals around New Zealand have been trained in the Safe System approach to road safety.
Driving licence
- Time limits of five years were applied to learner and restricted driver licences in 2014.
The NZ Transport Agency and the Accident Compensation Corporation have collaborated over the past 18 months to replace the "Practice" programme, that helps people to earn their restricted licence, with a new online learning tool for young drivers
www.drive.govt.nz. This will be launched officially in mid June 2016. It covers the full graduated licence from pre-learner to full licence. It is designed to work best on mobile phones and tablets and is packed full of helpful tools and content that will make learning the road rules, and learning to drive, easy and fun.
A review of the driver licensing system was undertaken in 2015-16 looking at modernising the system by making it more customer-focused and reducing compliance costs. Proposals for public consultation closed in June 2016 and law changes are expected in 2017.
Speed management
- A speed management programme called Safer Speeds includes a new framework to align travel speeds with road function, design, safety and use. Geospatial data provided mean speeds and traffic volumes for every public road in New Zealand, which was analysed with accident rates. Implementation of some of the proposals will get underway in 2016.
- The full network of new generation digital static cameras is being gradually expanded. There will be a total of 56 new cameras rotated around up to 200 locations with a history of speed-related crashes. Cameras will be switched on as they are put in place. The network will be fully operational in 2016.
- An innovative new approach to behaviour change called "Change the Conversation on Speed" was developed in 2015, with implementation beginning in 2016.
- A trial of variable speed limits near rural schools was completed. Results indicate that variable speed limits are an effective tool for managing the risk of crashes involving turning vehicles. Work is underway to develop criteria for wider use of such speed limits.
Road users
Child restraints
● On 1 November 2013, new child restraint laws came into effect. The mandatory use of child restraints in vehicles was extended by two years, with all children required to be correctly secured in an approved restraint until their seventh birthday.
Impaired driving
● The New Zealand government lowered the blood alcohol limit for driving from 0.8 g/l to 0.5 g/l for drivers aged over 20 years of age on 1 December 2014.
Cycling safety
● A Cycling Safety Panel was created in response to a 2013 Coronial Inquiry, which investigated 13 cycling fatalities. The panel made 35 recommendations for central and local government. The NZ Transport Agency published a cycle safety action plan "Making cycling safer and more attractive". Highlights included the delivery of complete urban cycle networks, nationally consistent design guidance for cycle facilities, the safer speeds programme, and review of the land transport rules including an investigation into a minimum overtaking gap when passing cyclists. In 2015, a number of new high quality cycle routes were completed as part of the Urban Cycleway Programme.
Visiting drivers
● Over the last few years, crashes involving visiting drivers, particularly those from overseas, have gained considerable media and public attention. The Visiting Drivers Project, one of the Signature projects, was established with the aim of improving road safety for all road users including visitors (both domestic and international), while maintaining New Zealand's reputation as an attractive and safe tourist destination. To date the Visiting Drivers Project has delivered a range of initiatives focused on road safety at each stage of a visitor's holiday – planning, booking, in-flight, arriving in New Zealand and when actually on New Zealand's roads. Further initiatives at each stage are planned over the next 2 years. The project is a partnership with the tourism industry, rental car companies, local authorities as well as government transport partners: NZTA, Police and the Ministry of Transport as well as agencies concerned with tourism.
● A trial of Bluetooth technology is planned to get underway in July 2016 on one of the main tourist routes in the South Island. It will trial the use of real time messaging to visiting drivers using Bluetooth technology project. Around 50 roadside transmitters are being installed on the main highway between Christchurch and Queenstown. The transmitters will send safety messages using to dedicated devices fitted to rental vehicles of volunteers opting into the trial.
Infrastructure
- A classification system for the entire road network categorises roads according to their function and sets a consistent and predictable level of service for each category. This can help drivers understand what to expect and how to behave on different categories of road.
- A demonstration ("Signature") project has been completed on roads with a particularly high level of motorcycle accidents, using high risk motorcycle threshold signs, motorcycle safety billboards and other safety improvements.
- Investment in operations and maintenance associated with safety improvements will be prioritised to ensure optimal road safety.
- In 2013 a high-risk intersection programme was developed and launched. The 100 highest risk intersections were identified. By the end of 2015, 40 intersections were completed and a further 13 were nearing completion. .
- A booklet entitled "Making Roads Motorcycle Friendly" was produced in 2014 by the New Zealand Transport Agency and the Motorcycle Safety Advisory Council, and it was distributed through sector workshops early in 2015.
- Investigative work was carried out during 2014 by Auckland Transport on their urban arterial routes, and used to update the Safer Journeys for Motorcycling Guide.
Vehicles
Since 2013, New Zealand has been investigating options to encourage less safe vehicles to exit the vehicle fleet. Cost benefit analysis indicated that it was not cost effective to provide incentives. The project was developed to assess actions that support the natural attrition of less-safe vehicles. These included:
- ❖ Providing targeted advice on easy exit and replacement choices for vehicles that do not pass an annual inspection.
- ❖ Providing personalised information with relicensing letters that explain easy replacement and exit options for people with less-safe vehicles that have travelled over 200 000 km.
- ❖ A campaign identifying less-safe vehicles.
Electronic Stability Control (ESC) is mandatory on all new and used imported vehicles progressively from 1 July 2015. By 2020, every light vehicle entering the New Zealand fleet will have ESC.
The Vehicle Standards Map describes the vehicle technologies and performance standards that government transport officials believe have the greatest potential to improve the safety and resource efficiency of vehicles in New Zealand. Transport officials will use the map to help decide which vehicle features should be promoted or mandated. The map will also keep stakeholders such as road users and the vehicle industry up to date with vehicle policy developments.
Recent and ongoing research
The following are safety research projects undertaken in 2015 under NZTA's research programme:
- human factor considerations for driver licensing point system
- the crash performance of seagull intersections and left turn slip lanes
- safety risks and interventions for cyclists and best practice for cycle skills training for both adults and children.
Projects approved in 2016 are:
- risky drivers: alternatives to traffic infringements for young and persistent offenders
- post impact care
- drivers' response to warning applications
Research reports from the New Zealand Transport Agency can be downloaded at: www.nzta.govt.nz/resources/research/reports.
References
Websites
- New Zealand Transport Agency (NZTA): www.nzta.govt.nz.
- New Zealand's road safety strategy to 2020: www.saferjourneys.govt.nz.
- New Zealand Road Assessment Programme KIWIRAP: www.kiwirap.org.nz.
Chapter 30
Nigeria
This chapter presents 2014 and 2015 road safety data from Nigeria. It looks at trends in traffic and road safety and road user behaviour patterns. This includes data on speed, drink driving, drugs and driving, distracted driving, fatigue and seat belt usage. The chapter reviews Nigeria's road safety strategy and national targets along with details of recently implemented safety measures and research undertaken.*
* The Federal Road Safety Corps (FRSC) joined the International Road Traffic and Accident Database (IRTAD) group in 2014. Data included in this report have not been validated by IRTAD. All data stem from Federal Road Safety Corps (FRSC) unless otherwise noted. For more information please contact: ACM Kayode Olagunju Ph.D, ky.olagunju@frsc.gov.ng.
In 2015, Nigeria recorded 5 440 road fatalities, a 9.3% reduction compared to 2014. This is the second consecutive year of reductions in the number of reported road deaths. The national road safety strategy 2014-18 is based on the United Nations Plan for the Decade of Action for Road Safety and its five strategic pillars.
Road safety data collection
Definitions applied in Nigeria
- Road crash: Collision involving one or more vehicles or a moving vehicle and a stationary vehicle or object or pedestrian resulting in a death, injury, damage to a vehicle or loss of physical property.
- Road fatality: Death of a person within 30 days of the crash.
- Injury crash: Crash that results in a person or persons sustaining severe or minor injuries but not leading to death.
- Serious injury: Any road traffic crash victim with open or bleeding wounds.
Data collection
Road safety data in Nigeria is collected at the scene by road safety personnel who had been on patrol or were called to the scene via the toll-free emergency call centre or by other means. Police personnel also collect crash data during investigations.
Previously, data information officers of the Federal Road Safety Corps (FRSC) collected, collated and forwarded data to sector commands at the state level. Sector commands collected and forwarded collated data from local level to zonal headquarters. Zonal commands forwarded validated crash data to road safety headquarters for analysis.
Now, the Federal Road Safety Corps digitises the data collection process with computers and hand-held tablets at the scene of a crash, and data arrives directly into the FRSC data portal (www.frscrtcis.com.ng/). The Portal is designed to accommodate inputs from other data collection agencies such as the Vehicle Inspection officers, State Traffic agencies, hospitals. The portal can sieve the data to avoid multiple entries. This arrangement of data harmonisation comes under the National Committee on Crash Information System (NACRIS).
The National Crash Report Information System was inaugurated in April 2014 to harmonise all traffic crash data in Nigeria from the different agencies including the police, the Ministry of Health (hospital data), the vehicle inspection unit and state traffic agencies.
Gaps still exist in the data collection as not all crashes are recorded, especially in places not regularly covered by the patrol teams of the FRSC and the police. The World Health Organization estimates the actual number of road fatalities could be up to 7 times higher than figures reported to FRSC (WHO, 2015).
To address this issue, data information officers regularly visit these areas and collect missing data, but this is expensive. Within the IRTAD programme, a twinning between FRSC and the UK Department for Transport (DfT) was launched in 2016 to review in greater depth the current national crash data system in Nigeria and develop a 3-year programme to enhance it. The World Bank has also engaged a consultant to develop a road traffic crash data management system.
Most recent safety data
Road crashes in 2015
In 2015, FRSC reported 5 440 road fatalities, a 9.3% reduction compared to 2014.
Road crashes in 2014
In 2014, 5 996 road fatalities were reported to FRSC, indicating an improvement of 8% compared to road fatalities reported in 2013.
Trends in traffic and road safety (1990-2015)
Traffic
Mobility in Nigeria is mainly by road, which has led to an over-dependence and increased pressure on the road infrastructure system. The railway system is disorganised, although rail services have improved in some parts of the network. Air travel is costly and not an option for mass transportation. The government needs to invest heavily in improving road conditions.
Vehicle ownership has increased. Powered three-wheelers are increasingly used for commercial transport, and motorcycle use is increasing.
Road safety
There is wide fluctuation in the yearly number of crashes and casualties, mainly due to a non-systematic recording of road crashes. It is expected that the efforts currently deployed to digitise the processing of crash records and the twinning with the UK DfT as well as the engagement of a World Bank consultant will contribute to a better reporting system and more accurate monitoring of road crash trends.
Road safety by user group
The increase in the motorcycle fleet has led to an increase in crashes involving motorcycles. The use of motorcycles for commercial purposes has been banned in some major cities due to the high fatality rate resulting from motorcycle crashes.
Road safety by age group and gender
All operators of motorcycles and vehicles must be appropriately licensed. The motorcycle licence (A) is differentiated. The minimum age to acquire a driving licence is 18.
Based on data reported to FRSC, nearly 80% of fatalities are male.
Road safety by road type
Roads are classified as federal, state and local government roads. Urban roads occur under all three categories. Nigeria does not yet have detailed information on road crashes by road category.
There is little safety provision for pedestrians except in some major cities.
Economic costs of traffic crashes
There is no estimation of the economic costs of road crashes.
Recent trends in road user behaviour
Speed
The table below summarises the main speed limits in Nigeria. In 2014, inappropriate or excessive speed was the main contributing factor in 29% of fatal crashes.
Beginning in June 2015 all commercial vehicles must have speed limiters installed. Communication started early in 2015 and the measure will be enforced during the course of 2016.
Table 30.1. Speed limits by road type, 2015
| General speed limit Passenger cars | Comment | |
|---|---|---|
| Urban roads | 50 km/h | 45km/h for tankers/trailers and vehicles with trailers |
| Rural roads | 80 km/h | 80 km/h for taxis and buses 60 km/h for trucks 50km/h for motorcycles, tankers/trailers; 45 km/h for trucks with trailer |
| Motorways | 100 km/h | 90 km/h for taxis and buses 70 km/h for trucks 60 km/h for tankers/trailers 45 km/h for trucks with trailers |
Drink driving
The maximum authorised blood alcohol content (BAC) is 0.5 g/l. Based on FRSC reports, around 1% of fatal crashes are due to drink driving. The Federal Road Safety Commission (Establishment) Act of 2007 is currently being amended to further strengthen the law on drink driving. The BAC will be amended to a maximum BAC of 0.2 g/l for novice drivers (less than one year's driving experience) and 0.0 g/l for commercial drivers. This will be implemented as soon as the submitted amendment in the law is passed by the National Assembly and signed into law by the President.
Patrol teams test any driver suspected of drink driving.
Drugs and driving
It is estimated that impaired driving due to the consumption of drugs was responsible for 1% of fatal crashes in 2013.
Distraction
In Nigeria, it is forbidden to drive while using a mobile phone, including hands-free devices.
Sleepiness and fatigue
In 2013, it was estimated that fatigue was the main contributing factor in 2% of fatal crashes.
Seat belts and helmets
Seat belt use has been compulsory in front seats and rear seats since 1997; however, enforcement regarding seat belts in front seats only started in 2002. Enforcement regarding the use of seat belts in rear seats will start in 2016. Efforts so far have focused on communication and education.
According to FRSC 80% of front seat passengers and drivers wear a seat belt; while on rear seats less than 1% of passengers are buckled.
Table 30.2. Seat belt wearing rate by car occupancy and road type
| | 2000 | 2014 | | |-------------|------|------|--| | Front seats | | | | | General | < 5% | 80% | | | Rear seats | | | | | Adults | < 1% | < 1% | |
All riders of powered two-wheelers (PTWs) are required to wear safety helmets. The helmet-wearing rate by riders of PTWs is estimated at 60%.
There are laws making the use of helmets compulsory for all cyclists in Nigeria.
National road safety strategies and targets
Organisation of road safety
The responsibility for road safety is vested in the Federal Road Safety Corps, the lead agency established by the federal government. The agency is a paramilitary organisation, established in February 1988 and funded through budgetary allocation. A commission supervises the corps of officers and staff that undertake day-to-day activities. The functions of the Federal Road Safety Corps include:
- preventing and minimising road traffic crashes
- clearing obstructions on the highways
- educating drivers, motorists and other road users on the proper use of the roads
- providing attention and care to victims of road traffic crashes
- conducting research into causes of crashes and putting results of such research into use
- enforcing traffic rules
- issuing drivers licences
- managing vehicle registration
- advising the federal and state governments, including the Federal Capital Territory Administration and relevant governmental agencies, on measures to improve road safety.
Road safety strategy for 2014-18
The Nigerian Road Safety Strategy (NRSS 2014-18) has been approved by the Federal Executive Council and endorsed by the National Economic Council which includes all the State Executives (Governors) in the Federation.
The strategy is based on the United Nations Plan for the Decade of Action for Road Safety and its five strategic pillars.
- road safety management
- safer roads and mobility
- safer vehicles
- safer road users
- post-crash care and response.
Road safety targets
The strategy is driven by three main objectives:
- A reduction of 50% in the number of fatal road traffic crashes by 2015 from levels before 2007, as recommended in the Accra Declaration of February 2007.
- Aligning operational strategies to achieve the nation's vision of becoming one of the top 20 countries with the safest roads in the world by the year 2020.
- Meeting the target suggested by the United Nation's Decade of Action, to reduce by half the number of fatalities in 2020 in comparison to the 2010 level.
Monitoring
Performance towards these main goals is monitored through key performance indicators, including:
- monthly report on the number of drivers trained at no cost to themselves (driver training is usually a paid service, but under this arrangement apprehended offenders are trained without any cost)
- monthly report on the number of drivers arrested for traffic law violations and number of successful drivers licence applicants
- monthly report on number of road safety audits conducted
- monthly report of the number of drivers tested for alcohol
- monthly report on the number of drivers driving above the speed limits
- monthly record of road traffic collisions relating to speed violation
- monthly report of sporadic checks conducted at motor parks
- monthly report of the number of schools implementing the standard school bus policy, which has requirements such as the colour of a school bus and training for drivers and operators.
In November 2015, at the occasion of the mid-term review of the United Nations Decade of Action for Road Safety 2011-2020, Brazil hosted the second Global High-Level Ministerial Conference on Road Safety. The Corps Marshal of FRSC represented Nigeria and presented a position paper reviewing the status of Nigerian road safety.
In July 2015, the United Nations Economic Commission for Africa (UNECA) conducted an evaluation on the implementation of the Decade of Action on Road Safety and concluded that Nigeria was among the top three performers among 23 African countries in accomplishing the activities of the African Road Safety Action Plan (UNECA, 2015).
Recent safety measures (2013-16)
Road safety management
- Efforts are ongoing to harmonise road traffic crash data records through the National Committee on Crash Information System (NACRIS). As previously mentioned, a twinning programme between the FRSC and the UK DfT was launched in 2016 to review the current national crash data system and develop a 3-year programme to enhance it. A World Bank consultant will also contribute to the review of the Road Traffic Crash Data Management System.
- Crashes resulting in six deaths or more are subject to detailed crash investigations.
- Continuation of the World Bank's assistance programme providing manpower and operational equipment to conduct road safety assessments on six major corridors.
- Continued inter-agency co-operation through the Nigerian Road Safety Partnership. This has led to the establishment of a road safety unit within the Nigeria Defence Academy in which students will benefit from road safety courses.
- Amended laws to strengthen road safety, such as the lower BAC limits for novice drivers and a total ban for commercial drivers.
- Increased enforcement activities, including:
- ❖ Special nationwide patrol operations targeted at such specific issues as overloading, vehicle conditions and use of phones while driving.
- ❖ Operation Zero Tolerance patrol against drink driving carried out during Christmas/ New Year and other festive periods.
- ❖ Increased presence of FRSC patrol vehicles and motorcycles on motorways.
- Continued engagement of the individual states on the setting up of the States Motor Vehicle Administration Agency.
Road users
- Improved regulatory and enforcement capacity by the FRSC.
- Road safety education in primary and junior secondary schools, in co-operation with Total Nigeria Plc and Shell plc.
Vehicles
- Introduction of speed limiting devices on all commercial vehicles from second quarter of 2016.
- Free safety checks for all vehicles. Defects are identified and brought to the attention of the owners for remedial action without the issuance of tickets. More than 230 000 vehicles have been checked so far.
- Computerised vehicle inspection centres have been introduced in some states of Nigeria to check the road worthiness of vehicles. More periodic technical inspection centres are being established.
- Revival of the committee on the "Implementation of ECOWAS axle load control and harmonisation protocol" using existing weigh bridges in the country to check overloading violations by heavy duty vehicles.
- Further clarification on importation and use of the prohibited right-hand drive vehicles.
Post crash measures
- Establishment of an emergency call centre with nationwide coverage. A toll-free emergency number (122) was launched in 2012 for road users to request assistance in case of an emergency, contributing to the efficiency of the rescue service.
- Establishment of emergency ambulance points (called ZEBRA) along major corridors.
- Addition of more ambulances into the operations of the FRSC.
Recent and ongoing research
- Federal Road Safety Corps in conjunction with Aromophy Ventures Ltd (2016): "The Impact of Prosecution on Road Traffic Offenders by FRSC on Road Traffic Behaviour and Road Crash Reduction in Nigeria".
- Federal Road Safety Corps in conjunction with the International Centre for Alcohol Policies (2015): Survey on breath alcohol testing of drivers across the six geological zones in Nigeria.
- Federal Road Safety Corps (2015): National survey on tyres.
References
UNECA (2015), Status of implementation of the African road safety plan, United Nations Economic Commission for Africa, Addis Ababa.
WHO (2015), Global Status Report on Road Safety 2015, World Health Organization, Geneva.
Website
● Federal Road Safety Corps: www.frsc.gov.ng.
Chapter 31
Norway
This chapter presents 2014 road safety data for Norway along with provisional data from 2015. It looks at trends in traffic and road safety from the years 1990 to 2015 and road user behaviour patterns. This includes data on speed, drink driving, drugs and driving, distracted driving, fatigue and seat belt usage. The chapter reviews Norway's road safety strategy and national targets to 2024 and the progress achieved thus far. It also looks at recently implemented safety measures.*
* All data stem from Public Roads Administration unless otherwise noted. For more information please contact: guro.ranes@vegvesen.no.
Following a temporary setback in 2013, Norway registered two consecutive years of reductions in fatalities on the road. In 2014, there were 147 road deaths in Norway, a 21% decrease when compared to 2013. Provisional data from 2015 show another decrease, with 118 road deaths, a 20% reduction compared to 2014 and a 37% reduction over 2013. This is the lowest number of road deaths that have been recorded since 1945 and equals a fatality rate of 2.3 per 100 000 inhabitants. Norway has adopted a Vision Zero strategy, with the interim target of the National Transport Plan being a total of no more than 500 fatalities and serious injuries by 2024.
Road safety data collection
Definitions applied in Norway
- Road fatality: Person killed in a traffic crash or from injuries within 30 days after the crash.
- Seriously injured: Person suffering life threatening injuries, or injuries that lead to lasting injury, or other larger injuries that are not life-threatening.
- The police do not use the Maximum Abbreviated Injury Scale of three or more (MAIS3+) to classify serious injuries, but this will be done in the future when such injury data is provided by hospitals.
Crash data are collected by the police and consolidated at the national level by Statistics Norway and the Public Roads Administration.
Less severe crashes and injuries are often not reported to the police, and may therefore be under-represented in the figures. This concerns in particular light injuries and single bicycle crashes. At the moment injury data is collected by police, but there are plans to use hospital data in the near future.
Most recent safety data
Road crashes in 2015 – provisional data
Based on provisional data, there were 118 road deaths in 2015, representing a 20% reduction compared to 2014 and a 37% reduction compared to 2013. This is the lowest number of road deaths that have been recorded since 1945.
Road crashes in 2014
In 2014, there were 147 road deaths in Norway, a 21% decrease when compared to 2013. There were 135 fatal crashes in which 56 persons were killed in head-on collisions and 54 in run-off road crashes. These two types of accident accounted for 75% of all fatalities in 2014; about the same as the previous year. One out of three fatalities is aged 65 years or older.
Trends in traffic and road safety (1990-2015)
Traffic
In 2014, around 43 700 million vehicle-kilometres were registered on Norwegian public roads. Since 1990, total vehicle-kilometres have increased by 58% on public roads.
Road safety
Crashes and casualties
The number of road deaths peaked in 1970 with 560 fatalities. The relatively low numbers of deaths in Norway are subject to annual fluctuation. However, the long-term trend shows a steady improvement in road safety.
Between 2010 and 2015, the number of road deaths decreased by 43%.
There is no single reason for this very positive development, but the result of a systematic, long-term and fact based approach. There were positive developments on indicators like speed, seat belt wearing, lane barriers and other key factors with known effects on severe traffic accidents. Important measures were taken including:
- the adoption of a vision zero road safety strategy
- penetration of vehicles into the car fleet with 5-star EuroNCAP ratings for top levels of both passive and active safety measures
- reduced speed limits, a speeding campaign, and speed cameras resulting in reduced mean speed of traffic on high volume roads
- new motorways and two/three lane roads with physical barriers to prevent head-on crashes
- seat belt campaigns resulting in increased use of seat belts.
Rates
Norway had a fatality rate of 2.9 deaths per 100 000 inhabitants in 2014 and 2.3 in 2015.
Analysis of seriously injured data
In 2015, 668 persons were seriously injured in road traffic crashes, compared to 674 in 2014. Only once since World War II has a lower figure been observed. This was in 1947, when 640 persons were seriously injured. At that time, however, there were very few cars on the roads. The vehicle fleet was equivalent to 3.5% of vehicle fleet today. The positive development can be seen when comparing figures for recent years with 1970, when 4 552 persons were seriously injured. A steady decline has been observed since then.
Road safety by user group
Since 2000, road safety improvements have benefited pedestrians and car occupants the most, while there has been less progress for cyclists.
The number of car drivers who lost their lives was reduced from 63 in 2014 to 58 in 2015. Their share of all fatalities, however, increased from 33% in 2014 to 49% in 2015.
In 2014, 12 cyclists were killed, a marked increase compared to previous years. However, the number of cyclists killed dropped to five in 2015. Nevertheless, an overall increase in the number of seriously injured cyclists is observed, from 54 in 2010 to 88 in 2015.
Table 31.1. Road safety and traffic data
| 2014 % change from | |||||||||
|---|---|---|---|---|---|---|---|---|---|
| 1990 | 2000 | 2010 | 2013 | 2014 | 2013 | 2010 | 2000 | 1990 | |
| Reported safety data | |||||||||
| Fatalities | 332 | 341 | 208 | 187 | 147 | -21.4 | -29.3 | -56.9 | -55.7 |
| Injury crashes | 8 801 | 8 440 | 6 360 | 5 320 | 4 856 | -8.7 | -23.6 | -42.5 | -44.8 |
| Seriously injured persons | 674 | ||||||||
| Deaths per 100 000 inhabitants | 7.8 | 7.6 | 4.3 | 3.7 | 2.9 | -22.3 | -32.8 | -62.2 | -63.3 |
| Deaths per 10 000 registered vehicles | 1.4 | 1.2 | 0.6 | 0.5 | 0.4 | -22.8 | -35.3 | -68.6 | -72.8 |
| Deaths per billion vehicle kilometres | 12.0 | 10.5 | 4.9 | 4.3 | 3.4 | -21.1 | -31.2 | -67.9 | -71.9 |
| Traffic data | |||||||||
| Registered vehicles (thousands) | 2 343 | 2 777 | 3 495 | 3 747 | 3 818 | 1.9 | 9.2 | 37.5 | 62.9 |
| Vehicle kilometres (millions) | 27 755 | 32 547 | 42 561 | 43 913 | 43 738 | -0.4 | 2.8 | 34.4 | 57.6 |
| Registered vehicles per 1 000 inhabitants | 553 | 620 | 719 | 742 | 747 | 0.7 | 3.9 | 20.5 | 35.0 |
1 2 http://dx.doi.org/10.1787/888933385619
Figure 31.1. Road safety, traffic and GDP trends index 1990 = 100
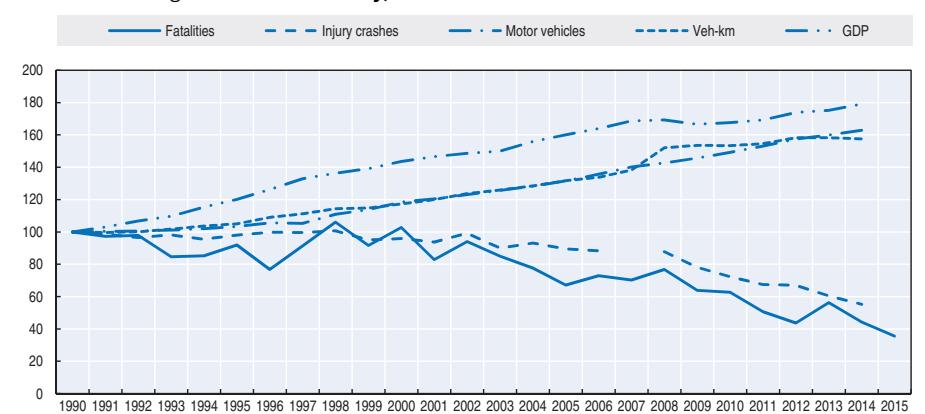
Source: World Bank for Gross Domestic Product (GDP; constant prices).
Table 31.2. Road fatalities by road user group
| 2015 % change from | ||||||||||
|---|---|---|---|---|---|---|---|---|---|---|
| 1990 | 2000 | 2010 | 2013 | 2014 | 2015 | 2014 | 2010 | 2000 | 1990 | |
| Cyclists | 17 | 13 | 5 | 10 | 12 | 5 | -58.3 | 0.0 | -61.5 | -70.6 |
| Moped users | 14 | 6 | 0 | 3 | 2 | 1 | -50.0 | Na | -83.3 | -92.9 |
| Motorcyclists | 25 | 40 | 26 | 21 | 20 | 20 | 0.0 | -23.1 | -50.0 | -20.0 |
| Passenger car occupants | 214 | 225 | 125 | 99 | 88 | 77 | -12.5 | -38.4 | -65.8 | -64.0 |
| Pedestrians | 55 | 47 | 24 | 18 | 18 | 12 | -33.3 | -50.0 | -74.5 | -78.2 |
| Others | 7 | 10 | 28 | 36 | 7 | 3 | -57.1 | -89.3 | -70.0 | -57.1 |
| Total | 332 | 341 | 208 | 187 | 147 | 118 | -19.7 | -43.3 | -65.4 | -64.5 |
Road safety by age group
Since 1990, safety improvements have benefited all age groups, in particular children and young people, but there has been a much slower decrease for older people. Since 2010,
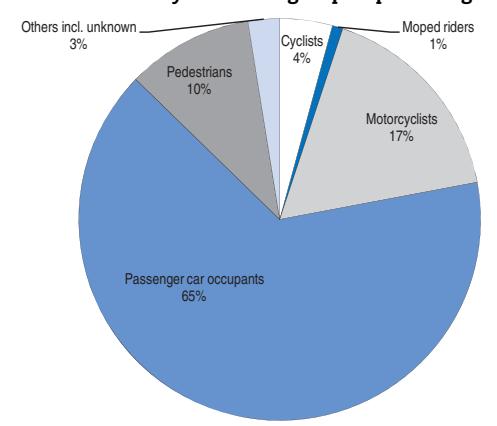
Figure 31.2. Road fatalities by road user group in percentage of total 2015
there has been much progress for all age groups, except the 65 and over group for whom fatalities increased by 20%.
In 2015, no children under 6 were killed in traffic, and only four young people under 18 lost their lives, compared to 9 in 2014. In the 65+ age group, 24 persons were killed in road traffic crashes, accounting for 20% of all fatal crashes. The corresponding share in 2014 was 32%. The older population have a fatality rate twice that of the average.
| 2015 % change from | ||||||||||
|---|---|---|---|---|---|---|---|---|---|---|
| Age | 1990 | 2000 | 2010 | 2013 | 2014 | 2015 | 2014 | 2010 | 2000 | 1990 |
| 0-5 | 9 | 8 | 1 | 1 | 1 | 0 | ||||
| 6-9 | 3 | 6 | 0 | 0 | 0 | 1 | Figures too small for meaningful comparisons. | |||
| 10-14 | 6 | 4 | 3 | 3 | 4 | 1 | ||||
| 15-17 | 23 | 20 | 8 | 7 | 4 | 2 | -50.0 | -75.0 | -90.0 | -91.3 |
| 18-20 | 49 | 33 | 23 | 13 | 9 | 24 | 166.7 | 4.3 | -27.3 | -51.0 |
| 21-24 | 34 | 36 | 19 | 17 | 9 | 8 | -11.1 | -57.9 | -77.8 | -76.5 |
| 25-64 | 146 | 165 | 115 | 102 | 73 | 58 | -20.5 | -49.6 | -64.8 | -60.3 |
| 65 | 62 | 61 | 39 | 44 | 47 | 24 | -48.9 | -38.5 | -60.7 | -61.3 |
| Total | 332 | 341 | 208 | 187 | 147 | 118 | -19.7 | -43.3 | -65.4 | -64.5 |
Table 31.3. Road fatalities by age group
Road safety by road type
In 2015, approximately 85% of road fatalities occurred outside densely populated areas. Of these, 52% were killed in head-on crashes or in run-off-road crashes.
Economic costs of traffic crashes
Traffic crashes represent a significant cost for Norwegian society, estimated in 2012 at around EUR 1.93 billion (excluding property damage costs). Costs are calculated on a willingness-to-pay approach.
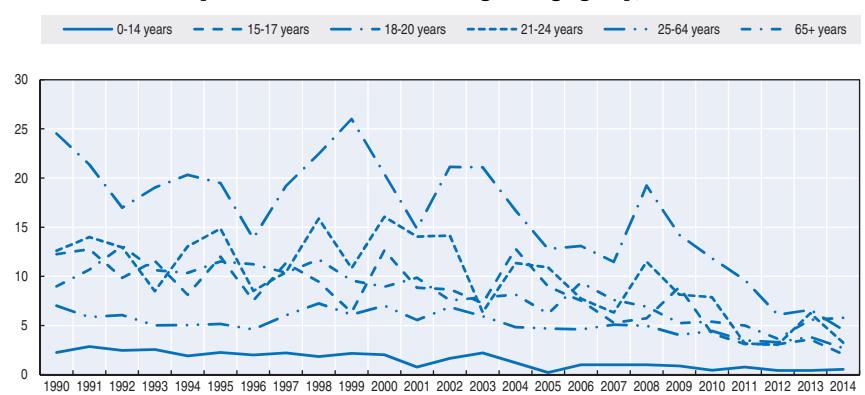
Figure 31.3. Road fatality rates by age group Deaths per 100 000 inhabitants in a given age group, 1990-2014
Recent trends in road user behaviour
Speed
Studies in Norway show that excessive speed or high speeds incompatible with road conditions like snow, ice, fog or rain are an important element in fatal crashes and their consequences
Average speed on Norwegian roads with an 80 km/h speed limit has decreased by about 1 km/h during the last five years. This is partly due to an increase in the share of older drivers and the fact that older drivers drive more slowly than younger drivers. Even though the changed age composition of the driver population explains part of the speed decrease, the decrease is also due to other factors, including higher traffic volume and decreased prevalence of large speeding violations (TØI report, 2016/1462).
The table below summarises the main speed limits in Norway.
Table 31.4. Passenger car speed limits by road type, 2016
| General speed limit | Comments | |
|---|---|---|
| Urban roads | 50 km/h | Residential streets often limited to 30 km/h |
| Rural roads | 80 km/h | |
| Motorways | 90, 100, 110 km/h |
Drink driving
The legal maximum blood alcohol content (BAC) is 0.2 g/l. The number of drivers impaired due to alcohol seems to be fairly stable or slightly reduced. In 2013, thirteen of the fatal crashes were due to drunk drivers.
Drugs and driving
The legal maximum content of illegal drugs is equivalent to 0.2 g/l alcohol. The number of impaired drivers due to drugs seems to be fairly stable.
Distraction
In Norway, the law stipulates that mobile phones must be correctly attached to the instrument panel in the vehicle, as close as possible to the driver. Hands-free devices can be used. There are no good estimations on the number of fatal crashes due to the use of mobile phones, but research shows that this is a factor to be watched carefully.
Sleepiness and fatigue
In-depth studies show that fatigue and sleepiness were the cause of 16% of all fatal crashes in Norway in 2014.
Seat belts and helmets
Seat belt use has been compulsory in front seats of light vehicles since 1975 and in rear seats since 1985. Child restraints are compulsory for children under 135 cm in height. For children over 135 cm a child restraint should be used if available. In Norway it is recommended that children under the age of four should be seated facing backward.
The use of seat belts by drivers of light vehicles increased sharply between 2006 and2013 as a result of enforcement and awareness campaigns. In 2014 and 2015, the seat belt wearing rate among drivers stabilised at around 96-97%. There is no monitoring of seat belt use in rear seats, but it is estimated to be 7-8 percentage points lower. For children aged 1-3, the use of dedicated rear facing child restraints increased from 20% in 2010 to 49% in 2015, showing wider scope for improvement. The use of seat belts by heavy vehicle drivers increased from 53% in 2010 to 87% in 2015.
An analysis of fatal crashes in 2014 estimates that 36% of car occupants killed were not wearing a seat belt.
| 2010 | 2015 | |
|---|---|---|
| Front seat | ||
| Driver | 97% | |
| Rear seats | ||
| Children (use of child restraint) (children aged 1 to 3) |
20% | 49% |
Table 31.5. Seat belt wearing rate by car occupancy and road type
All riders of powered two-wheelers are required to wear helmets. The helmet-wearing rate is close to 100%.
There is no mandatory helmet-use law for cyclists. Helmet use by cyclists over the age of 12 in 2015 was 56.2%. In 2015, 3 out of the 10 cyclists killed on the roads were not wearing a helmet.
National road safety strategies and targets
Organisation of road safety
Traffic safety policy is co-ordinated by the Norwegian Public Roads Administration (NPRA). In addition to the NPRA, the police, the public health and education administrations, together with leading non-governmental organisations, are the main national stakeholders. At regional and local levels, counties and municipalities play a very important role. The Norwegian road safety policy relies on this broad and collaborative approach, a common and shared strategy and co-ordination among all stakeholders.
Road safety strategy for 2014-24
Norway's parliament adopted Vision Zero in 2001. The Norwegian Vision Zero involves all modes of transport. The main focus is to reduce crashes that can lead to fatalities and serious injuries. The highest priority is given to the reduction of head-on crashes, singlevehicle crashes and collisions with cyclists and pedestrians. Special attention is also paid to high-risk road users, such as young drivers, elderly road users and motorcyclists.
A National Plan of Action for Road Traffic safety is published every fourth year. The current Plan covers the period 2014-17 and is embedded in the National Transport Plan (NTP) 2014-2024. The plan highlights the current road safety challenges in Norway and describes the measures that will be implemented from 2014-17 to move towards the national target of no more than 500 fatalities and severe injuries by 2024.
Road safety targets
Initially, the main goal of the plan was to halve the number of killed and seriously injured by 2024, when compared to the average for the period 2008-11. A modelling exercise based on existing knowledge shows that it is possible to reach 630 fatalities and seriously injured by 2024. By taking into account the fact that it is not possible to assess the effect of all measures and that new technology may bring additional benefits, a new target was set of no more than 500 fatalities and seriously injured by 2024.
Monitoring targets
Developments concerning fatalities and the seriously injured are constantly monitored. In addition, the NPRA is monitoring a set of safety performance indicators, related to speed, seat belt wearing and heavy vehicle safety standards.
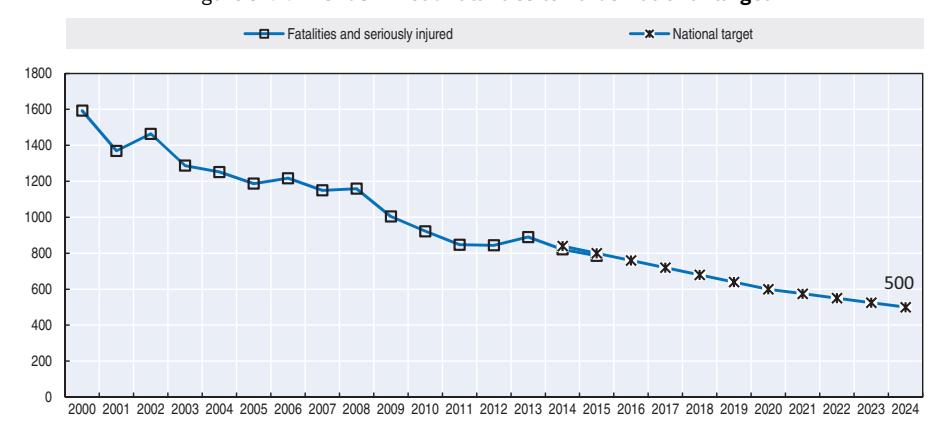
Figure 31.4. Trends in road fatalities towards national target
Recent safety measures (2013-16)
The 2014-17 plan includes a new set of 152 measures that will be progressively implemented.
Road users
- Education and awareness.
- The speed campaign has been updated with a focus on young drivers. The campaign of sharing the road (cyclists and cars) is ongoing and the seat belt campaign is updated with wearing seat belts in buses.
Vehicles
● The NPRA uses a camera system for number plate recognition as a tool to carry out inspection tasks. The system is one of many measures adopted in order to achieve inspection objectives more efficiently. In 2015, the NPRA started a pilot project aiming to enforce compliance with the new requirement of an electronic toll payment tag for business vehicles. The requirement applies to both Norwegian and foreign vehicles on Norwegian roads.
Recent and ongoing research
- The NPRA is conducting a 5-year (2013-17) research programme Better Safety in Traffic (BEST). The purpose of the programme is to assess the potential for reducing the numbers of fatalities and seriously injuries and identify areas where the greatest returns can be made in the coming years. In 2015, there was specific research and analysis on all cyclist accidents registered by the emergency centre of Oslo. A similar study will be undertaken in 2016 for pedestrians.
- The Institute of Transport Economics published, in 2013, a study on crashes, driving behaviour and safety attitudes among novice drivers (TØI report 1287/2013), demonstrating that novice drivers who received their license in 2011-12 had more positive road safety attitudes, better driving behaviour, and lower crash involvement risk during the first months of solo driving, compared to drivers who obtained their license in 2004.
- The Institute of Transport Economics published, in 2014, a study on the crash effects of speed cameras (TØI report 1384/2014).
- The Institute of Transport Economics published, in 2014, a study on trends on the risk of apprehension for traffic offences (TØI report 1361/2014).
- The Institute of Transport Economics published, in 2014, an evaluation report on the crash effects of section control (TØI report 1339/2014).
References
- TØI Report 1417/2015, "The potential for reducing the number of killed or seriously injured road users. Preliminary estimates", Report with summary in English. www.toi.no/getfile.php/Publikasjoner/ T%C3%98I%20rapporter/2015/1417-2015/1417-2015-sum.pdf (accessed 10 May 2016).
- TØI rapport 1339/2014. Evaluation of the crash effects of section control, www.toi.no/getfile.php/Publikasjoner/ T%C3%98I%20rapporter/2014/1339-2014/1339-2014-sum.pdf (accessed 11 April 2016).
TØI report 1462/2016, "Speed and age: Changes in speed level on Norwegian roads with 80 km/h limit", TOI Institute of Transport Economics, Oslo, www.toi.no/getfile.php/Publikasjoner/ T%C3%98I%20rapporter/2016/1462-2016/1462-2016-sum.pdf (accessed 11 April 2016).
TØI report 1287/2013, "Accidents, driving behaviour and safety attitudes among novice drivers", www.toi.no/getfile.php/Publikasjoner/T%C3%98I%20rapporter/2013/1287-2013/1287-2013-sum.pdf (accessed 11 April 2016).
TØI report 1361/2014, "Trends in the risk of apprehension for traffic offences", www.toi.no/getfile.php/ Publikasjoner/T%C3%98I%20rapporter/2014/1361-2014/1361-2014-Sum.pdf (accessed 11 April 2016).
Websites
- Public Road Administration: www.vegvesen.no. National Road Safety Plan: www.vegvesen.no/en/Traffic/ Road+safety/Road+safety.
- TØI Research Institute for Transport Economics: www.toi.no.
- International Research Institute: www.iris.no.
- SINTEF: www.sintef.no.
- Norwegian Institute of Public Health: www.fhi.no.
Chapter 32
Poland
This chapter presents 2014 road safety data for Poland along with provisional data from 2015. It looks at trends in traffic and road safety from the years 1990 to 2014 and road user behaviour patterns. This includes data on speed, drink driving, drugs and driving, distracted driving, fatigue and seat belt and helmet use. The chapter reviews Poland's road safety strategy and national targets to 2020 and the progress achieved thus far. It also highlights the most recently implemented safety measures.*
* All data stem from the Motor Transport Institute and IRTAD unless otherwise noted. For more information, please contact: justyna.wacowska-slezak@its.waw.pl.
Poland continues its downward trend in fatalities with provisional data from 2015 showing a reduction of 8.2% over 2014. In 2014 fatality data already showed a 4.6% reduction over 2013.
In 2014, the rate of fatalities was at 8.4 per 100 000 inhabitants. The most significant reduction in the number of fatalities for 2014 was observed for cyclists and passenger car occupants, with a decrease of 6.5% and 7% respectively. Pedestrians are particularly vulnerable, comprising 35% of all fatalities. Since mid-2015, drivers caught exceeding the speed limit by more than 50km/h have their driving licence suspended for three months.
Road safety data collection
Definitions applied in Poland
- Road fatality: Death caused by a road crash within 30 days of the crash.
- Seriously injured: A person who sustains a serious disability, an incurable disease or a chronic life threatening disease, permanent mental disease, complete or substantial permanent incapacity to work in current occupation, or permanent or substantial scarring or disfiguration of the body. The definition also includes persons who suffer other injuries that incapacitate them or cause a health breakdown for longer than seven days.
- Slightly injured: Person who experiences loss of health less than in the case of serious injury, whose health dysfunctions remain for less than seven days.
- Injury crash: Crash resulting in at least one injured or killed person.
Poland does not yet rate serious injuries as having a score of three or more on the Maximum Abbreviated Injury Scale (MAIS3+). However, as the International Road Traffic and Accident Database (IRTAD) and the European Commission recommend the system, MAIS3+ are progressively been estimated. Following agreements between the National Road Safety Council, the Ministry of Infrastructure and Development and the Ministry of Health, the National Institute of Public Health is in charge of introducing MAIS 3+, starting with conversion of International Classification of Diseases (ICD10) codes into Abbreviated Injury Scale codes on the basis of hospital discharge data. This conversion process started in 2015 based on the mapping table developed by the Association for the Advancement of Automotive Medicine and provided by the European Commission. MAIS 3+ data are not yet published.
Data collection
The basic source of road crash data is the police database, which was set up in 1975 under the responsibility of the police's Department of Road Traffic.
Information is gathered by police officers according to categories included in the Road Accident Card (such as the description of the crash site, circumstances of the crash, behaviour of participants, type of injuries, etc.). Guidelines and definitions are described in the Head Chief of Police Regulation No. 123 of 31 May 2012.
In 2012, the Motor Transport Institute reviewed the police crash database and compared its data from the years 2008-10 with public statistics from national health services and the national statistics office. The result was that the number of people killed in road crashes could be 3%-25% higher than official police data. This pilot study showed the need for further investigation.
Most recent safety data
Road crashes in 2015 – provisional data
Based on provisional data, it is estimated that there were 2 938 road fatalities in 2015, an 8.2 % decrease when compared to 2014.
This decrease in road fatalities might be partly the result of the latest change in legislation which includes more severe sanctions for speeding in built-up areas. Since mid-2015, drivers caught exceeding the speed limit by more than 50 km/h have their driving licence suspended for three months.
Road crashes in 2014
In 2014, 3 202 people were killed on the road, a decrease of 4.6% compared to 2013. The number of injury crashes decreased by 2.4%.
The improvements concerned mostly passenger cars occupants (-7%) and cyclists (-6.5%). The number of pedestrians injured decreased by 2.1%.
Trends in traffic and road safety (1990-2014)
Traffic
Since 1990, the number of motorised vehicles has multiplied by more than 2.5. In recent years, the increase in the number of motor vehicles has stabilised at about 3% annually, after a more rigorous increase in the 1990s and 2000s, and a slight drop in the number of vehicles in 2009 compared to 2008, following the economic crisis.
Road safety
Crashes and casualties
A peak in the number of fatalities was reached in 1991, with 7 901 deaths. In recent years (2000-14) the upward trend has broken, and compared to 1990, the number of fatalities has declined by 56% and injury crashes by 31%.
Since 1991, the following legislations and policies have been implemented in Poland:
- compulsory seat belt wearing for all car occupants
- appointment of National Road Safety Council
- national Road Safety Programme GAMBIT
- demerit point system
- compulsory use of child restraints
- severe penalties for drunk driving
- speed enforcement (including automatic speed enforcement)
- more severe penalties for speeding
50 km/h limit in built-up areas
daytime running lights
changes in drivers' education system
implementation of the new law for cyclists
implementation of the European Union (EU) directive on road safety management
development of the National Road Safety Programme 2013-20.
Rates
In 2014, Poland had a fatality rate, expressed in terms of deaths per 100 000 inhabitants, of 8.4. Fatality rate has been constantly decreasing since the 1990s and it was reduced almost by 50% between 2000 and 2014.
Table 32.1. Road safety and traffic data
| 2014 % change from | |||||||||
|---|---|---|---|---|---|---|---|---|---|
| 1990 | 2000 | 2010 | 2013 | 2014 | 2013 | 2010 | 2000 | 1990 | |
| Reported safety data | |||||||||
| Fatalities | 7 333 | 6 294 | 3 908 | 3 357 | 3 202 | -4.6 | -18.1 | -49.1 | -56.3 |
| Injury crashes | 50 532 | 57 331 | 38 832 | 35 847 | 34 970 | -2.4 | -9.9 | -39.0 | -30.8 |
| Deaths per 100 000 inhabitants | 19.3 | 16.4 | 10.2 | 8.7 | 8.4 | -3.3 | -17.7 | -48.8 | -56.3 |
| Deaths per 10 000 registered vehicles | 8.1 | 4.5 | 1.8 | 1.4 | 1.3 | -7.4 | -28.3 | -71.6 | -84.4 |
| Traffic data | |||||||||
| Registered vehicles1 (thousands) | 9 041 | 14 106 | 22 115 | 24 521 | 25 255 | 3.0 | 14.2 | 79.0 | 179.3 |
| Registered vehicles per 1 000 inhabitants | 238 | 369 | 579 | 636 | 664 | 4.4 | 14.6 | 80.2 | 179.5 |
1. Registered vehicles including mopeds.
1 2 http://dx.doi.org/10.1787/888933385620
Figure 32.1. Road safety, traffic and GDP trends index 1990 = 100
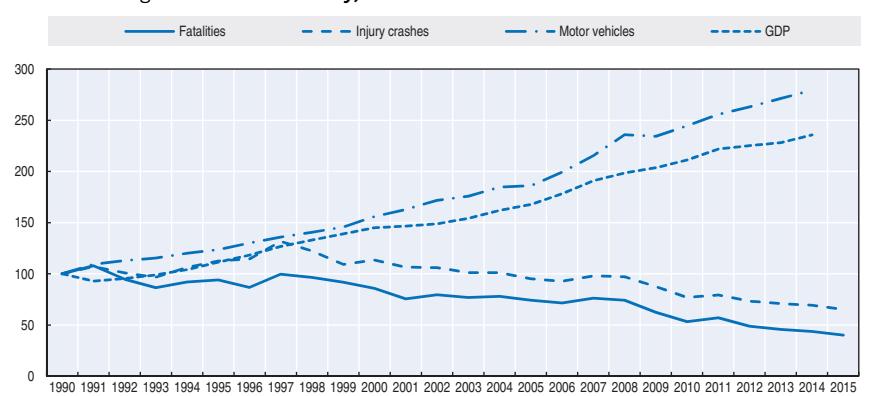
Source: World Bank for Gross Domestic Product (GDP; constant prices).
Road safety by user group
Since 2000, all user groups except motorcyclists and moped riders have benefited from a decrease in the number of fatalities. The number of motorcyclists killed has increased by more than 33%; however.
Half of road fatalities in Poland are vulnerable road users. Pedestrians make up nearly 35% of all fatalities (in the European Union the share is 21%).
In 2014, the most significant reduction in the number of fatalities was observed for cyclists and passenger car occupants – a decrease by 6.5% and 7% respectively. The number of motorcyclists killed decreased by 6%, while the number of moped users killed has increased by almost 13%.
| 2014 % change from | |||||||||
|---|---|---|---|---|---|---|---|---|---|
| 1990 | 2000 | 2010 | 2013 | 2014 | 2013 | 2010 | 2000 | 1990 | |
| Cyclists | 574 | 692 | 280 | 306 | 286 | -6.5 | 2.1 | -58.7 | -50.2 |
| Moped users | 288 | 75 | 83 | 62 | 70 | 12.9 | -15.7 | -6.7 | -75.7 |
| Motorcyclists | 749 | 178 | 259 | 253 | 238 | -5.9 | -8.1 | 33.7 | -68.2 |
| Passenger car occupants | 2 237 | 2 709 | 1 853 | 1 448 | 1 346 | -7.0 | -27.4 | -50.3 | -39.8 |
| Pedestrians | 2 977 | 2 256 | 1 236 | 1 140 | 1 116 | -2.1 | -9.7 | -50.5 | -62.5 |
| Others | 508 | 384 | 197 | 148 | 146 | -1.4 | -25.9 | -62.0 | -71.3 |
| Total | 7 333 | 6 294 | 3 908 | 3 357 | 3 202 | -4.6 | -18.1 | -49.1 | -56.3 |
Table 32.2. Road fatalities by road user group

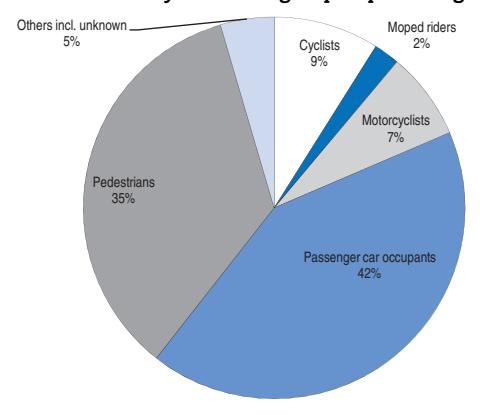
Road safety by age group
Since 1990, the reduction in fatalities has benefited all age groups. The highest reduction concerned the youngest age groups (0-14), for which fatalities fell from 471 in 1990, to 80 in 2014, a decrease of 83%.
On the other hand, fatalities among the over-65s have been decreased at a much lower pace. This is in part due to demographic changes and the ageing of the population. Since 2010, this is the only age group for which the number of road fatalities increased. This group also has the second highest fatality risk, after young people aged 18-24. They are particularly vulnerable as pedestrians.
Young people aged 18-24 have a fatality risk nearly twice as high as the general population.
| 2014 % change from | |||||||||
|---|---|---|---|---|---|---|---|---|---|
| Age | 1990 | 2000 | 2010 | 2013 | 2014 | 2013 | 2010 | 2000 | 1990 |
| 0-5 | 139 | 66 | 31 | 27 | 22 | -18.5 | -29.0 | -66.7 | -84.2 |
| 6-9 | 176 | 89 | 25 | 21 | 21 | 0.0 | -16.0 | -76.4 | -88.1 |
| 10-14 | 156 | 112 | 56 | 42 | 37 | -11.9 | -33.9 | -67.0 | -76.3 |
| 15-17 | 223 | 245 | 122 | 82 | 71 | -13.4 | -41.8 | -71.0 | -68.2 |
| 18-20 | 455 | 443 | 280 | 226 | 199 | -11.9 | -28.9 | -55.1 | -56.3 |
| 21-24 | 636 | 583 | 392 | 327 | 300 | -8.3 | -23.5 | -48.5 | -52.8 |
| 25-64 | 4 493 | 3 751 | 2 293 | 1 980 | 1 852 | -6.5 | -19.2 | -50.6 | -58.8 |
| 65 | 1 055 | 1 004 | 676 | 647 | 692 | 7.0 | 2.4 | -31.1 | -34.4 |
| Total | 7 333 | 6 294 | 3 908 | 3 357 | 3 202 | -4.6 | -18.1 | -49.1 | -56.3 |
Table 32.3. Road fatalities by age group
Figure 32.3. Road fatality rates by age group Deaths per 100 000 inhabitants in a given age group, 1990-2014
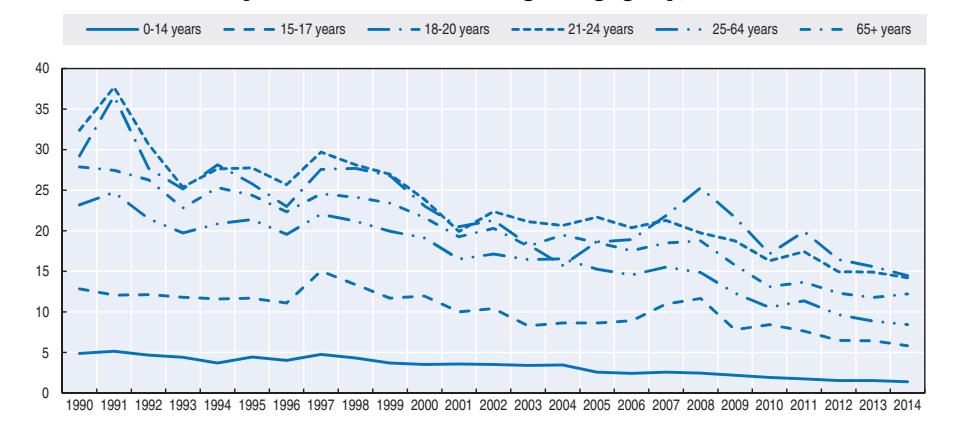
Road safety by road type
The decrease in fatalities over the last 25 years has been achieved mainly through the improvement of road safety inside urban areas.
The motorway network has been significantly developed over the last few years. Motorways totalled 1 556 km in 2014, only 0.5% of the whole road network, but they account for nearly 2% of total fatalities.
Economic costs of traffic crashes
Costs of traffic crashes are calculated based on the capital approach. Traffic crashes represent a significant cost for society, estimated at around PLN 35 billion (around EUR 8.1 billion), or 2% of GDP. They account for more than the budget deficit in Poland (KRBRD, 2016).
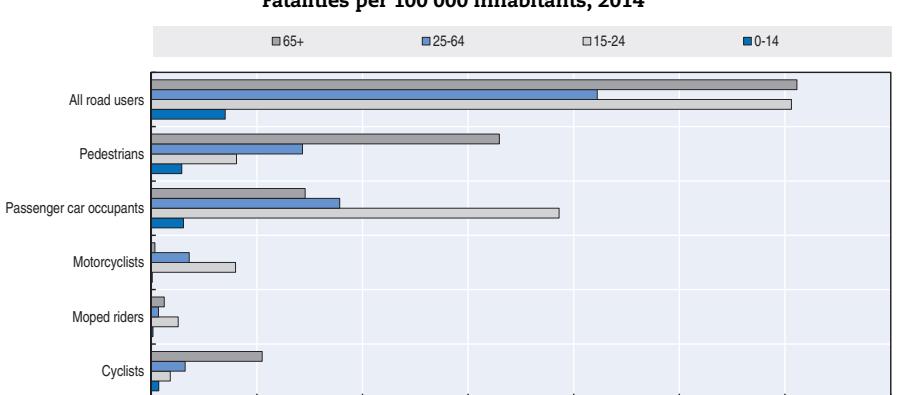
Figure 32.4. Road fatality rate by age and road user group Fatalities per 100 000 inhabitants, 2014
Figure 32.5. Road fatalities by road type
0 2 4 6 810 12 14
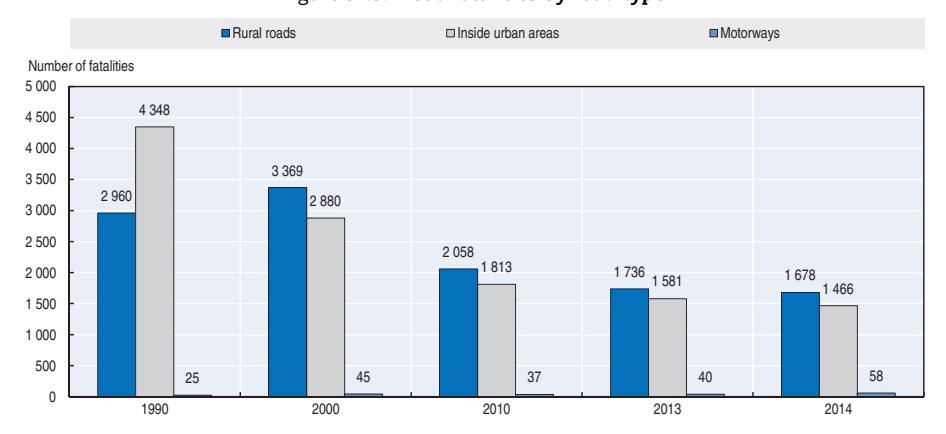
Table 32.4. Costs of road crashes, 2014
| Unit cost | Total | |
|---|---|---|
| Fatalities | PLN 1.91 million | PLN 6.44 billion |
| injured | PLN 2.29 million | PLN 27.62 billion |
| Property damage costs | PLN 39 720 | PLN 0.70 billion |
| Total | 34.7 billion PLN (around EUR 8.1 billion) | |
| Total as % of GDP | 2.0% |
Note: PLN 1.00 = EUR 0.2 on 18 April 2016.
Source: KRBRD (2016).
Recent trends in road user behaviour
Speed
In the last ten years, the number of fatal crashes involving speeding has decreased by 50%; however, speed remains one of the main causes of crashes in Poland and is a contributing factor in around 30% of fatal crashes. Speed enforcement efforts are constantly increasing. New regulations regarding automatic speed enforcement are being introduced into Polish law. In addition new legislation was brought into Polish law in 2015. Drivers who exceed the speed limit by 50 km/h in a built-up area have their diving license automatically withdrawn for three months.
The table below summarises the main speed limits in Poland.
Table 32.5. Passenger car speed limits by road type, 2016
| General speed limit | |
|---|---|
| Urban roads | 50 km/h between 5:00 and 23:00 60 km/h between, 23::00 and 5:00 |
| Rural roads | 90 km/h |
| 2-carriage expressway | 120 km/h |
| Single-carriage express roads and dual-carriage roads with at least two lanes in each direction |
100 km/h |
| Motorways | 140 km/h |
Drink driving
The maximum authorised blood alcohol content (BAC) in Poland is 0.2 g/l for all drivers. Crashes are classified "alcohol related" if one of the crash participants has a BAC of 0.2 g/l or more.
Over the last 10 years, the number of crashes caused by drivers under the influence of alcohol has decreased by 40%. According to police data, 9% of traffic fatalities are alcohol related. In 2014, the number of alcohol-related crashes decreased by 12.5% from 2013.
Drugs and driving
In Poland, driving under the influence of alcohol and other psychoactive substances is forbidden.
According to the European DRUID (Driving under the Influence of Drugs, Alcohol and Medicines) research project, the prevalence of alcohol in the driving population of Poland, 1.9%, is lower than the EU average of 3.5%. The research indicated that the prevalence of illegal drugs in the EU is 1.9%, while in Poland it is 0.7%.
Distraction
The use of hand-held mobile phones while driving is forbidden in Poland, the use of hands-free phones is allowed.
Sleepiness and fatigue
There is no information available on the impact of sleepiness and fatigue on road crashes in Poland.
Seat belts and helmets
Seat belt use has been compulsory in front seats since 1983 and rear seats since 1991.
Since 1997, children of 0-12 years old and below 150 cm in height have to be seated in a child restraint system adapted to their height and weight. This applies to all motor vehicles. Children must not be transported using a rearward-facing child restraint system in a front seat that is protected by an air bag. The child restraint wearing rate was 93% in 2015.
Table 32.6. Seat belt wearing rate by car occupancy and road type
| % | ||
|---|---|---|
| 2014 | 2015 | |
| Front seat | ||
| Driver | 93 | |
| Passenger | 94 | |
| Urban roads (driver) | 92 | |
| Rural roads (driver) | 92 | |
| Motorways (driver) | 96 | |
| Rear seats | ||
| General | 71 | |
| Children (use of child restraint) | 89 | 93 |
Source: Motor Transport Institute.
Helmet wearing has been compulsory on motorcycles and mopeds since 1997. The helmet wearing rate by riders of powered two-wheelers is nearly 100%.
Helmet use is not compulsory for bicycles.
National road safety strategies and targets
Organisation of road safety
The National Road Safety Council (NRSC; Krajowa Rada Bezpiecze?stwa Ruchu Drogowego) was established on 1 January 2002 under the Act of Road Traffic Law as an auxiliary interministerial body for the Polish Council of Ministers for road safety issues. NRSC is chaired by the minister responsible for transport. The members of the NRSC are high-level representatives of several ministries and governmental institutions. The executive unit is the Secretariat of NRSC, based in the Ministry of Infrastructure and Development. The National Road Safety Council sets directions and co-ordinates activities of government administration in the area of road safety.
The main areas of the National Road Safety Council activities include:
- recommending guidance of state policy
- developing and appraising road safety programmes
- initiating research works, legal acts, international agreements and staff training programmes
- conducting international co-operation
- working closely with social institutions and NGOs
- instigating road safety education, publicity and promotion campaigns
- monitoring and evaluating road safety activities
- implementing the new law for cyclists.
Road safety strategy for 2013-20
The National Road Safety Council adopted in January 2013 a National Road Safety Programme for the period 2013-2020, developed by the Secretariat of the National Road Safety Council and government bodies' experts. It is based on the Vision Zero approach.
Road safety targets
The 2013-2020 programme targets include a 50% reduction in road deaths and a 40% reduction in people seriously injured by 2020, in comparison to 2010 levels.
The targets of the National Road Safety Programme are based on targets of the United Nations Decade of Action for Road Safety and EU recommendations.
Monitoring targets
The National Road Safety Council is in charge of monitoring road safety performance.
At the beginning of 2016 a provisional interim report was published. It was based on the survey among National Road Safety Council members as well as advisors. It is estimated that Poland is on track to reach its fatality target; but not the injury target. Achieving this target would require the adoption and implementation of new and effective measures. The main conclusions of the report are:
- the vision and targets remain the same
- there is a need of dedicated funds for road safety activities
- there is a need to intensify the road safety actions in order to meet the targets.
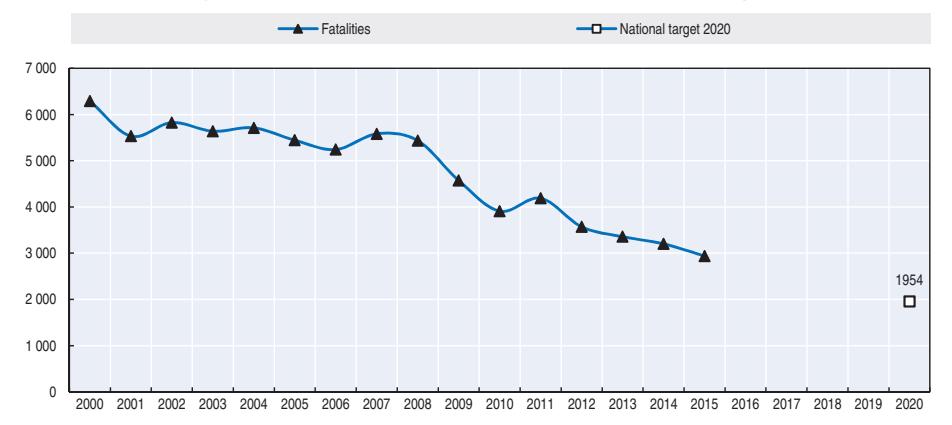
Figure 32.6. Trends in road fatalities towards national target
Recent safety measures (2013-16)
Road safety management
- Implementation of the EU Directive 2008/96/EC on Road Safety Management.
- Creation of the National Road Safety Observatory (2014).
Road users
Speed management
- In 2011, Poland started developing an automatic speed camera system. The new system is overseen by the Road Transport Inspection (GITD). In early 2013 the system had 611 fixed speed cameras (of which 375 were managed by the GITD and 236 by municipal guards). In addition, 29 GITD vehicles were equipped with on-board speed control cameras.
- In May 2015 the penalties for exceeding the speed limit in built-up areas by more than 50 km/h were amended and provide for licence withdrawal for 3 months.
Impaired driving
● Penalties for driving under the influence of alcohol increased in 2015. In addition to possible imprisonment or lifelong driving licence withdrawal, the courts can now request drivers at fault to pay PLN 5 000 to a victims aid fund (PLN 10 000 for recidivists) or PLN 10 000 directly to the victim. In addition, the act introduces the obligation of installing alcolocks in cars for drink driving offenders.
Education and awareness
● Regular awareness campaigns are conducted on the use of seat belts and child restraint systems, as well as on speed and driving under influence of alcohol.
Infrastructure
● A Road Safety Audit is obligatory for all road designs within the Trans-European Transport Network, based on Directive 2008/96/EC, and a training programme for auditors has been prepared in Poland.
Vehicles
● Coaches and buses used for the transport of children during holiday periods are subject to special inspections.
Recent and ongoing research
● In 2015 the Motor Transport Institute joined the European two-year research project "SaferWheels" to investigate motorcycle crashes. Results are expected in 2017.
References
KRBRD (2016), "Koszty zdarze? drogowych w 2014 r wraz z badaniem willingness to pay" ("The costs of road accidents in 2014, based on a willingness to pay approach"), National Road Safety Council, http://krbrd.gov.pl/pl/koszty-zdarzen-drogowych.html (accessed 25 April 2016).
Websites
- Ministry of Infrastructure and Construction: http://mib.gov.pl/.
- National Road Safety Council (KRBRD): www.krbrd.gov.pl.
- National Road Safety Programme for the years 2013-2020: www.krbrd.gov.pl/files/file/Programy/KRBRD-Program-P1a-20140422-S2-K3d-EN.pdf (accessed 25 April 2016).
- Motor Transport Institute: www.its.waw.pl.
- Polish Road Safety Observatory: www.obserwatoriumbrd.pl.
Chapter 33
Portugal
This chapter presents 2014 road safety data for Portugal along with provisional data from 2015. It looks at trends in traffic and road safety from the years 1990 to 2014 and road user behaviour patterns. This includes data on speed, drink driving, drugs and driving, distracted driving, fatigue and seat belt usage. The chapter reviews Portugal's road safety strategy, national targets and the progress achieved thus far. It also looks at recently implemented safety measures.*
* All data stem from the National Authority for Road Safety (ANSR) unless otherwise noted. For more information please contact transito@ansr.pt.
Since 2000, Portugal has seen an accelerated reduction in fatalities, with an average annual decrease of 8.3%. This pattern levelled off in 2014, with 638 fatalities, one more than in 2013. However, provisional data for the first nine months of 2015 show a continuing decreasing trend with a reduction of 4.6% when compared to the same period in 2014. In 2014, Portugal had a mortality rate, expressed in terms of road deaths per 100 000 inhabitants, of 6.1, one-third of what it was in 2000 and below the target established for 2015 by Portugal's National Road Safety Strategy.
Road safety data collection
Definitions applied in Portugal
- Road fatality: A person who died immediately after the crash or within the next 30 days. Until 2010, only fatalities within 24 hours after the crash were recorded. A correction factor of 1.26 was applied in the IRTAD database to match the 30 days definition.
- Seriously injured person: A person hospitalised as a result of the crash for a period of 24 hours or more who did not die within 30 days of the crash.
- Slightly injured person: A person injured as a result of the crash who was not hospitalised or was hospitalised for less than 24 hours and who did not die within 30 days of the crash.
Portugal started computing serious injury data following the European Union definition based on the maximum abbreviated injury scale of 3 or more (MAIS+3) using data from all public hospitals. MAIS3+ data are available for the years 2010 to 2014.
Data collection
In Portugal, the authorities responsible for reporting road crashes are the:
- Public Security Police (PSP) inside urban areas
- National Republican Guard (GNR, Guarda Nacional Republicana) outside urban areas.
When police officers attend a crash they must fill in the standard "BEAV" road crash form. Statistics cover only crashes reported to the police.
The BEAV registration forms are sent to the National Authority for Road Safety (ANSR, Autoridade Nacional Segurança Rodoviária), which is responsible for controlling the quality of data and inserting it into the national road accidents database. Controls consist of checking for duplications, incoherent data or errors.
In Portugal, the severity of an injury is registered by police on the BEAV form. The national road traffic injury database uses only police reports and the number of seriously and slightly injured persons reported by police is not cross-checked with medical services.
A working group with representatives of ANSR, the General Health Directorate, the National Institute for Medical Emergency, the National Statistical Institute and the PSP and GNR has developed a methodology to assess the number of serious injuries using the Maximum Abbreviated Injury Scale of three or more (MAIS+3). The MAIS+3 figures obtained are very similar to the serious injury data reported by the police, with an average ratio of 3 persons with a MAIS of 3 or above for one fatality.
Most recent safety data
Road crashes in 2015 – provisional data
Based on provisional data for the period January to September of 2015, there were 438 road fatalities registered, representing a decrease of 4.6% compared to the same period in 2014.
Road crashes in 2014
In 2014, the road safety indicators have stagnated at the levels of 2013, showing a slightly negative trend. There were 638 road deaths in Portugal, one more person killed compared to 2013. The number of injury crashes increased by less than 1%.
Trends in traffic and road safety (1990-2014)
Traffic
In Portugal no estimate is available for the evolution of traffic volume.
Between 1990 and 2014, the number of motorised vehicles more than doubled, rising from about 2.2 million vehicles in 1990 to 5.7 million in 2014 (+161%).
Road safety
Crashes and casualties
Since 1990, the number of road fatalities has decreased by 78% and the number of injury crashes by 32%.
- Between 1970 and 1989, there was an average annual increase in road deaths of 3.5% and injury crashes of 3.9%. The number of fatalities reached a peak in 1975, with 3 372 persons killed.
- Between 1990 and 2000 there was a steady decrease in the number of fatalities and injury crashes. On a yearly average, the number of fatalities fell by 3.2%.
- Since 2000, the rate of decline has accelerated, with an average annual decrease of 8.3% between 2000 and 2013.
- In 2014, the number of fatalities stagnated.
Although it is not possible to provide a full explanation, several measures contributed to this significant decrease in the number of traffic casualties, including:
- treatment and reduction of black spots, implementation of traffic calming measures and construction of new roads, in particular more than 3 000 km of motorways
- Highway Code update with new traffic rules and penalties
- regular awareness campaigns on television, radio and press, focused on specific targets and issues
- increased enforcement, particularly attentive on speeding, drink driving, and use of seat belts especially on rear seats and child restraint systems
- improved passive safety features of vehicles
- advances in post-impact care.
The economic recession that hit the country has also probably contributed to the important reduction in the number of road deaths since 2008.
Rates
In 2014, Portugal had a mortality rate, expressed in terms of road death per 100 000 inhabitants, of 6.1, one third of what it was in 2000.
Regarding the fatality risk expressed by the number of fatalities per 10 000 motorised vehicles, the situation has also improved substantially, from 13.4 in 1990 to 1.1 in 2014.
Analysis of seriously injured data
The number of people seriously injured per 10 000 motorised vehicles decreased by 76% between 2000 and 2014 (1.5 to 0.4).
| 2014 % change from | |||||||||
|---|---|---|---|---|---|---|---|---|---|
| 1990 | 2000 | 2010 | 2013 | 2014 | 2013 | 2010 | 2000 | 1990 | |
| Reported safety data | |||||||||
| Fatalities | 2 924 | 2 053 | 937 | 637 | 638 | 0.2 | -31.9 | -68.9 | -78.2 |
| Injury crashes | 45 110 | 44 159 | 35 426 | 30 339 | 30 604 | 0.9 | -13.6 | -30.7 | -32.2 |
| Injured persons hospitalised | 12 165 | 6 918 | 2 475 | 1 946 | 2 010 | 3.3 | -18.8 | -70.9 | -83.5 |
| Deaths per 100 000 inhabitants | 29.3 | 20.0 | 8.9 | 6.1 | 6.1 | 0.7 | -31.0 | -69.5 | -79.1 |
| Deaths per 10 000 registered vehicles | 13.4 | 3.9 | 1.6 | 1.1 | 1.1 | 0.2 | -31.0 | -71.1 | -91.7 |
| Traffic data | |||||||||
| Registered vehicles1 (thousands) | 2 188 | 4 743 | 5 795 | 5 723 | 5 721 | 0.0 | -1.3 | 20.6 | 161.5 |
| Registered vehicles per 1 000 inhabitants | 219 | 463 | 548 | 546 | 549 | 0.5 | 0.1 | 18.6 | 150.7 |
Table 33.1. Road safety and traffic data
1 2 http://dx.doi.org/10.1787/888933385633
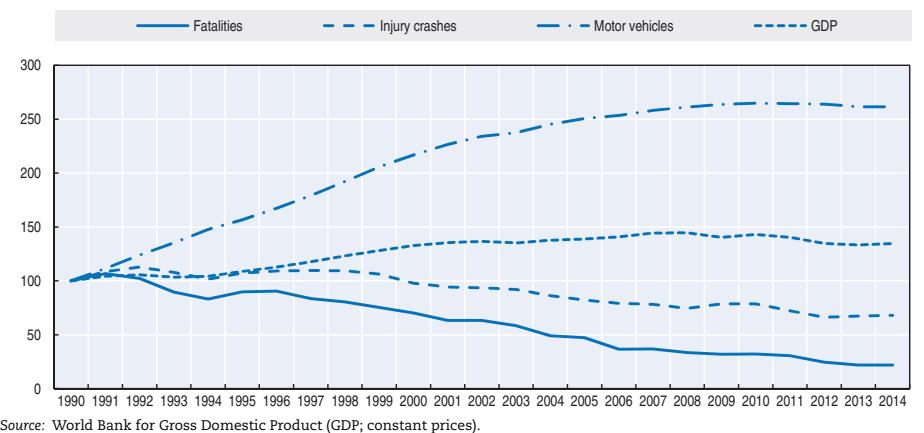
Figure 33.1. Road safety, traffic and GDP trends index 1990 = 100
Road safety by user group
Since 1990, all user groups benefited from the improvements in road safety. Pedestrians and moped users were the groups with the highest reduction in fatalities – by 80.5% and 94.5% respectively.
1. Registered vehicles excluding mopeds.
The progress was less noticeable among motorcyclists; between 1990 and 2014, fatalities for this group decreased only by 14.2%. In 2014, compared to 2013 there was also a marked (+16.7%) increase in the number of motorcyclists killed.
Moped users were the only group in 2014 to benefit from a reduction in fatalities (-15.7%) compared to 2013. However, the improvement for moped rider fatalities must be analysed in conjunction with the lack of popularity of this type of vehicle.
| 2014 % change from | |||||||||
|---|---|---|---|---|---|---|---|---|---|
| 1990 | 2000 | 2010 | 2013 | 2014 | 2013 | 2010 | 2000 | 1990 | |
| Cyclists | 120 | 62 | 31 | 29 | 35 | 20.7 | 12.9 | -43.5 | -70.8 |
| Moped users | 786 | 248 | 77 | 51 | 43 | -15.7 | -44.2 | -82.7 | -94.5 |
| Motorcyclists | 106 | 234 | 128 | 78 | 91 | 16.7 | -28.9 | -61.1 | -14.2 |
| Passenger car occupants | 898 | 809 | 367 | 214 | 223 | 4.2 | -39.2 | -72.4 | -75.2 |
| Pedestrians | 742 | 425 | 195 | 144 | 145 | 0.7 | -25.6 | -65.9 | -80.5 |
| Others | 272 | 275 | 139 | 121 | 101 | -16.5 | -27.3 | -63.3 | -62.9 |
| Total | 2 924 | 2 053 | 937 | 637 | 638 | 0.2 | -31.9 | -68.9 | -78.2 |
Table 33.2. Road fatalities by road user group

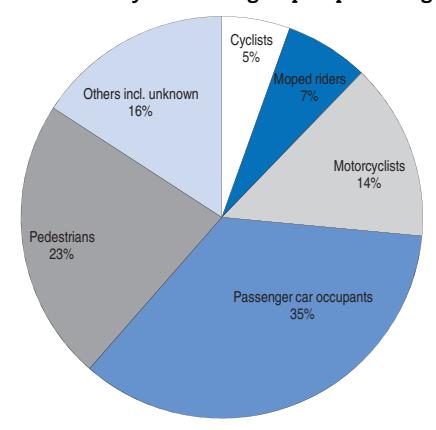
Road safety by age group
Between 1990 and 2014, all age groups benefited from safety improvements, with fatality reductions above 93% for the youngest groups (0 to 20 years old). In the last 10 years (2005 to 2014) the number of deaths and serious injuries among the 0-14 age group fell faster than for any other age group.
The older age group (65+) has shown a slower decrease than the other groups; they also have a significantly higher death rate than the general population. The elderly are particularly vulnerable as pedestrians.
Table 33.3. Road fatalities by age group
| | | | | | | 2014 % change from | | | | | |-------|-------|-------|------|------|------|--------------------|-------------------|-------|-------|--| | Age | 1990 | 2000 | 2010 | 2013 | 2014 | 2013 | 2010 | 2000 | 1990 | | | 0-5 | 47 | 38 | 6 | 5 | 1 | | Figures too small | -97.4 | -97.9 | | | 6-9 | 52 | 20 | 7 | 3 | 3 | for meaningful | | -85.0 | -94.2 | | | 10-14 | 81 | 25 | 5 | 3 | 4 | | comparisons | -84.0 | -95.1 | | | 15-17 | 152 | 60 | 8 | 8 | 11 | 37.5 | 37.5 | -81.7 | -92.8 | | | 18-20 | 282 | 171 | 31 | 24 | 22 | -8.3 | -29.0 | -87.1 | -92.2 | | | 21-24 | 333 | 221 | 60 | 41 | 30 | -26.8 | -50.0 | -86.4 | -91.0 | | | 25-64 | 1 411 | 1 120 | 549 | 357 | 360 | 0.8 | -34.4 | -67.9 | -74.5 | | | 65 | 509 | 377 | 270 | 193 | 206 | 6.7 | -23.7 | -45.4 | -59.5 | | | Total | 2 924 | 2 053 | 937 | 637 | 638 | 0.2 | -31.9 | -68.9 | -78.2 | |
Figure 33.3. Road fatality rates by age group Deaths per 100 000 inhabitants in a given age group, 1990-2014
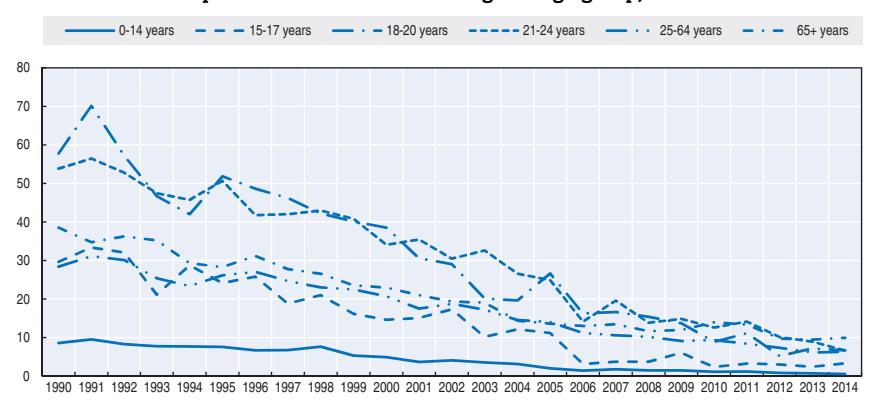
Figure 33.4. Road fatality rate by age and road user group Fatalities per 100 000 inhabitants, 2014
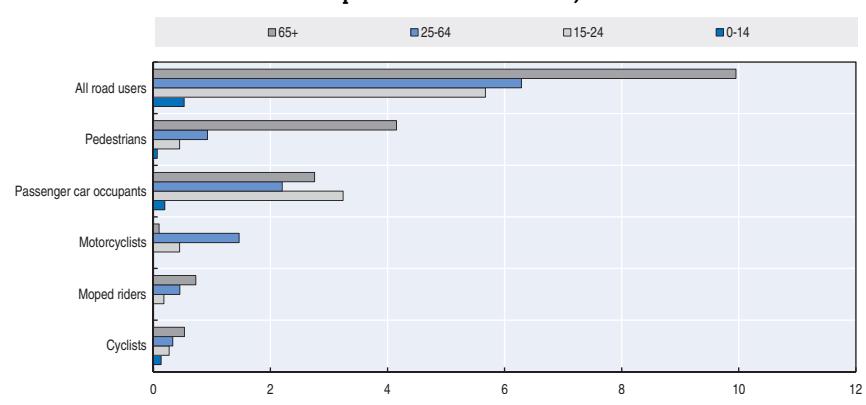
Road safety by road type
In 2014, there were more fatalities in urban areas (54%) than on country roads (38%). Since 1990 there have been more improvements in the reduction of road deaths on rural roads. This is related to the significant increase in the length of the motorway network and black spot treatment.
Urban area fatalities and serious injuries are a major concern and urban road safety remains a priority target of the National Road Safety Strategy.
Compared to 2010, the number of road fatalities on motorways has more than halved, notwithstanding certain increases during the last year. The economic crisis in Portugal led to an important reduction in motorway traffic along with an overall speed reduction. The increase of speed enforcement also contributed to the decrease of road fatalities on motorways. On the other hand, the introduction of tolling on some motorways led to an increase of traffic on alternative roads, possibly affecting the number of crashes on those roads.
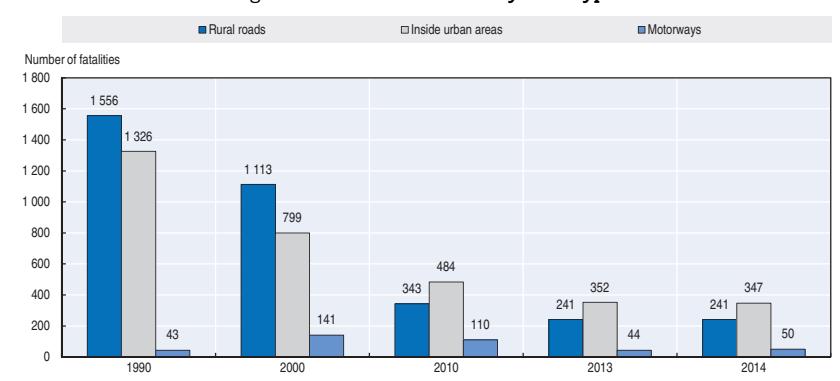
Figure 33.5. Road fatalities by road type
Economic costs of traffic crashes
ANSR and the University of Lisbon (Universidade Autónoma de Lisboa) conducted a study in 2011 to estimate the national costs of traffic crashes.
This study used the methodology of human capital, based on data from several public institutions for a period of 15 years (1996-2010). This method relies mainly on historical data and tends to estimate a value lower than the willingness-to-pay approach. Therefore, the costs presented in this study should be viewed as minimum estimates.
| Unit cost | Total | |
|---|---|---|
| Fatalities | EUR 625 000 | EUR 0.46 billion |
| Hospitalised persons/Serious injuries | EUR 102 000 | EUR 1.43 billion |
| Slight injuries | EUR 26 000 | |
| Property damage costs | ||
| Total | EUR 1.89 billion | |
| Total as % of GDP | 1.2% |
Table 33.4. Cost of road crashes, 2010
Source: ANSR, University of Lisbon.
Recent trends in road user behaviour
Speed
The table below summarises the main speed limits in Portugal. The revised Road Code introduced the concept of "coexistence zones" where vulnerable users are allowed to use the whole extent of the road and drivers shall not compromise the safety or convenience of the vulnerable users. In these coexistence zones the speed limit is 20 km/h.
Table 33.5. Passenger car speed limits by road type, 2016
| General speed limit | |
|---|---|
| Urban roads | 50 km/h |
| Rural roads | 90 km/h |
| Motorways | 120 km/h |
Drink driving
Until 2013, the maximum authorised blood alcohol content (BAC) in Portugal was 0.5 g/l for all drivers. Following the revision of the Road Code that entered into force on the 1 January 2014, a limit of 0.2 g/l applies for novice drivers (licence for up to three years) and professional drivers of emergency/medical service vehicles, taxis, school buses, heavy goods vehicles and dangerous goods transport vehicles.
A drink driving crash is defined as a crash where at least one of the drivers involved is over the legal BAC limit. However, data are incomplete because some drivers involved in road crashes have not been tested, sometimes because they were too seriously injured.
According to the Toxicological Department of the National Institute for Legal Medicine and Forensic Sciences, 27% of drivers killed in road crashes in 2014 were found with a BAC above the legal limit.
Between 2005 and 2014 the number of killed drivers in road crashes with a blood alcohol level above the legal limit decreased by 57%.
Drugs and driving
It is forbidden to drive under the influence of psychotropic substances. Every driver involved in a fatal or serious injury crash is tested for drugs consumption, and the application of roadside drug tests is permitted when there is a suspicion of drugs abuse.
According to the Toxicological Department of the National Institute for Legal Medicine and Forensic Sciences, 10% of killed drivers in 2014 tested positive for drugs.
Distraction and fatigue
Portuguese law allows the use of hands-free mobile phones while driving.
The use of mobile phones and fatigue are part of a new operational objective defined in the review of the National Road Safety Strategy, which aims to better understand the influence of these issues on road crashes.
Seat belts and helmets
Seat belt use has been compulsory in front seats since 1978 and in rear seats since 1994. The seat belt wearing rate in cars is 96% for drivers and front seat passengers and 77% for rear seat passengers. The front seat rate is relatively higher on motorways than on other roads.
The use of child restraint systems is compulsory until the age of 12 or for children less than 135 cm. In 2013, 98% of children traveling in car front seats and 94% in car back seats were using a child restraint system.
Table 33.6. Seat belt wearing rate by car occupancy and road type
| % | |
|---|---|
| 2013 | |
| Front seat | |
| General (driver + passengers) | 96 |
| Rear seats | |
| General | 77 |
| Children (use of child restraint) | 94 |
All riders of powered two-wheelers are required to wear helmets. There is no mandatory helmet use law for cyclists.
National road safety strategies and targets
Organisation of road safety
ANSR is a government agency within the Ministry of Internal Affairs which has the mission of planning and co-ordinating road safety policies in Portugal through the development of national road safety strategies and targets.
Directly dependent on the ANSR, the Road Safety Council is an advisory body chaired by the ANSR president. The council ensures the strategic management and co-ordination of organisations involved in road safety. Members are representatives of PSP and GNR, the Mobility and Transport Institute and the Directorate of Health. The Road Safety Council can also invite other public or private institutions to take part in its meetings.
Although ANSR defines the medium and long-term road safety targets with the support of external expertise, local authorities are invited to collaborate during the process of elaboration of programmes.
The main stakeholders within the road safety sector are:
- other ministries, such as the Ministry of Education, the Ministry of Economy and the Ministry of Justice
- universities, insurance companies, road concessionaires
- non-governmental organisations and associations, such as automobile associations, the Portuguese Road Accident Prevention, Auto-mobilized Citizens Association, the Children Safety Promotion, etc.
Road safety strategy for 2013-2020
The new National Road Safety Strategy, "PENSE 2016-2020" is being developed and will take into account the "Communication from the Commission to the European Parliament, the Council, the European Economic and Social Committee and the Committee of the Regions Towards a European road safety area: Policy orientations on road safety 2011-20".
Although this new National Road Safety Strategy has not yet been formally approved, there is a government interest in applying municipal road safety plans, and specific plans for the protection of pedestrians, providing the cities with the right tools for the implementation of effective road safety measures.
Road safety targets
The current target is to achieve a death rate of 6.2 fatalities per 100 000 inhabitants by 2015.
Monitoring targets
Portugal achieved its 2015 target with a death rate 6.1 fatalities per 100 00 population in 2013 and 2014.
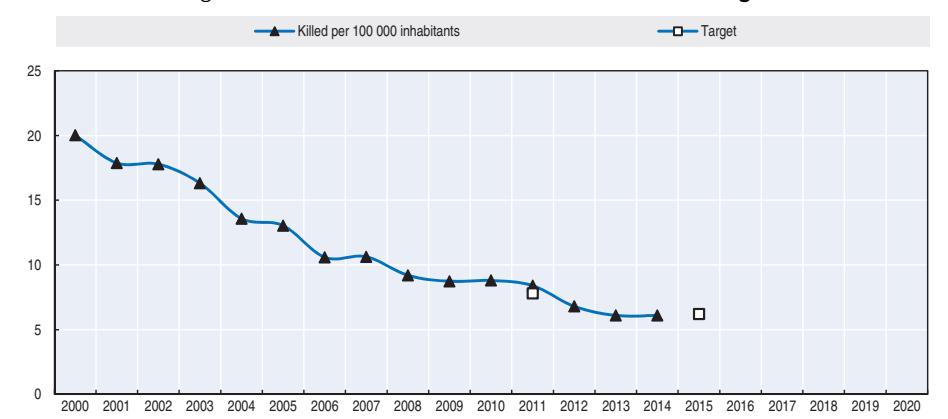
Figure 33.6. Trends in road fatalities towards national target
Recent safety measures (2013-16)
Road users
Speed management
● ANSR has hired a company to implement automatic speed cameras in 2016.
References
Websites
- National Authority for Road Safety (ANSR; Autoridade Nacional de Segurança Rodoviária): www.ansr.pt.
- Mobility and Transport Institute (IMT; Instituto Mobilidade e Transportes): www.imtt.pt.
- Public Security Police (PSP; Polícia Segurança Pública): www.psp.pt.
Chapter 34
Serbia
This chapter presents detailed 2014 and 2015 road safety data for Serbia. It looks at trends in traffic and road safety from the years 1990 to 2015 and road user behaviour patterns. This includes data on speed, drink driving, drugs and driving, distracted driving, fatigue, and seat belt and helmet use. The chapter reviews Serbia's road safety strategy and national targets to 2020 and the performance indicators put into place to help with monitoring. It also highlights the most recently implemented safety measures.*
* The Republic of Serbia joined the International Road Traffic and Accident Database (IRTAD) group in 2013. Data and information provided in this report stem from the Road Traffic Safety Agency (RTSA) unless otherwise noted and have not been validated by IRTAD. For more information contact andrijana.pesic@abs.gov.rs or jovica.vasiljevic@abs.gov.rs.
Serbia has made progress in its data collection process and following a major revision of its database in 2015 is now in line with requirements of the European Commission.
In 2014, there were 536 reported road deaths, a 17.5% decrease compared to 2013. This is the lowest number of fatalities since records began. Excessive or inappropriate speed was responsible for 52% of these fatalities. An increase of 12.1% was noted for 2015 with 601 fatalities, although this is still under 2013 figures and is the second lowest figure since road death data collection began. An improved Law on Road Traffic Safety along with other measures has in part contributed to this progress.
Definitions applied in Serbia
- Road fatality: Any person who died immediately or within 30 days as a result of a road crash.
- Serious injury: Serbia has not yet adopted a definition for serious injury in police records.
Data collection
Data on road deaths are available since 1981. More detailed information on road crashes is available from 1996 onward and is included in the police crash database established in 1996. The last major revision of the road accident database was conducted in 2015. Following this revision, the road accident database is now completely harmonised with the European Commission Common Accident Data Set (CADaS) requirements and since 1 January 2016, the traffic police collect data on road crashes in accordance with the CADaS recommendations. Around 400 traffic police involved in the data collection process during a crash scene investigation have been trained in the new system.
The traffic police must attend the scene of all fatal and injury road crashes and crashes with important material damage (above RSD 200 000 dinars [EUR 2 000]). They are responsible for securing the site, organising relief and collecting data. For other crashes, participants are allowed to fill in the special form, without calling traffic police. However, if one of the participants requires the presence of the traffic police, the traffic police are required to go to the crash scene. Data on crashes not covered by the traffic police are collected by insurance companies.
Information on injury severity is recorded by the traffic police based on information from hospitals. Hospitals are obliged to call the police for every person admitted to hospital claiming to have been involved in a road crash. There is no information on the level of underreporting.
A project named "New Road Safety Database", funded by the World Bank, will be completed at the end of 2016, with the aim of connecting all relevant road safety data holders into a unique database. Most improvements are expected in the field of injury data accuracy and data from insurance companies. This unique database will in particular allow calculation of the number of persons seriously injured with a maximum abbreviated injury score of 3 and above (MAIS3+), which is the definition recommended by IRTAD and the European Commission of a person seriously injured.
This road safety database (operated by Road Traffic Safety Agency) has already been publicly available since June 2015. A link to the database is publicly available through a Web GIS application (http://serbia.gdi.net/azbs/ [accessed 25 April 2016]). Further development is expected in the next few years, especially in terms of providing precise data on the location of each road crash.
Most recent safety data
Road crashes in 2015
In 2015, there were 601 reported road fatalities in the Republic of Serbia. This is an increase of 12.1% when compared to 2014. Nevertheless, this figure is below that of 2013 and is the second lowest number of fatalities since data on road crashes has been monitored in the Republic of Serbia.
Road crashes in 2014
In 2014, there were 536 reported road deaths, i.e. a 17.5% decrease compared to 2013. This is the lowest number of fatalities since 1981.
These relatively good results are partially the result of the improved Law on Road Traffic Safety enacted in 2009, which was accompanied by a series of education, prevention and other measures. In 2014, the institutional organisation and coordination of road safety activities were improved. Serbia also started to implement a number of European Union directives, rules and recommendations, and started to upgrade the Law on Road Traffic Safety during 2015.
Trends in traffic and road safety (1990-2015)
Traffic
Between 2001 and 2014, the number of registered motorised vehicles increased by 35%. Between 2010 and 2015, there was continued growth in the number of registered vehicles reaching an overall increase of 25%.
Road safety
Crashes and casualties
Between 2010 and 2015, the number of fatalities decreased by 8.9%. Serbia reached the lowest number of fatalities since records began in 2014. Between 2010 and 2014, the number of fatalities decreased by 18.8%.
A number of important measures have been implemented since the adoption of the Law on Road Traffic Safety in 2009:
- establishment of institutions like the national Road Traffic Safety Coordination Body, Road Traffic Safety Agency, etc.
- introduction of a penalty point system
- introduction a graduated licensing system (in 2012)
- reduction of the maximum legal blood alcohol content (BAC) to 0.3 g/l
- introduction of a 50 km/h speed limit in urban areas
- compulsory seat belt wearing for rear seats.
Rates
In 2014, the reported death rate per 100 000 inhabitants was 7.5. It rose to 8.4 in 2015.
| | | | | | 2014 % change over | | | | | | |-------------------------------------------|--------|--------|--------|--------|--------------------|-------|-------|--|--|--| | | 2000 | 2010 | 2013 | 2014 | 2013 | 2010 | 2000 | | | | | Reported safety data | | | | | | | | | | | | Fatalities | 1 048 | 660 | 650 | 536 | -17.5 | -18.8 | -48.9 | | | | | Injury crashes | 12 749 | 14 197 | 13 523 | 13 044 | -3.6 | -8.1 | -2.3 | | | | | Deaths per 100 000 inhabitants | 13.9 | 9.0 | 9.1 | 7.5 | -17.1 | -17.0 | -46.1 | | | | | Deaths per 10 000 registered vehicles1 | | 3.7 | 3.0 | 2.4 | -20.3 | -34.6 | - | | | | | Traffic data | | | | | | | | | | | | Registered vehicles1 (thousands) | | 1 810 | 2 170 | 2 246 | 3.5 | 24.1 | | | | | | Registered vehicles per 1,000 inhabitants | | 248 | 302 | 314 | 4.0 | 26.9 | | | | |
Table 34.1. Road safety and traffic data
1 2 http://dx.doi.org/10.1787/888933385649
Figure 34.1. Road safety, traffic and GDP trends index 1990 = 100
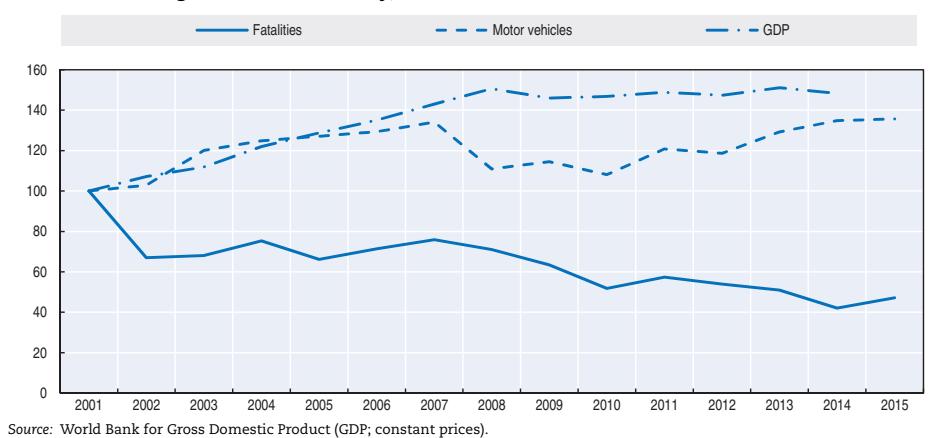
Road safety by user group
In 2015, passenger car occupants represented 45% of traffic fatalities, pedestrians 26% and powered two-wheelers 7%.
The number of motorcyclist fatalities increased significantly between 2000 and 2008, when it reached its highest value. Since 2009, the number of motorcyclist fatalities has decreased overall, with fluctuations from year to year.
Since 2010, the situation has improved for all road users, except cyclists. In 2015 in particular, the number of cyclists killed increased by 38%
Road safety by age group
Since 2000, children under 14 have mostly benefited from road safety improvements. The smallest progress concerned the 18-20 age group, which are particularly at risk in
1. Including mopeds.
Table 34.2. Road fatalities by road user group
| 2015 % change from | ||||||||
|---|---|---|---|---|---|---|---|---|
| 2000 | 2010 | 2013 | 2014 | 2015 | 2014 | 2010 | 2000 | |
| Cyclists | 129 | 65 | 59 | 50 | 69 | 38.0 | 6.2 | -46.5 |
| Moped users | 40 | 22 | 19 | 13 | 13 | 0 | -35.0 | -67.5 |
| Motorcyclists | 29 | 48 | 37 | 43 | 29 | -32.6 | -39.6 | 0 |
| Passenger car occupants | 424 | 278 | 300 | 244 | 269 | 10.2 | -4.6 | -36.6 |
| Pedestrians | 315 | 169 | 175 | 128 | 158 | 23.4 | -8.1 | -49.8 |
| Others | 111 | 78 | 60 | 58 | 63 | 8.6 | -13.7 | -43.2 |
| Total | 1 048 | 660 | 650 | 536 | 601 | 12.1 | -8.9 | -42.7 |
Figure 34.2. Road fatalities by road user group in percentage of total 2015
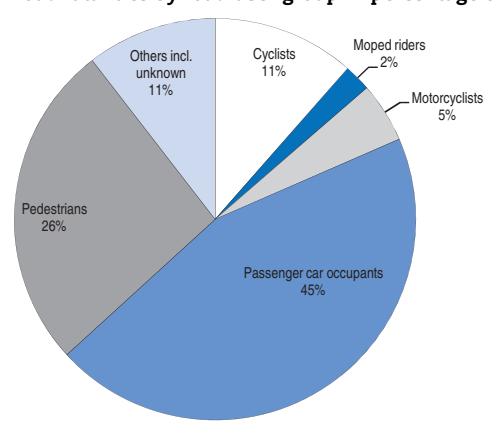
traffic with a fatality rate nearly twice the rate of the average population (13.5 for the 18-20; and 7.5 for the average population).
Elderly people are particularly vulnerable as pedestrians. Half of the pedestrians killed in traffic are aged 65 and over.
Table 34.3. Road fatalities by age group
| | | | | | 2014 % change from | | | |
|-------|-------|--------------|------|------|--------------------------------|-------|-------|--|
| Age | 2000 | 2010
2013 | 2014 | 2013 | 2010 | 2000 | | |
| 0-5 | 12 | 8 | 1 | 4 | | -66.7 | | |
| 6-9 | 18 | 7 | 5 | 1 | Figures too small for
-94.4 | | | |
| 10-14 | 13 | 9 | 5 | 5 | meaningful comparison | | -61.5 | |
| 15-17 | 21 | 8 | 11 | 13 | 18.2 | 62.5 | -38.1 | |
| 18-20 | 50 | 31 | 34 | 31 | -8.8 | 0 | -38.0 | |
| 21-24 | 89 | 50 | 45 | 46 | 2.2 | -8.0 | -48.3 | |
| 25-64 | 587 | 389 | 377 | 306 | -18.8 | -21.3 | -47.9 | |
| 65 | 257 | 154 | 170 | 130 | -23.5 | -15.6 | -49.4 | |
| Total | 1 048 | 660 | 650 | 536 | -17.5 | -18.8 | -48.9 | |
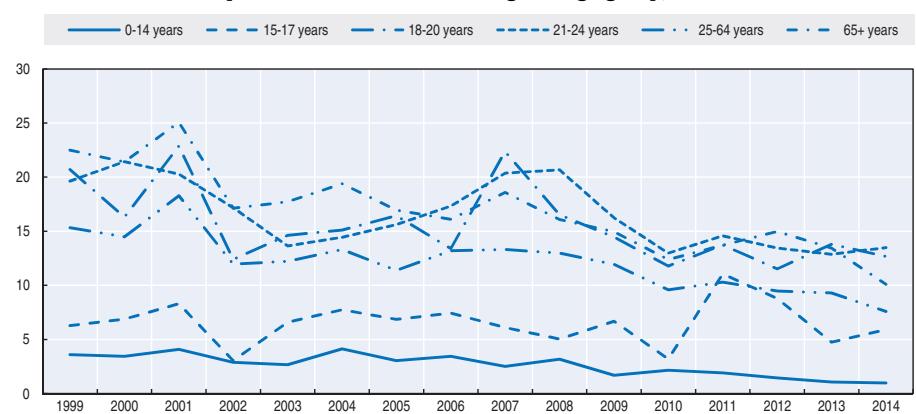
Figure 34.3. Road fatality rates by age group Deaths per 100 000 inhabitants in a given age group, 1999-2014
Figure 34.4. Road fatality rate by age and road user group Fatalities per 100 000 inhabitants, 2014
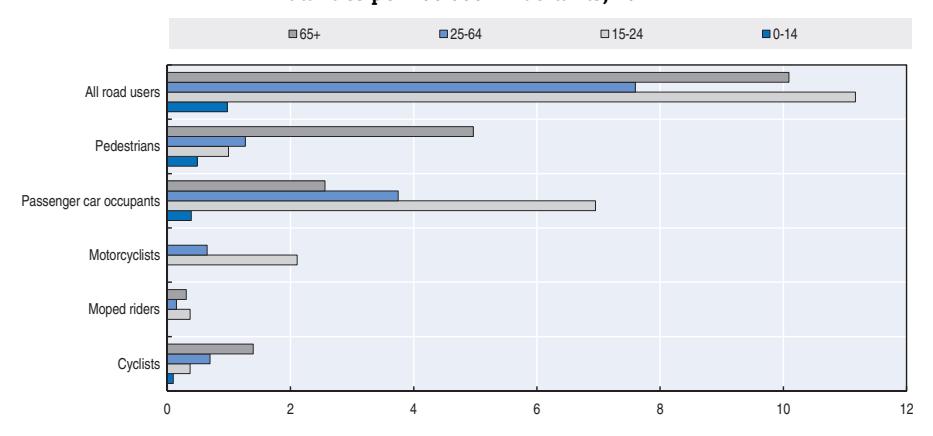
Road safety by road type
Unlike most other IRTAD countries, the majority of fatalities occur inside built-up areas. In 2014, 56% of fatalities occurred in urban roads, 42% on roads outside built-up areas, and 2% on motorways. The most common problems in built-up areas are the following:
- main state roads pass through built-up areas
- local roads and street networks lack adequate features to protect vulnerable road users, especially pedestrians and cyclists.
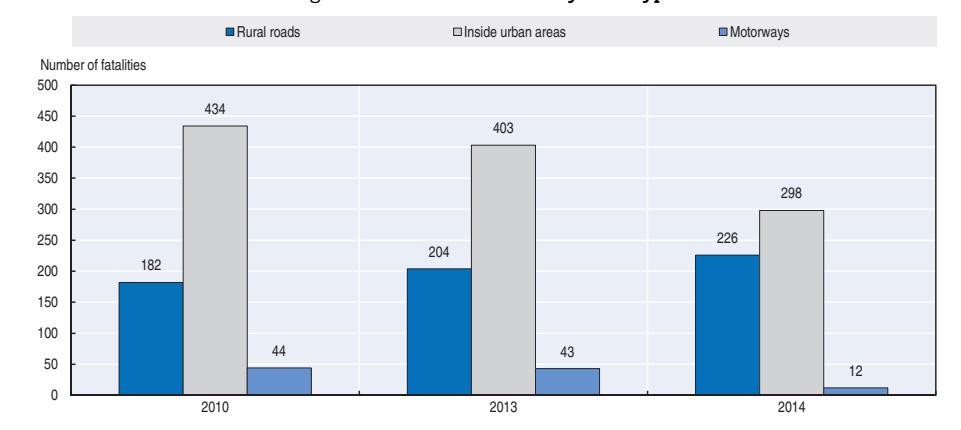
Figure 34.5. Road fatalities by road type
Economic costs of traffic crashes
Based on a recent study (Ross et al., 2012), in 2013 road crashes represented a total cost of about EUR 303.5 million. This estimate was used to guide development of the proposed road safety strategy for the period 2015-20.
Recent trends in road user behaviour
Speed
The table below summarises the main speed limits in Serbia.
Table 34.4. Passenger car speed limits by road type, 2016
| Urban roads | 50 km/h | Speed limits for novice drivers are 90% of the defined speed limits on certain roads. |
|---|---|---|
| Rural roads | 80/100* km/h | |
| Motorways | 120 km/h |
* Speed limit on roads (usually called "motor roads") dedicated only to motorcyclists, passenger cars, cargo vehicles and buses, with or without trailers, marked by a special traffic sign.
Speeding is determined as the most frequent cause of road crashes in Serbia. In 2014, excessive or inappropriate speed was responsible for 52% of fatal road crashes. The implementation of the new crash form (implemented within the CADaS recommendations) will enable a more precise analysis of crash contribution factors, including the contribution of excessive speed for various types of crashes.
Speed measurement conducted in 2015 showed that 51% of passenger car drivers are exceeding the speed limit in urban areas. This share is 47% on motorways and 35% on roads.
Drink driving
In Serbia, the maximum authorised blood alcohol content (BAC) is 0.3 g/l. The limit of 0.0 g/l is applied to the following categories of road users:
- drivers of motor vehicles registered for the transport of more than 8 passengers (not including driver)
- drivers of vehicles with a maximum allowed weight over than 3.5 tonnes
- drivers of motor vehicles for the public transport of people or goods
- drivers of vehicles for special transport or the transport of dangerous goods
- drivers of motorcycles, mopeds, light tricycles and quadricycles
- driving instructors and examiners
- novice drivers and persons who supervise novice drivers
- drivers of vehicles with priority right of way or vehicles in a police escort.
Over the past 10 years, between 5-7% of fatal crashes were attributed to drink driving. A survey conducted in 2015 showed that 0.75% of all drivers were under the influence of alcohol.
Drugs and driving
The Law on Road Traffic Safety forbids driving under the influence of illicit drugs.
Distraction
Distracted driving is recognised as a growing problem in Serbia. However there are no adequate surveys to assess the extent of the phenomenon.
Since 2009, it is illegal to use a hand-held mobile phone or similar device while driving (hands-free devices are allowed). The penalty for this is about EUR 50. It is also illegal for a pedestrian to use a mobile phone or headset while crossing a street.
According to a survey conducted in 2015, 5.2% of all drivers used a mobile phone while driving.
Fatigue and sleepiness
In 2013, fatigue was reported as the main contributing factor in 38 road crashes, causing the deaths of three people.
Seat belts and helmets
Seat belt use has been compulsory for front seats since 1982 and for rear seats since 2009. Child restraints have been compulsory since 2009 for children up to three years old. The Law on Road Traffic Safety under preparation will include new requirements, in particular dedicated child seats for all children between infancy and 12 years of age and below 135 cm in height.
A roadside survey undertaken in 2015 indicated that the seat belt wearing rate is 73% for front-seat occupants and 7.4% for rear-seat occupants. Child restraint use is 44% for children up to 3 years old and only 14.7% for children between 4 and 12 years old.
All riders of powered two-wheelers are required to wear a helmet. In 2015, the helmetwearing rate was 74% for moped riders and 89% for motorcyclists.
There is no mandatory helmet law for cyclists.
Table 34.5. Seat belt wearing rate by car occupancy and road type
| % | ||
|---|---|---|
| 2014 | 2015 | |
| Front seat | ||
| General | 70.3 | 73.0 |
| Driver | 71.6 | 74.4 |
| Passenger | 68.1 | 69.9 |
| Driver – urban roads | 66.2 | 69.7 |
| Driver – rural roads | 73.4 | 77.9 |
| Driver - motorways | 83.8 | 83.2 |
| Rear seats | ||
| Adults | 4.0 | 7.4 |
| Child restraint use | 35.9 children below 3 9.2 children above 3 |
44.3 children below 3 14.7 children above 3 |
National road safety strategies and targets
Organisation of road safety
In Serbia, the leading agency for road safety is the Ministry of Transport with the support of the Road Traffic Safety Agency. The national Road Traffic Safety Co-ordination Body is composed of ministers in charge of traffic issues, interior affairs, health, labour, justice, education, and trade and services, with the main aim being to establish co-operation and harmonise efforts to improve road safety.
The government established the Road Traffic Safety Agency to manage legal and technical issues in the field of road traffic safety. The agency also co-operates with regional and local bodies for road traffic safety.
Road safety strategy for 2015-20
In June 2015, the Republic of Serbia adopted the National Strategy for Road Traffic Safety for the period 2015-20.
Road safety targets and monitoring
The strategy 2015-2020 includes several targets:
- No children killed in traffic by 2020.
- Reduce the number of road deaths and those seriously injured by 50% between 2011 and 2020.
- To halve, between 2011 and 2020, the total annual social-economic costs of road crashes.
To guide actions towards the achievement of these goals, a set of performance indicators has been established based on recommendations from the European SafetyNet project.
| Performance indicators | 2015 level % | Target 2020 % |
|---|---|---|
| Indicators on the use of protective equipment | ||
| Wearing rate of safety belts on front seats in passenger cars | 73 | 95 |
| Wearing rate of safety belts on rear seats in passenger cars | 7.4 | 85 |
| Percentage of the usage of dedicated child restraint system for children under the age of 3 | 44.3 | 96 |
| Wearing rate of protective helmets by riders of motorcycles | 89.3 | 99 |
| Wearing rate of protective helmets by riders of mopeds | 73.9 | 99 |
| Indicators related to speeding | ||
| Percentage of drivers over the speed limit in daylight conditions in urban areas | 51 | 19 |
| Performance indicators | 2015 level % | Target 2020 % |
|---|---|---|
| Percentage of drivers over the speed limit in daylight conditions outside urban areas | 76.33 | 19 |
| Percentage of drivers over the speed limit in daylight conditions on motorways | 46.6 | 19 |
| Percentage of drivers 10 km/h or more above the speed limit in daylight conditions in urban areas | 16.7 | 4.9 |
| Percentage of drivers 10 km/h or more above the speed limit in daylight conditions outside urban areas | 13.1 | 4.9 |
| Percentage of drivers 10 km/h or more above the speed limit in daylight conditions on motorways | 27.3 | 9.9 |
| Indicator related to drink driving | ||
| Percentage of drivers under the influence of alcohol | 0.75 | 0.1 |
| Indicator related to the use of daytime running lights | ||
| Percentage of usage of daytime running lights by passenger cars | 97 | 99 |
366 400 600 800 1 000 1 200 1 400 Fatalities National target 2020
Figure 34.6. Trends in road fatalities towards national target
Recent safety measures (2013-16)
Road safety management
● In 2014 and 2015, the establishment of local bodies in charge of road traffic safety continued. At the end of 2015, such bodies were established in 149 municipalities, out of 161 local communities (municipalities and cities) that needed to have one. In the coming years, efforts will focus on improvements of the professional capacities of these bodies. Educational seminars have been organised in order to strengthen the knowledge of local communities' representatives in road traffic safety, and this project continues in 2016.
2000 2001 2002 2003 2004 2005 2006 2007 2008 2009 2010 2011 2012 2013 2014 2015 2016 2017 2018 2019 2020
● In order to decentralise road safety activities to each local community, two crucial steps have been taken. In the first half of 2015, each local community received a road safety analysis based on road crash data, injuries and safety performance indicators. Those road safety analyses were prepared by the Road Traffic Safety Agency. The objective is to provide all local communities with a basic and common review so that they can quickly start to create measures based on data. Secondly, through a process of benchmarking of local communities, the road safety system in each local community is evaluated, and best practice is transferred across different local communities.
Safety data management
- In 2015, Serbia completed training of the traffic police to collect data on road accidents according to the CADaS recommendations by the European Commission.
- Since 2015, the Road Safety Database is publicly available through the Web GIS Application (http://en.abs.gov.rs/database [accessed 25 April 2016]). Users are able to choose filters and columns for data exporting and can easily get a wide range of different analysis. The database and web-based application will be further developed in 2016.
Legal Regulations
● The new law on the working hours of mobile workers in road transport and tachographs (Official Gazette of RS, No. 96/15) was adopted and published in November 2015. This law gives clear legal power to control officers to check compliance with Regulation (EC) No. 561/2006, as well as to fulfil obligations regarding percentages and numbers of checked drivers' working hours in compliance with Directive 2006/22/EC of the European Parliament and of the Council.
Road users
Media campaigns
- Several safety campaigns were launched or pursued in 2015. The Road Traffic Safety Agency conducted four nation-wide road traffic safety campaigns:
- ❖ Click for life fasten your seatbelt (to increase usage of seatbelts).
- ❖ #BIRAMZIVOT (#ICHOOSELIFE) targeting young drivers.
- ❖ Do not drink and drive.
- ❖ Work together for child safety in road traffic.
Education, training and enforcement
- In 2015, Serbia began conducting obligatory seminars for knowledge improvement of licenced lecturers, instructors and examiners who work in the new-driver licencing system (driving schools' system). These seminars will continue in future.
- The Road Traffic Safety Agency manages two important educational projects. The first is peer education for future drivers in high schools. The second is called "I'm still driving", in which paraplegics injured in a road crash present the importance of safe behaviour in road traffic through their own experience. The Road Traffic Safety Agency also regularly conducts education for children in elementary schools through a mascot who knows all the road traffic rules and behaves safely in traffic.
Vehicles
● During 2015, trailer manufacturers concluded a homologation process.
Recent and ongoing research
Three important research projects were completed in 2015:
● Benchmarking of road safety at a local level and development of a road safety management system in local communities. The Road Traffic Safety Agency launched a pilot project in 11 local communities. The purpose of the project is to identify needs and problems of local communities and to transfer best practise between local communities.
- In 2013, Serbia started monitoring road safety performance and road user behaviour through a set of safety performance indicators. Monitoring is conducted by the Road Traffic Safety Agency twice a year.
- The Road Traffic Safety Agency ordered a project named "Analysis of educational needs of children in pre-school and elementary school".
More information can be found at: http://en.abs.gov.rs/brochures (accessed 25 April 2016).
References
Ross et al. (2012), Costs of road accidents, The Republika Srpska, Banja Luka.
Websites
● Road Traffic Safety Agency of Serbia: www.abs.gov.rs.
Chapter 35
Slovenia
This chapter presents 2014 road safety data for Slovenia along with an overview of results from 2015. It looks at trends in traffic and road safety from the years 1990 to 2014 and road user behaviour patterns. This includes data on speed, drink driving, drugs and driving, distracted driving, and seat belt and helmet use. The chapter reviews Slovenia's road safety strategy and national targets to 2022 and the progress achieved thus far. It also highlights the most recently implemented safety measures.*
* All data stem from the Slovenian Traffic Safety Agency and IRTAD unless otherwise noted. For more information please contact: andraz.murkovic@avp-rs.si.
Slovenia recorded a 14% decrease in road fatalities in 2014, with young people especially benefiting; only 5 fatalities occurred in the under 20 year-old group. However, Slovenia recorded an increase of 11% in 2015, with 120 deaths. New initiatives were implemented in 2015 focusing on enhanced safety for pedestrians, older drivers and those using school routes.
Road safety data collection
Definitions applied in Slovenia
- Road fatality: Any person killed immediately or dying within 30 days as a result of a road crash.
- Seriously injured person: Any person who sustains injuries from a road traffic crash entailing temporary or permanent health damage or temporary or permanent reduced ability to work.
- Slightly injured person: Any person injured excluding persons seriously injured.
Data collection
In Slovenia, crash data are collected by the police, which is the main source of information for road fatalities and injuries. The police confirm information on the severity of injuries with the hospitals. But there is not as yet any procedure in place for linking data.
With support from the Institute of Public Health, the Traffic Safety Agency has started work on estimating the number of persons injured with a Maximum Abbreviated Injury Scale of 3 or more (MAIS3+), using the conversion tables provided by the European Commission to convert injury information based on the 10th revision of the International Statistical Classification of Diseases and Related Health Problems (ICD-10) into MAIS3+ data. Further work is still needed before Slovenia can publish MAIS3+ data.
Most recent safety data
Road crashes in 2015 – final data
In 2015, there were 112 fatal crashes and 120 persons were killed, 12 more than in 2014 (an increase by 11%). The number of people severely injured increased by 13% from 826 to 932.
Several factors explain this negative trend, including a higher interaction between unprotected users and motorised road users in cities. Vulnerable road users (pedestrians, cyclists, powered two-wheeler riders) accounted for 47% of all fatalities in 2015. This is the highest share of vulnerable road users killed in the last five year period. There were 55 car occupants killed (46% of all fatalities), 25 motorcyclists (21%), 16 pedestrians (13%), 14 cyclists (12%) and 10 fatalities among other users.
Road crashes in 2014
In 2014, there were 108 fatalities on Slovenian roads, a 14% decrease from 2013. However, the number of persons severely injured increased by 17%. The reduction in fatalities mainly benefited motorcyclist riders and cyclists (19% fewer compared with 2013). The number of vulnerable road users killed decreased by 23%. Fatalities among car occupants increased by 5%.
Slovenia is on track towards the target set in the 2013-22 road safety programme.
Trends in traffic and road safety (1990-2014)
Traffic
Since 1990, traffic (in vehicle-kilometres) has more than doubled and the vehicle fleet has increased by 75%. In the last eight years, the number of registered motorcycles increased by 65%.
Road safety
Crashes and casualties
Fatalities peaked in 1979, when 735 people died on the roads. Since then the number of road deaths has steadily decreased, with a period of relative stagnation between 2002 and 2007. Fatalities declined noticeably from 2007 to 2010, probably due to the new motorway toll system, regular media campaigns promoting road safety and the Road Safety Act that came into force in 2008. From 2010 to 2014, the number of road fatalities decreased by 22%, from 138 to 108.
In 2013, Slovenia launched a new National Road Safety Programme 2013-22 with the goal of reducing the number of fatalities and severely injured by 50%.
Rates
Between 1990 and 2014, the mortality rate, expressed in terms of deaths per 100 000 inhabitants, was reduced by 80%. The fatality risk expressed in terms of deaths per billion vehicle-kilometres was reduced by 90%. In 2014, Slovenia had a mortality rate of 5.2 deaths per 100 000 inhabitants and a fatality risk of 6.1 deaths per billion vehiclekilometres.
| | | | | | | | 2014 % change from | | | | |-------------------------------------------|-------|--------|--------|--------|--------|-------|--------------------|-------|-------|--| | | 1990 | 2000 | 2010 | 2013 | 2014 | 2013 | 2010 | 2000 | 1990 | | | Reported safety data | | | | | | | | | | | | Fatalities | 517 | 314 | 138 | 125 | 108 | -13.6 | -21.7 | -65.6 | -79.1 | | | Injury crashes | | 8 951 | 7 596 | 6 542 | 6 464 | -1.2 | -14.9 | -27.8 | | | | Deaths per 100 000 inhabitants | 25.9 | 15.8 | 6.7 | 6.1 | 5.2 | -13.7 | -22.3 | -66.8 | -79.8 | | | Deaths per 10 000 registered vehicles | 6.9 | 3.2 | 1.0 | 0.9 | 0.8 | -14.7 | -24.1 | -75.5 | -88.6 | | | Deaths per billion vehicle kilometres | 65.1 | 26.7 | 7.7 | 7.2 | 6.1 | -15.6 | -21.2 | -77.2 | -90.6 | | | Traffic data | | | | | | | | | | | | Registered vehicles (thousands)1 | | | 1 332 | 1 355 | 1 373 | 1.3 | 3.1 | | | | | Vehicle kilometres (millions) | 7 945 | 11 759 | 17 826 | 17 295 | 17 578 | 1.6 | -1.4 | 49.5 | 121.2 | | | Registered vehicles per 1 000 inhabitants | | | 651 | 658 | 666 | 1.2 | 2.4 | | | |
Table 35.1. Road safety and traffic data
1 2 http://dx.doi.org/10.1787/888933385653
1. Registered vehicles including mopeds.
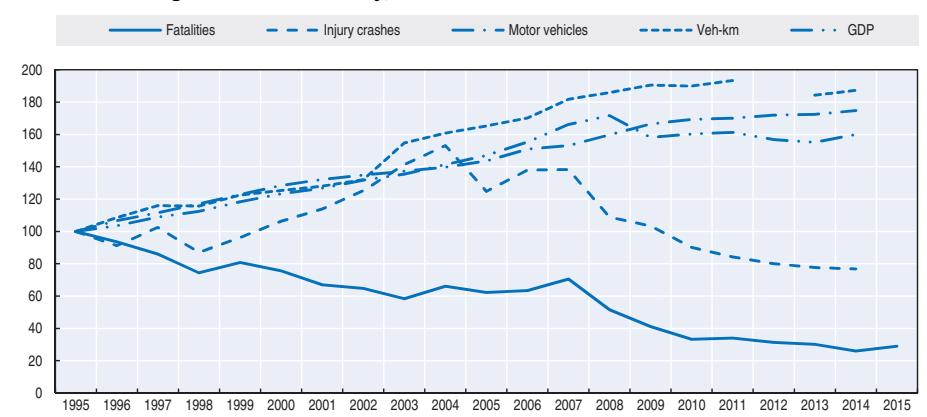
Figure 35.1. Road safety, traffic and GDP trends index 1995 = 100
Source: World Bank for Gross Domestic Product (GDP; constant prices).
Road safety by user group
Since 2000, all user groups have benefited from improved safety, although the improvement has been modest for motorcyclists.
| | | | | | 2014 % change from | | | | |-------------------------|------|------|------|------|--------------------|-------|-------|--| | | 2000 | 2010 | 2013 | 2014 | 2013 | 2010 | 2000 | | | Cyclists | 26 | 16 | 16 | 13 | -18.8 | -18.8 | -50.0 | | | Moped users | 21 | 6 | 3 | 2 | -33.3 | -66.7 | -90.5 | | | Motorcyclists | 19 | 17 | 18 | 15 | -16.7 | -11.8 | -21.1 | | | Passenger car occupants | 179 | 68 | 57 | 59 | 3.5 | -13.2 | -67.0 | | | Pedestrians | 60 | 26 | 20 | 14 | -30.0 | -46.2 | -76.7 | | | Others | 9 | 5 | 11 | 5 | -54.5 | 0 | -44.4 | | | Total | 314 | 138 | 125 | 108 | -13.6 | -21.7 | -65.6 | |
Table 35.2. Road fatalities by road user group
Road safety by age group
Since 2000, all age groups have benefited from the improvements in road safety, with the best results for children and young people (0-20).
In 2014, there was no road fatality among children aged five and under and for those between 10 and 14. There were only 2 road fatalities among the 18-20.
The senior citizen is now the age group the most at risk in traffic. They are particularly vulnerable as pedestrians.
Road safety by road type
In 2014, around half (48%) of the fatalities occurred on rural roads, 37% on urban roads and 15% on motorways. Since 2000, the number of fatalities decreased more rapidly on the rural network.
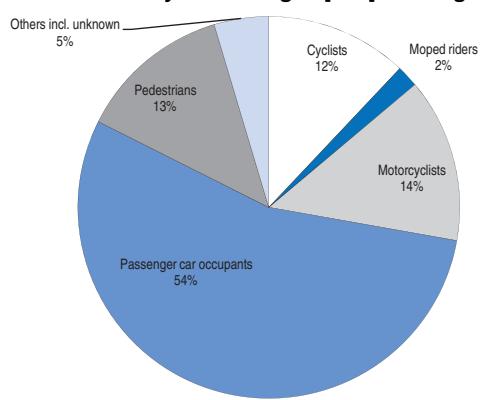
Figure 35.2. Road fatalities by road user group in percentage of total 2014
Table 35.3. Road fatalities by age group
| Age | | | | | 2014 % change from | | | | |
|-------|------|------|------|------|--------------------|----------------------------------------------|-------|--|--|
| | 2000 | 2010 | 2013 | 2014 | 2013 | 2010 | 2000 | | |
| 0-5 | 2 | 2 | 0 | 0 | | | | | |
| 6-9 | 2 | 0 | 2 | 2 | | | | | |
| 10-14 | 4 | 0 | 1 | 0 | | Figures too small for meaningful comparisons | | | |
| 15-17 | 18 | 4 | 2 | 1 | | | | | |
| 18-20 | 23 | 3 | 9 | 2 | -77.8 | -33.3 | -91.3 | | |
| 21-24 | 28 | 16 | 12 | 7 | -41.7 | -56.3 | -75.0 | | |
| 25-64 | 181 | 82 | 71 | 70 | -1.4 | -14.6 | -61.3 | | |
| > 65 | 56 | 31 | 28 | 26 | -7.1 | -16.1
-53.6 | | | |
| Total | 314 | 138 | 125 | 108 | -13.6 | -21.7 | -65.6 | | |
Figure 35.3. Road fatality rates by age group Deaths per 100 000 inhabitants in a given age group, 1994-2014
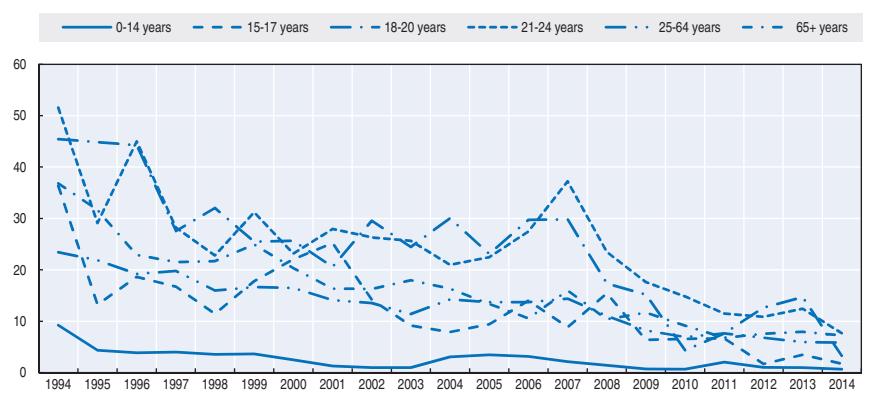
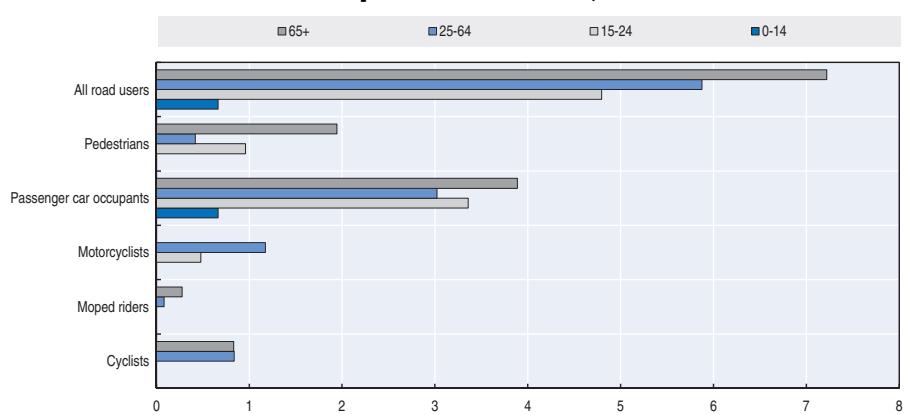
Figure 35.4. Road fatality rate by age and road user group Fatalities per 100 000 inhabitants, 2014
Figure 35.5. Road fatalities by road type
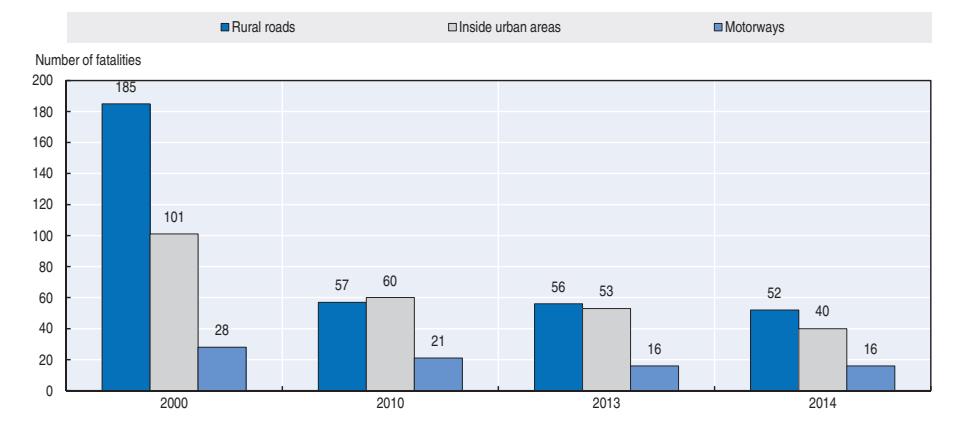
Economic costs of traffic crashes
Traffic crashes represent a significant cost for society, estimated in 2014 at around EUR 1 billion, or 2.69% of GDP. The figure is based on the number of reported crashes and an estimate of non-reported crashes, using the methodology Harmonised European Approaches for Transport Costing and Project Assessment (HEATCO), adapted to the specific conditions of Slovenia.
Table 35.4. Costs of road crashes, 2014
| Unit cost | Total | |
|---|---|---|
| Fatalities | EUR 1 624 464 | EUR 182.05 million |
| Hospitalised persons | EUR 188 695 | EUR 205.80 million |
| Slight injuries | EUR 18 608 | EUR 385.95 million |
| Property damage costs | EUR 228.37 million | |
| Total | EUR 1 002.18 million Includes estimates for non-reported crashes |
|
| Total as % of GDP | 2.69% |
Recent trends in road user behaviour
Speed
Speeding is a major cause of traffic crashes in Slovenia. In 2014 the number of traffic crashes caused by speeding was reduced by 7% when compared to 2013. However, speeding is still a major cause of traffic crashes in Slovenia. In 2014, 31% of road fatalities involved speeding.
Speeding is an important issue particularly in urban areas; where the average speed is well above the 50 km/h speed limit. In 2013 the average speed during daytime was 122 km/h on motorways, 79 km/h on rural roads and 55 km/h on urban roads
The table below summarises the main speed limits in Slovenia .
Table 35.5. Passenger car speed limits by road type, 2016
| General speed limit | Comments |
|---|---|
| 50 km/h | Average speed on day time: 55 km/h V85*: 67 km/h |
| 90 km/h | Average speed on day time : 65 km/h V85*: 80 km/h |
| 110 km/h (it was 100 km/h until 2011) |
|
| 130 km/h | Average speed on day time : 110 km/h V85*: 131 km/h |
* V85 is the 85th percentile speed, i.e. the speed that is not exceeded by 85% of the vehicles.
Drink driving
The maximum permissible blood alcohol content is 0.5 g/l for most drivers and 0.0 g/l for professional drivers and drivers who have had their licence for fewer than three years. Driving under the influence of alcohol is a major safety issue in Slovenia and is responsible for about one-third of serious injury crashes.
A crash is defined as an alcohol related crash when one of the active participants has a blood alcohol content above the limit.
In 2014, 23% of road fatalities were caused by drunk drivers. The number of drink driving crashes was reduced by 8% in 2014 compared to 2013 and the number of road users killed due to drink driving was reduced by 34%. The average blood alcohol content of drivers involved in a fatal crash was 1.45 g/l.
Drugs and driving
A crash is defined as a drug related crash when one of the participants tests positive for drugs (via a blood test).
In 2014, the official statistics attribute 0.3% of traffic crashes to drivers under the influence of drugs. However it should be noted that police officers very rarely check if the driver is under influence of drugs.
Distraction
The use of hand-held mobile phones while driving is not allowed in Slovenia. The use of hands-free devices is tolerated. There is no statistical data available on the effect of mobile phone use on Slovenian traffic crashes.
Sleepiness and fatigue
There is no data available on the influence of fatigue on crashes.
Seat belts and helmets
Seat belt use has been compulsory in front seats since 1977 and in rear seats since 1998. In 2011, the rate of seat belt use was 94% in front seats and 66% in rear seats for adults.
Dedicated child restraint is compulsory for children under 150 cm. Child restraint use on rear seats is 94% for children under 8 years old and seat belt use is 87% for children 8-14 (2011 data).
In 2014, 9 of the 41 drivers killed in traffic accidents were not wearing a seat belt.
% 2011 Front seat General (driver + passengers) 94 Rear seats General 66 Children 0-7 (use of child restraint) 94 Children 8-14 87
Table 35.6. Seat belt wearing rate by car occupancy and road type
A helmet is compulsory for riders and passengers of motorcycles and mopeds. Helmets are also compulsory for cyclists under 15 years.
There is no data available on the helmet-wearing rate for motorcycle and moped riders. A survey conducted in 2011 in Ljubljana and Maribor – the two largest cities in Slovenia – showed that 5% of cyclists wore a helmet.
National road safety strategies and targets
Organisation of road safety
The Slovenian Traffic Safety Agency was created in 2010, in accordance with the Road Traffic Safety Act of 1 September 2010. It is an independent agency financially linked to the Ministry of Infrastructure.
The agency is the main national traffic safety organisation, bringing together expertise in the road safety field. The agency's mission covers research and analysis, preventive and educational programmes, support for development of programmes for national road safety, drivers, vehicles and driver rehabilitation. The agency will also take over independent investigation of fatal crashes.
Road safety strategy for 2013-22
The Slovenian National Road Safety Programme 2013-22 was adopted by the government in March 2013. The programme is based on Vision Zero, aiming at no fatalities or seriously injured persons on Slovenian roads. Priorities addressed in the national road safety programme are:
- driver education and training
- preventative action and media campaigns for vulnerable road users such as pedestrians, children, the elderly and cyclists
- measures against the main killers on the roads: speed and alcohol. Implementation of the National Road Safety Programme has been established at three levels:
- Political level: The parliament reviews the programme annually.
- Strategic level: A board of directors, nominated by the government, prepares the strategy, defines the main measures and assigns responsibilities for them. It also provides financial and other resources and monitors the programme.
- Professional level: An inter-ministerial working group was established to monitor and implement the programme, bringing together individual experts, organisations and nongovernmental organisations in the field of road safety. Local councils, civil society and some companies are also involved.
In the framework of the 2013-22 strategy, biennial action plans are elaborated. The current action plan covers the years 2015 and 2016.
Road safety targets
The main target is, by 2022, to halve the number of fatalities and those seriously injured, attaining a fatality rate below 3.5 fatalities per 100 000 inhabitants and fewer than 230 seriously injured per million inhabitants.
Monitoring targets
A board of directors regularly monitors the implementation of the National Road Safety Programme. It provides strategic guidelines towards the achievement of national road safety targets. In 2015, the board of directors made an in-depth evaluation of the 2014 action plan and submitted their recommendations to parliament.
As of 2014, with 108 road deaths, Slovenia seems on track to reach its 2022 target. An average annual reduction of 4-5% should be maintained to reach the target.
Recent safety measures (2013-16)
Road safety management
● In 2013, the government established a board of directors to monitor lead and supervise the implementation of the National Road Safety Programme.
Road users
Driving licence
● In 2014, Slovenia introduced an electronic test for the theory section of the driving test.
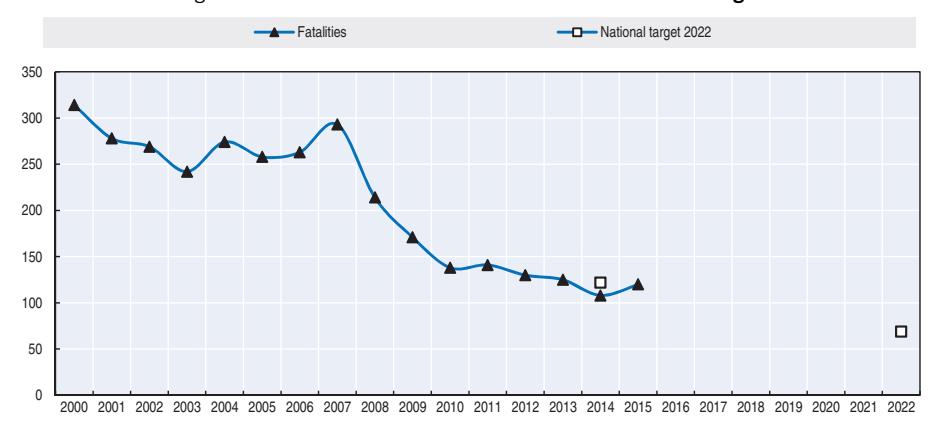
Figure 35.6. Trends in road fatalities towards national target
Cycling
- Safe cycling: The Slovenian Traffic Safety Agency has launched a pilot project focusing on the promotion of safe cycling in the wider context of mobility, sustainable transport, and health and congestion policy. Within this project, a new measure, "sharrow", has been implemented in Maribor, Slovenia's second largest city. Sharrow is shared-lane marking to indicate a shared space for cyclists and drivers. A symbol placed in the centre of a lane indicates that a bicyclist may use the full lane. Cyclist counters are being introduced in the capital Ljubljana to record cyclist activity. The cyclist counter is devoted to promoting cycling and increasing bicycle use. The Slovenian Traffic Safety Agency is conducting before/after analysis on the two implemented measures and is organising other activities to promote safe cycling.
- In May 2015 a preventive campaign was co-ordinated by the Slovenian Traffic Safety Agency to increase responsible behaviour among cyclists and also among other road users. The focus was also on the benefits of safety helmets.
Pedestrian safety
● In March 2015, a new initiative, "a safe and friendly community for pedestrians", was implemented to promote good practice and effective safety measures for pedestrians. Municipalities achieving a safe and friendly community for pedestrians are rewarded.
Education and awareness
- Road safety campaigns are regularly conducted focusing on the main road safety topics (speeding, drink driving, seatbelt use, etc.…)
- A campaign to improve road safety among elderly road users was launched in March 2015. It includes refreshment classes on traffic regulations, sessions on safe motorway driving, practical advice on health criteria, driving with a driving instructor, test driving simulator etc. Preventive events are organised in different municipalities all over Slovenia.
● In August and September 2015 campaigns focused on safe routes to schools. Activities included the review of school paths, a review and update of the school path maps, meetings with school teachers and parents and promotion of the priority of pedestrians at pedestrian crossings in urban areas.
Infrastructure
- The road network is regularly audited, with identification and treatment of high risk sections.
- In 2015, a set of measures was implemented to prevent "wrong way" driving on the motorway network, including the installation of new traffic signs and equipment on public roads.
- In September 2014, the Slovenian Traffic Safety Agency organised training for road safety auditors. These sessions involved local and foreign experts, who presented innovations in the field of road safety auditing and inspection.
References
Websites
- Slovenia Traffic Safety Agency: www.avp-rs.si.
- Slovenian Infrastructure Agency : www.di.gov.si/en/.
- Slovenian Traffic Statistics: www.policija.si/eng/index.php/statistics (accessed 20 April 2016).
Chapter 36
South Africa
South Africa joined the International Road Traffic and Accident Database (IRTAD) group in 2016. This chapter presents 2014 and 2015 road safety data for South Africa. It looks at trends in traffic and road safety from the years 1990 to 2014 and road user behaviour patterns. This includes regulations on speed, drink driving, drugs and driving, distracted driving, fatigue and seat belt usage. The chapter reviews South Africa's road safety strategy and national targets, along with recently implemented safety measures and current research projects.*
* The Road Traffic Management Corporation (RTMC) joined the International Road Traffic and Accident Database group in 2016. Data included in this report have not been validated by IRTAD. All data stem from RTMC. For more information please contact: MagadiG@rtmc.co.za
South Africa has made strides in reducing road crash fatalities since their peak in 2006. However, numbers still remain relatively high at 26 deaths per 100 000 inhabitants. Pedestrians and children are particularly affected. The fact that almost 60% of the road crash casualties were less than 35 years old and that there was a 2% increase in road fatalities between 2014 and 2015 has necessitated the need to focus more effort on road safety. Additional research is being undertaken to identify innovative ways of reducing road fatalities and injuries.
Road safety data collection
Definitions applied in South Africa
- Road fatality: Any person killed during or immediately after a crash, or death directly attributable to a crash within 30 days of such a crash.
- Seriously injured: Any person sustaining injuries to such an extent that hospitalisation is required. Serious injuries include fractures, concussion, internal injuries, severe cuts and lacerations, severe shock, etc. which require medical treatment, hospitalisation and/ or confinement to a bed.
- Slightly injured: Any person sustaining minor cuts and bruises, sprains and light shock which may be treated at the scene of the crash or at home.
Data collection
In South Africa, the police and traffic authorities collect motor vehicle crash data using Accident Report (AR) forms. The data collection procedure is conducted on behalf of the Road Traffic Management Corporation (RTMC), which has a legislative responsibility to report on the information.
Data is then sent to RTMC which generates, consolidates, interprets, analyses and compiles State of Road Safety reports. Fatal crashes are reported within 24 hours using quick response forms. South Africa records fatalities in accordance with the 30 day international standard.
The Culpable Homicide Crash Observation Report (CHoCOR) forms are used to collect fatal crash data on a daily basis. The South African Police Service (SAPS) is the primary source of the fatal crash data. RTMC receives a list of all recorded fatal crashes from SAPS as well as the CHoCOR forms from the various police stations. RTMC then captures, processes and verifies the data in order to compile a consolidated report. There are continuous engagements with provinces to validate the integrity of the submitted information.
The management of road traffic information across the local, provincial and national authorities continues to be ineffective. Police records alone are usually inadequate to carry out an analysis on the nature and consequences of serious injuries and other risk factors associated with crashes. To address this, initiatives are being undertaken to strengthen co-operation between the bodies involved in road traffic data. In an effort to move towards an integrated road traffic information management, a new database is being developed in collaboration with the Council for Scientific and Industrial Research (CSIR) in partnership with Statistics South Africa (STATS SA).
There is currently a process underway to expand the data sources by obtaining road crash information from other stakeholders.
Information included in this report corresponds to the consolidated set of the SAPS data.
Most recent safety data
Road crashes in 2015 – final data
In 2015, 12 944 road fatalities were reported by RTMC, a 2% increase compared to 2014
The country experiences its worst road crash performance during the months of May, August and December. This is linked to school and work recess periods whereby there is significant amount of travelling. On the other hand, the lowest fatalities are recorded during the months of January, February and November.
Road crashes in 2014
In 2014, there were 12 702 reported fatalities, a 7% increase when compared to 2013.
Trends in traffic and road safety (1990-2014)
Registered vehicles
Since 1990, the vehicle fleet has increased by a yearly average of 3.6 %. The sharp rise in 1994 (16.9%) is related to political and economic changes in the country which led to increased purchasing power.
Passenger cars represent 65% of the motorised fleet, light duty vehicles 22%; trucks 3%, motorcycles 3% and buses and minibuses 3%
Road safety
Crashes and casualties
Between 1990 and 2000, the reported number of road fatalities fluctuated around 9 500 per annum. After 2000, the number increased significantly and reached a peak in 2006 with more than 15 000 reported road deaths. The country has since implemented a wide range of interventions which have produced positive results and a steady decline in fatal crashes.
Despite the recent progress, the number of traffic fatalities is still high, almost 13 000 people continue to die annually on South African roads. The high number of serious injuries from road crashes means that many survivors of severe crashes will never recover completely, often resulting in grave consequences for their quality of life and ultimately negatively affecting the economy.
Aware of the current road safety challenges, the Department of Transport aims, through its road agencies, to:
- make roads and roadsides safer
- strengthen traffic law enforcement
- set safer speed limits
- promote the development of safer vehicles
- encourage people to behave more safely on the roads
It is recognised that the effect of the above-mentioned initiatives will plateau unless all stakeholders, communities and individuals support the implementation of these measures.
Rates
In 2015, there were 26 road deaths per 100 000 population. This is about 4 times higher than the average for IRTAD countries. Nevertheless, there has been gradual improvement since 1990, when the rate was of 36.5 fatalities per 100 000 population.
The fatality risk expressed in terms of road deaths per 10 000 registered vehicles was at 12.6 in 2014 and 11.1 in 2015. This is about ten times higher than the average for IRTAD countries. The rate has nearly halved since 1990 mainly due to the strong increase in the vehicle fleet.
| 2014 % change over | |||||||||
|---|---|---|---|---|---|---|---|---|---|
| 1990 | 2000 | 2010 | 2013 | 2014 | 2013 | 2010 | 2000 | 1990 | |
| Reported safety data | |||||||||
| Fatalities | 11 157 | 8 494 | 13 967 | 11 844 | 12 702 | 7.2 | -9.1 | 4.5 | 13.8 |
| Fatal crashes | 9 174 | 6 679 | 10 837 | 10 170 | 10 367 | 1.9 | -4.3 | 55.2 | 13.0 |
| Deaths per 100 000 population | 36.7 | 19.6 | 27.9 | 22.3 | 23.5 | 5.3 | -15.7 | 20.1 | -35.9 |
| Deaths per 10 000 registered vehicles1 | 24.0 | 14.0 | 16.0 | 12.2 | 12.6 | 3.3 | -21.4 | -10.2 | -47.6 |
| Traffic data | |||||||||
| Registered vehicles (thousands) | 4 616 | 6 074 | 9 134 | 11 006 | 11 369 | 3.3 | 24.5 | 87.2 | 146.3 |
Table 36.1. Road safety and traffic data
1 2 http://dx.doi.org/10.1787/888933385666
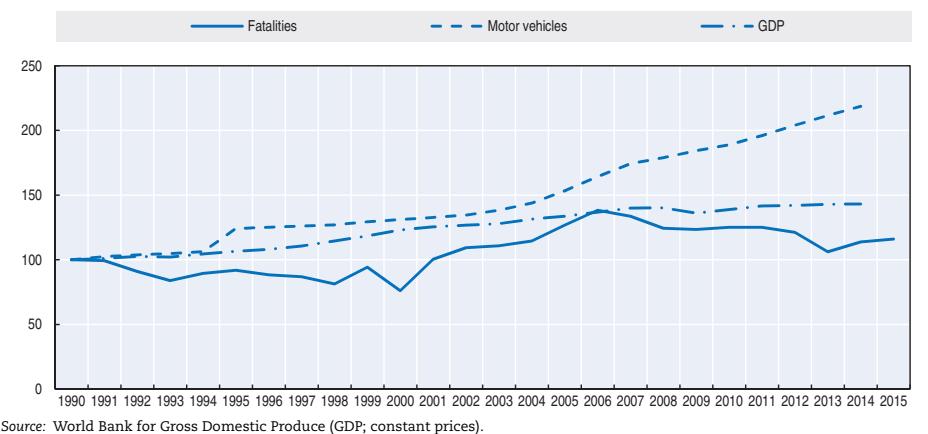
Figure 36.1. Road safety, traffic and GDP trends index 1990 = 100
Road safety by user group
Vulnerable road users account for approximately 40% of road crash fatalities. In 2014, pedestrians alone accounted for 35% of reported fatalities, with children particularly affected.
To enhance the safety of pedestrians and cyclists, the department is working towards the implementation by all provinces of the new Pedestrian Facility Guidelines and the new South African Road Safety and Speed Limits Manuals.
The government is also working very closely with the provinces to upgrade hazardous locations.
Road safety by age group
Children are very much affected by road crashes in South Africa and are particularly vulnerable as pedestrians. In 2013, 25% of pedestrians killed were children and young people under 15 years of age.
Economic costs of traffic crashes
South Africa is current conducting a study of the economic cost of crashes. Results will be published in September 2016.
Recent trends in road user behaviour
Speed
The table below summarises the main speed limits in South Africa.
Table 36.2. Passenger car speed limits by road type, 2016
| General speed limit | |
|---|---|
| Urban roads | 60 km/h |
| Rural roads | 100 km/h |
| Motorways | 120 km/h |
Drink driving
In South Africa, the maximum authorised blood alcohol content (BAC) is 0.5 g/l. There is a lower limit of 0.2 g/l for professional drivers of public transport and heavy goods vehicles.
A crash is defined as alcohol-related when one of the participants has a BAC above the legal limit.
Based on crash reports from 2015, 5.2% of fatalities involved a driver with a BAC above the legal limit, and 2.8% involved a pedestrian with a BAC above the legal limit.
Drugs and driving
Driving while under the influence of intoxicating liquor or drugs having a narcotic effect, or with an excessive amount of alcohol in the blood or breath is prohibited. Drug driving measures are not yet enforced.
Distraction
The National Road Traffic Act states that no person shall drive a vehicle on a public road holding a cellular or a mobile telephone or any other communication device in one or both hands or with any other part of the body.
Sleepiness and fatigue
The estimation of fatalities due to sleepiness and fatigue is still a challenge in South Africa.
Seat belts and helmets
All new motor vehicles must be fitted with seat belts for all passengers. Since 2005, seatbelt use is compulsory for the drivers and all the passengers of cars and minibuses registered after 1 January 2006.
The driver is responsible for ensuring that infants are seated with an appropriate child restraint.
The seat belt wearing rate is very low, estimated in 2010 at 4.5% for the drivers and 5% for front seat passengers.
The wearing of a protective helmet on a motorcycle, motor tricycle, a motor quadricycle, and passenger in the side-car attached to a motorcycle or pedal cycle is compulsory for both the driver and the passenger.
Helmets are compulsory for cyclists. In practice, it is not enforced.
| | 2010 | | | | | | |------------|------|--|--|--|--|--| | Front seat | | | | | | | | Driver | 4.5% | | | | | | | Passenger | 5% | | | | | |
Table 36.3. Seat belt wearing rate
National road safety strategies and targets
Organisation of road safety
The RTMC, established in April 2005, is the lead agency for Road Safety in South Africa. It reports to the Department of Transport. Other major road agencies that also have a responsibility to contribute towards road safety are:
- Road Accident Fund (RAF)
- Road Traffic Infringements Agency (RTIA)
- South African National Roads Agency (SOC; Limited) (SANRAL)
- Cross-Border Roads Transport Agency (CBRTA)
In addition, the Department of Health, the Department of Justice and Constitutional Development, the Department of Roads and Public Works, the Department of Safety and Security, the Provincial Traffic Authorities, Statistics South Africa, and the emergency medical services are important stakeholders.
The RTMC's shareholders are composed of provincial representatives from each of the nine provinces. The shareholder group also comprises a representative from the South African Local Government Authority (SALGA) with the Minister being the Chairperson.
The RTMC is responsible for:
- enhancing the overall quality of road traffic service provision, in particular to ensure safety, security, order, discipline and mobility on the roads
- protecting road infrastructure and the environment through the adoption of innovative practices and implementation of innovative technology
- introducing commercial management principles to inform and guide road traffic governance and decision making in the interests of enhanced service provision
optimising the utilisation of public funds
regulating, strengthening and monitoring intergovernmental contact and cooperation in road traffic matters
improving the exchange and dissemination of information on road traffic matters
stimulating research in road traffic matters and effectively using the resources of existing institutes and research bodies
developing human resources in the public and private sectors that are involved in road traffic.
The Road Safety Advisory Council was established in 2014, with the main objective to provide strategic advice to the Minister of Transport. It is composed of representatives of different sectors (automotive industry, road engineering, NGOs, transport companies, motor insurance companies, civil society organisations, etc.).
Road safety strategy for 2006-15 and 2016-30
The road safety strategy "Arrive Alive" covered the period 2006 to 2015. It aimed at reducing road fatalities by 50% by 2015 with further reductions by 2020. It was articulated around the following key areas:
- Enforcement heavy, visible, with follow up of fines and identification of repeat offenders.
- Education and communication emotive advertisements, showing consequences of unsafe behaviour.
- Engineering low-cost engineering at hazardous locations with a strong focus on pedestrian protection.
- Evaluation and research to ensure a data driven, scientifically based strategy.
- Cooperation and coordination between all stakeholders.
In 2015, the RTMC together with the Department of Transport and its other road agencies, began developing the National Road Safety Strategy 2016-30 which is aligned with the United Nations Decade of Action pillars. The objective is to reduce fatalities and injuries by 50% from the 2010 base by 2030. The formulation of the National Road Safety Strategy is scheduled for completion in 2016. It will focus on the following priority areas:
- road safety in schools
- drink driving
- safety of young people
A strategic plan for the period 2015-20 has been developed. The main measures are summarised in the table below.
Road safety targets
The main target of the 2006-15 strategy was to reduce by 50% the number of fatalities by 2015 from 2006 level.
The target of the 2016-30 strategy is to reduce the number of fatalities by 50% by 2030 from 2010 level.
Monitoring targets
The targets are constantly monitored by the Department of Transport – with contribution from its road agencies.
ROAD SAFETY ANNUAL REPORT 2016 © OECD/ITF 2016 463
Table 36.4. Measures and objectives of the 2015-20 strategic road safety plan
| Key measures of the 2015-20 Strategic Plan | Main objective |
|---|---|
| Development of the National Road Safety Strategy | Provide a uniform approach in achieving the UN goal to halve fatalities and injuries by 2020 |
| Implement measures targeting young people | Curb the impact of road fatalities on the youth. introduce best road user behaviour at a young age |
| Development of the national road traffic information database |
Establish and maintain road traffic information for all stakeholders under a single entity. Increase the accuracy, reliability and availability of information for all stakeholders |
| Publication of road safety status reports | Provide all stakeholders with an objective report on the road safety performance of the country. |
| Monitoring of drink driving and speeding offences | Monitor the impact of speeding and drink driving and identify measures to combat these behaviours. |
| Anti-fraud and corruption awareness programmes | Increase compliance with traffic rules |
| Investment in road safety research and development | Increase understanding of road safety challenges |
Figure 36.2. Trends in road fatalities towards national target
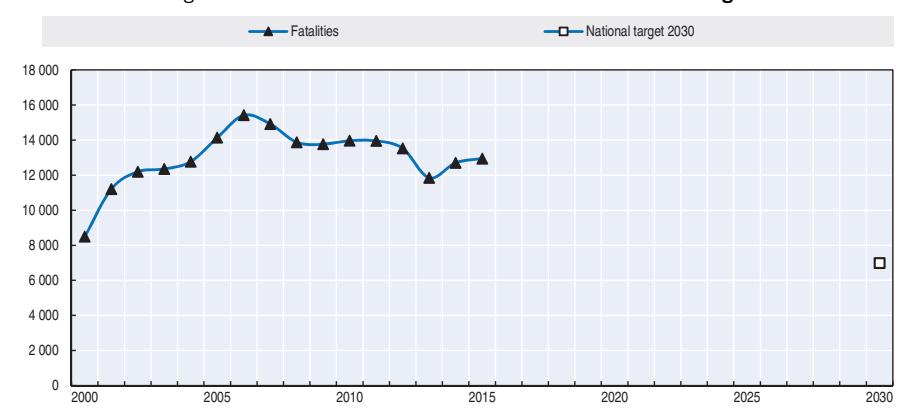
Recent safety measures (2013-16)
Road safety management
- Establishment of the National Road Safety Steering Committee.
- Appointment of Road Safety Ambassadors.
- Establishment of the Road Safety Advisory councils.
Road users
- Introduction and monitoring of safety performance indicators across the country which focus on drink driving, speeding as well as vehicle safety. These indicators are monitored monthly and reports are released quarterly.
- Intensive road safety adverts on national television channels and radios.
- In April 2015, the Minister of Transport approved the amendments to the Act and its Regulations which made it compulsory for children three years of age (or less) to be seated in a child seat when travelling in passenger cars.
Infrastructure
● The implementation of the South African Road Assessment Programme (SARAP) started with the introduction of the programme to the engineers at a provincial level.
Recent and ongoing research
- Distracted and Inattentive Driving Project
- A distracted and Inattentive research project (RTMC, 2016) was published in March 2016. As a pilot project, a small sample size was used providing conclusions and recommendations which form the hypothesis for a larger study.
- Indications are that the drivers did engage in secondary activities while driving. However, the frequency and the extent to which they engaged differed. Passenger-related distractions constituted the largest proportion of the total driving time. In other words, looking at, talking to or listening to a passenger was the activity that on average took the longest for all the drivers. Other secondary activities observed include using electronic devices, grooming, eating and person or object-related distractions. The important question to answer is what constitutes normal driving in South Africa and is it possible that distracted driving has become the norm rather than the exception.
- Costing of Crashes
- Phase 1 of the project entailed reviewing the methodology used in the previous Cost of Crashes in South Africa study which was published in 2004 (De Beer and Van Niekerk, 2004). Cornerstones of the framework included understanding what is available (inventory of data), understanding what the value of the available data is (valuation), how data is managed and applied as well as assigning accountability to entities responsible for the collection, management and use of the data. A key objective of the new methodology will be that it enables the user to consistently apply the crash costing methodology. The results should be of high integrity and quality.
- The Phase 2 results (application of the methodology) will be published in September 2016.
References
Websites
- Road Traffic Management Corporation: www.rtmc.co.za.
- Department of Transport: www.transport.gov.za/.
Chapter 37
Spain
This chapter presents 2014 road safety data for Spain along with provisional data from 2015. It looks at trends in traffic and road safety from the years 1990 to 2014 and road user behaviour patterns. This includes data on speed, drink driving, drugs and driving, distracted driving, and seat belt and helmet usage. The chapter reviews the Spain's road safety strategy and national targets to 2020 and the progress achieved thus far. It also looks at ongoing research and recently implemented safety measures.*
* All data stem from the Directorate General for Traffic (DGT) and IRTAD unless otherwise noted. For more information please contact: analisis.estadistica@dgt.es.
Spain, with a current rate of 3.6 per 100 000 inhabitants, has already achieved its 2020 road safety target of less than 37 fatalities per one million inhabitants. They are currently reviewing their road safety strategy to establish new goals and indicators for 2020. There were 1 688 road deaths in 2014, a 32% reduction from 2010, one of the highest reductions among IRTAD countries. Young people have in particular benefited from reductions in fatalities with a mortality rate similar to that of the general population. In 2015, new measures for speed management were implemented along with strengthened controls and preventative tests for drinking and drug use.
Road safety data collection
Definitions applied in Spain
- Road fatality: Person killed immediately or dying within 30 days as a result of a road crash.
- Seriously injured: Any injured person hospitalised for more than 24 hours as a result of a road crash.
- A MAIS 3+ injured person: Any person with a road crash injury for which the score on the Maximum Abbreviated Injury Scale is 3 or more.
- Slightly injured: Any injured person who was not hospitalised for more than 24 hours as a result of a road crash.
Data collection
In Spain, there are several sources of information for traffic injury data. The police collect detailed information and data on the circumstances of the crashes with a dedicated form. Traffic police officers monitor the condition of those injured for 24 hours after the crash to classify the person as dead, seriously injured or slightly injured.
From 1993 to 2010, the procedure to estimate the number of people killed within 30 days among those initially recorded as seriously injured was based on adjusting the number statistically, after monitoring during 30 days a representative sample of seriously injured people. From 2011, the number of fatalities has been determined by linking the register of crashes reported by the police and the national deaths register, which includes the total number of deaths registered throughout the national territory.
Information on road crashes from hospital discharges and health sources and information reported by the police reveal important differences in 2013:
- Figures from police records show that for each person killed there are 6 seriously injured and 69 slightly injured.
- Figures from health sources show that for each fatality there are 12 people hospitalised and 283 slightly injured.
Since 2011 Spain has reported the number of MAIS injured based on hospital data. The methodology is now being reviewed by the Directorate-General for Traffic (DGT), following the recommendation by the High Level Group on Road Safety representing EU Member States, in order to harmonise data across all European countries.
The procedure to obtain MAIS3+ consists of several steps:
- A number of selection criteria are applied to hospital discharge data to obtain the records of those injured due to road traffic crashes.
- International Classification of Diseases (ICD) codes, 9th revision, are converted into AIS codes using an algorithm provided by the European Commission.
- Finally, the MAIS score is calculated.
Most recent safety data
Road crashes in 2015 – provisional data
Based on provisional data, there were 1 688 road fatalities in 2015, exactly the same number as in 2014.
Road crashes in 2014
In 2014, there were 1 688 road fatalities, eight more than in 2013, representing a slight increase of 0.5%.
The number of injury crashes increased by 2.3%. This increase could be partly related to the improvement in crash reporting, especially in urban areas.
In 2014, the number of pedestrian fatalities decreased by 17% and the number of motorcycle and moped users declined respectively by 5% and 2%. The number of fatalities with light and heavy goods vehicles increased by 44%. There were six more cyclist fatalities and fifteen more bus users killed as compared to 2013. All age groups have seen a reduction in fatality rates except the age group 45-54, with an increase of 19%; the age group 55-64, with an increase of 7% and the age group 85+, with nine more fatalities than in the previous year.
Trends in traffic and road safety (1990-2014)
Traffic
Between 1990 and 2014, vehicle-kilometres increased by more than 75% on the Spanish State Road Network, which carries 50% of the national traffic volume outside urban areas.
Overall, between 2000 and 2014, traffic volume outside urban areas increased by 7%. However, while the traffic volume effectively increased (by 23%) between 2000 and 2007, it decreased by 14% between 2007 and 2013 due to the economic downturn. In 2014, there was a slight increase (less than 1%).
The vehicle fleet nearly doubled between 1990 and 2011. In 2012 and 2013, both the number of registered vehicles and vehicle fleet slightly decreased. In 2014, there was an increase in the total number of vehicles as compared to the previous year.
In 2014, the progressive ageing of the vehicle fleet in recent years continued. The median age of the fleet was 10.5 years.
Road safety
Crashes and casualties
Since 1990, the number of road fatalities has decreased by more than 80%. Road fatalities peaked in 1989 with 9 344 deaths; since then it has decreased steadily and in 2013 reached its lowest level. Since 2010, the number of fatalities has decreased by 32%; this is among the highest reductions among IRTAD countries.
In the past 15 years, improvements have been introduced in all elements of the road traffic system. Safety performance indicators related to drivers' behaviour show that the incidence of speeding, drink driving and not wearing seat belts has been significantly reduced. This is probably related to improvements in education and training, increased enforcement, the penalty point system and the reform of the Crime Code.
The length of motorways and dual carriageways has increased from 4 693 kilometres in 1990 to 15 048 kilometres in 2014. It is estimated that the fatality risk per unit exposure in these types of roads is about 25% of the corresponding value for rural roads. There have also been improvements in the system of traffic management, with the generalisation of traffic cameras, vehicle detectors and variable message signs. This has contributed not only to improvements in safety but also to reductions in congestion and travel times.
As for the vehicle fleet, important actions in the field of roadworthiness inspections and renewal schemes have been implemented. To collect exposure data, a new project on the development of national exposure indicators for each vehicle type (average and total kilometres driven), based on odometer readings from roadworthiness tests, has been implemented.
Rates
In 2014, the fatality rate for 100 000 inhabitants was at 3.6 and the fatality rate per 10 000 registered vehicles at 0.5. Since 1990, the risk of being killed on a Spanish road has been reduced by a factor of 7 to 11, depending on the indicator chosen.
There is no estimation of the total number of vehicle-kilometres on the entire network. It is therefore not possible to calculate the fatality risk expressed in terms of deaths per billion vehicle-kilometres.
Analysis of seriously injured data
In 2013, 20 143 people with road traffic injuries were discharged from Spanish private and public hospitals – including those people who died in hospital.
When considering the number of people injured with a Maximum Abbreviated Injury Score of 3 or more (MAIS3+) – which is the definition recommended by IRTAD and the European Commission to define a person seriously injured – in 2013 there were 6 613 people seriously injured.
By age, people over 85 have suffered from more serious injuries, 54% showed MAIS3+, followed by people aged 75-84 years, with 44%, and people aged 65-74 years, with 41%.
Road safety by user group
Since 1990, all user groups, but especially car occupants and moped riders, have benefited from improvements in road safety. The decrease of fatalities among moped riders is partly explained by the decrease in the number of sales (98% between 2000 and 2014).
Between 2003 and 2007, there was a very sharp increase (+72%) in the number of motorcyclists killed; this trend was broken in the following years, with reductions every year since. Between 2007 and 2014, the number of motorcyclists killed was reduced by more than 50%. This very encouraging result is probably the fruit of the specific Strategic Plan for the Road Safety of Motorcycles.
Table 37.1. Road safety and traffic data
| 2014 % change from | |||||||||
|---|---|---|---|---|---|---|---|---|---|
| 1990 | 2000 | 2010 | 2013 | 2014 | 2013 | 2010 | 2000 | 1990 | |
| Reported safety data | |||||||||
| Fatalities | 9 032 | 5 776 | 2 478 | 1 680 | 1 688 | 0.5 | -31.9 | -70.8 | -81.3 |
| Injury crashes | 101 507 | 101 729 | 85 503 | 89 519 | 91 570 | 2.3 | 7.1 | -10.0 | -9.8 |
| Injured persons hospitalised (police data) | 27 764 | 11 995 | 10 086 | 9 574 | -5.1 | -20.2 | -65.5 | ||
| Seriously injured person (MAIS3+) | 12 766 | 7 331 | 6 613 | ||||||
| Deaths per 100 000 inhabitants | 23.3 | 14.4 | 5.3 | 3.6 | 3.6 | 0.9 | -31.9 | -74.8 | -84.4 |
| Deaths per 10 000 registered vehicles | 5.1 | 2.2 | 0.7 | 0.5 | 0.5 | 0.4 | -31.2 | -77.3 | -90.0 |
| Traffic data | |||||||||
| Registered vehicles (thousands) | 17 615 | 25 715 | 33 375 | 33 024 | 33 037 | 0.0 | -1.0 | 28.5 | 87.6 |
| Registered vehicles per 1 000 inhabitants | 454 | 642 | 718 | 707 | 710 | 0.5 | -1.1 | 10.6 | 56.6 |
1 2 http://dx.doi.org/10.1787/888933385676
Figure 37.1. Road safety, traffic and GDP trends index 1990 = 100
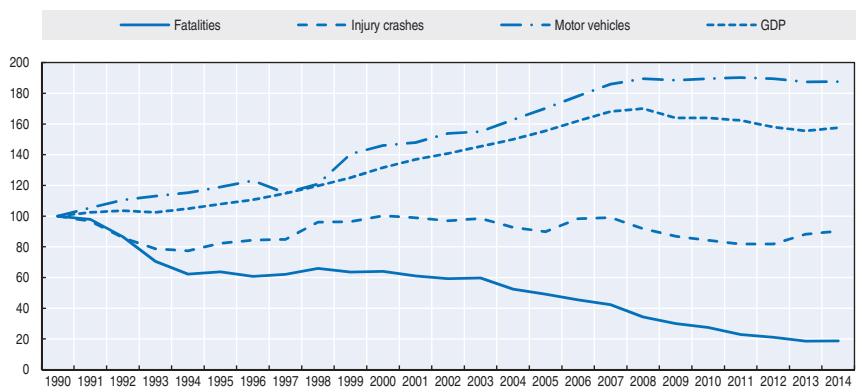
Source: World Bank for Gross Domestic Product (GDP; constant prices).
In recent years, there has been improvement for all road user groups, except cyclists. The increase of fatalities among cyclists is explained by a higher use of this transport mode. Since 2010 the number of cyclists killed increased by 12%.
Road safety by age group
Since 1990, the reduction in fatalities has benefited all age groups, with the highest reductions for children and young people. Since 2000, there have been reductions in all age groups. In particular, the mortality rate per population among those aged 15-24 decreased by more than 80%. The reduction was the lowest for the elderly.
In 2014, people aged over 65 accounted for 28% of fatalities. They are the age group the most at risk in traffic, with a fatality rate above the average. Older people are particularly vulnerable as pedestrians.
In terms of mortality rate per 100 000 inhabitants, progress has been most remarkable for young people aged 18-20, for which the rate has divided by four since 2007. They now have a fatality rate similar to that of the general population.
Figure 37.2. Number of hospital discharges, seriously injured and MAIS3+
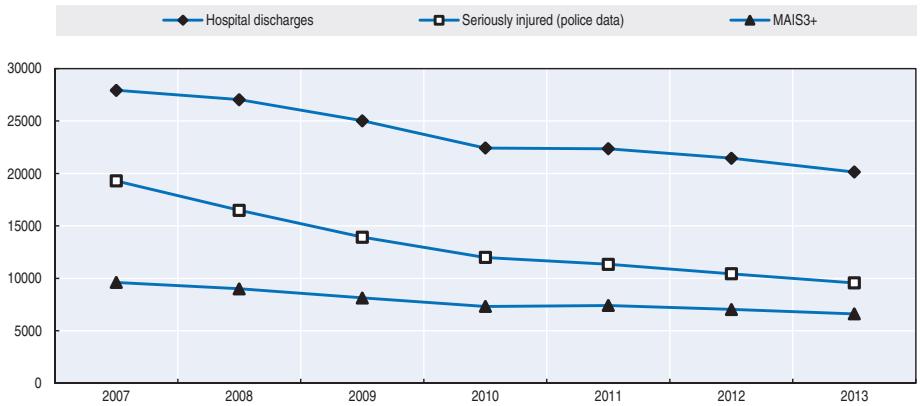
Table 37.2. Road fatalities by road user group
| 2014 % change from | |||||||||
|---|---|---|---|---|---|---|---|---|---|
| 1990 | 2000 | 2010 | 2013 | 2014 | 2013 | 2010 | 2000 | 1990 | |
| Cyclists | 160 | 84 | 67 | 69 | 75 | 8.7 | 11.9 | -10.7 | -53.1 |
| Moped users | 683 | 474 | 100 | 54 | 53 | -1.9 | -47.0 | -88.8 | -92.2 |
| Motorcyclists | 792 | 392 | 386 | 301 | 287 | -4.7 | -25.6 | -26.8 | -63.8 |
| Passenger car occupants | 5 034 | 3 289 | 1 197 | 715 | 722 | 1.0 | -39.7 | -78.0 | -85.7 |
| Pedestrians | 1 542 | 898 | 471 | 378 | 336 | -11.1 | -28.7 | -62.6 | -78.2 |
| Others | 823 | 639 | 257 | 163 | 215 | 31.9 | -16.3 | -66.4 | -73.9 |
| Total | 9 032 | 5 776 | 2 478 | 1 680 | 1 688 | 0.5 | -31.9 | -70.8 | -81.3 |
Figure 37.3. Road fatalities by road user group in percentage of total 2014
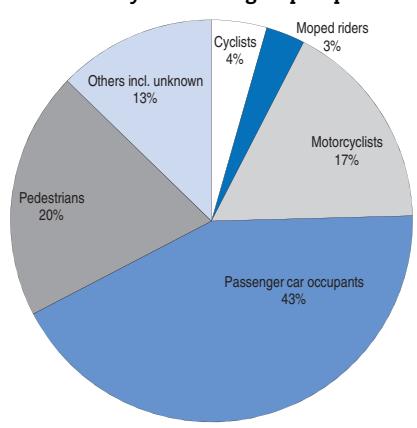
Table 37.3. Road fatalities by age group
| 2014 % change from | |||||||||
|---|---|---|---|---|---|---|---|---|---|
| Age | 1990 | 2000 | 2010 | 2013 | 2014 | 2013 | 2010 | 2000 | 1990 |
| 0-5 | 129 | 46 | 32 | 16 | 14 | -12.5 | -56.3 | -69.6 | -89.1 |
| 6-9 | 111 | 40 | 17 | 14 | 7 | -50.0 | -58.8 | -82.5 | -93.7 |
| 10-14 | 160 | 95 | 30 | 16 | 16 | 0 | -46.7 | -83.2 | -90.0 |
| 15-17 | 417 | 223 | 50 | 19 | 24 | 26.3 | -52.0 | -89.2 | -94.2 |
| 18-20 | 902 | 422 | 139 | 48 | 46 | -4.2 | -66.9 | -89.1 | -94.9 |
| 21-24 | 1 266 | 661 | 174 | 96 | 84 | -12.5 | -51.7 | -87.3 | -93.4 |
| 25-64 | 4 759 | 3 267 | 1 489 | 972 | 1 002 | 3.1 | -32.7 | -69.3 | -78.9 |
| 65 | 1 134 | 843 | 529 | 482 | 477 | -1.0 | -9.8 | -43.4 | -57.9 |
| Total | 9 032 | 5 776 | 2 478 | 1 680 | 1 688 | 0.5 | -31.9 | -70.8 | -81.3 |
Figure 37.4. Road fatality rates by age group Deaths per 100 000 inhabitants in a given age group, 1990-2014
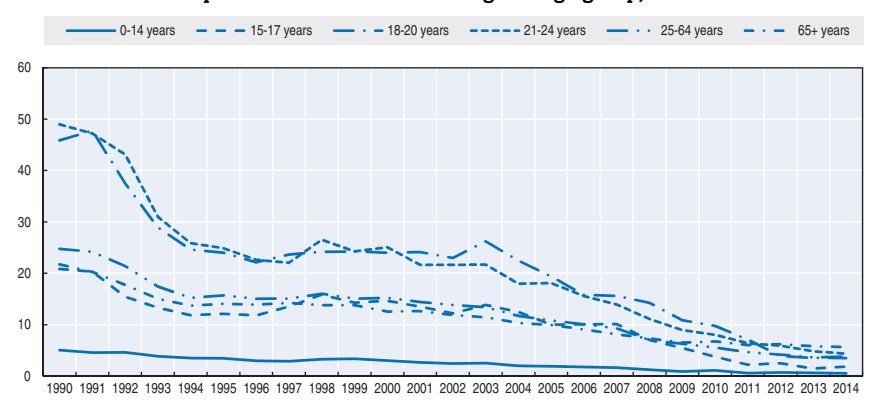
Figure 37.5. Road fatality rate by age and road user group Fatalities per 100 000 inhabitants, 2014
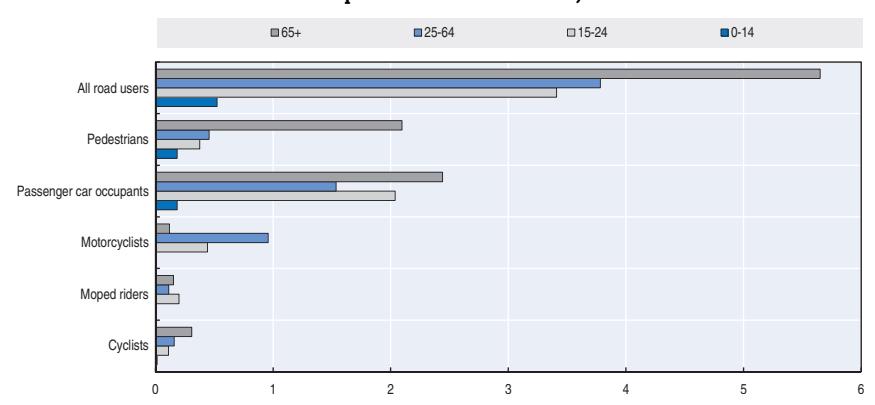
Road safety by road type
In 2014, 70% of fatalities occurred on roads outside urban areas. Approximately 30% of fatal crashes are run-off road crashes, typically on rural roads. Since 2000, while the whole road network benefited from significant improvements, the smallest progress was achieved on urban roads.
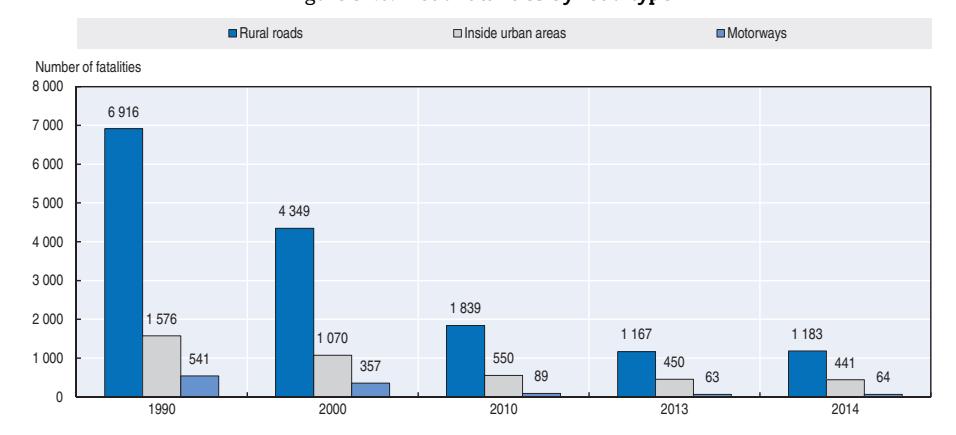
Figure 37.6. Road fatalities by road type
Economic costs of traffic crashes
Traffic crashes represent a significant cost for society, estimated at around EUR 5.2 billion (i.e. 0.5% of GDP according to police-reported data. However, when the health system data is included, economic costs rise to EUR 9.7 billion (i.e. 1% of GDP). Estimates do not include property damage and administrative costs.
Costs are based on the calculation of a monetary value of statistical life, based on a willingness-to-pay approach (DGT, 2011). A value of preventing life of EUR 1.41 million is used to compute the social costs of fatal road crashes in Spain (Abellan et al., 2011). Likewise, it is used to assess the benefits of road safety measures in terms of saved lives, making possible the economic evaluation of Spanish transport policies.
| Unit cost | Total based on police reported data |
Total when health data are included |
|
|---|---|---|---|
| Fatalities | EUR 1.41 million | EUR 2.38 billion | EUR 2.38 billion |
| Hospitalised persons | EUR 220 329 | EUR 2.11 billion | EUR 4.38 billion |
| Slight injuries | EUR 6 137 | EUR 0.72 billion | EUR 2.93 billion |
| Property damage and administrative costs | not included | not included | |
| Total | 5.18 billion | 9.69 billion | |
| Total as % of GDP | 0.50% | 0.92% |
Table 37.4. Costs of road crashes, 2014
Recent trends in road user behaviour
Speed
In 2014, inappropriate speed was reported as a contributing factor in 10% of injury crashes and 21% of fatal crashes.
In 2014, 31.5 million vehicles were checked for speed, and 4% were driving above the limit (this proportion was 6.5% in 2013 and 3.5% in 2012). Since 2003, the number of speed checks has doubled while the percentage of vehicles sanctioned has hardly increased, thus suggesting that speed limits are much better respected.
The table below summarises the main speed limits in Spain.
Table 37.5. Passenger car speed limits by road type, 2016
| General speed limit | Comments | |
|---|---|---|
| Urban roads | 50 km/h | |
| Rural roads | 90/100 km/h | 90 km/h (roads with no hard shoulder or with one of less than 1.5 m. width) 100 km/h (roads with hard shoulder, at least 1.5 m. wide or with two lanes or more in each direction) |
| Motorways | 120 km/h |
Drink driving
In Spain, the blood alcohol content (BAC) limit is 0.5 g/l for general drivers and 0.3 g/l for novice and professional drivers.
Between 2001 and 2014 random preventive alcohol tests have been tripled and the positive tests have been reduced by almost a third. In 2001, the Traffic Division of the Civil Guard carried out 1.6 million preventive tests, and 5% tested positive. In 2014, 5.5 million preventive tests were carried out and 1.6% tested positive.
Driving after having consumed psychoactive substances is a frequent behaviour in Spain with 12% of Spanish car drivers admitting having taken an illegal drug and/or alcohol before driving. According to the report by the Spanish National Toxicology and Forensic Sciences Institute, psychoactive substances were found in 39% of the killed drivers who were tested. Of these, alcohol was present in 67% of the cases, illegal drugs in 34% and psychotropic drugs in 28%. For pedestrians killed and tested, 40% tested positive for illegal drugs, psychotropic drugs and/or alcohol.
Drugs and driving
The Guardia Civil carried out 29 643 oral fluid drug tests in 2014, compared to 4 563 in 2013; and in 2015, nearly 70 000 preventive tests were carried out. The proportion of positive tests (presence of drugs) fell from 49% in 2013 to 35 % in 2014.
According to the National Institute of Toxicology, in 2014 the percentage of drivers killed who tested positive for the presence of drugs other than alcohol was about 13%.
Distraction
Distraction is a concurrent factor in 30% of injury crashes. It is a more prevalent issue outside urban areas (36% of injury crashes) than inside urban areas (26% of injury crashes). Factors that may affect attention are the use of mobile telephones, radios, DVDs, witnessing a previous crash, looking at the environment, absent-mindedness, and sudden illness or indisposition.
One of the main reasons for distraction is the use of the mobile phone while driving. In 2014, the Traffic Division of the Guardia Civil issued 135 852 tickets for the use of the mobile telephone while driving, which represented an increase of 8% as compared to 2013.
Since 2002, the use of hand-held mobile phones while driving is forbidden. Only handsfree phones are permitted. As of 1 July 2006, driving while using hand-held mobile phones, GPS or other communication devices entails the loss of three points from the driving licence.
According to the data collected through observational studies conducted by the DGT, around 3% of drivers use their mobile phone while driving.
Sleepiness and fatigue
There is no estimate of crashes due to fatigue.
Seat belts and helmets
Seat belt use has been compulsory in front seats outside urban areas since 1974 and in front seats inside urban areas and rear seats since 1992.
Children with a height less than 135 cm must be seated on rear seats and use a dedicated child restraint system (CRS). In 2014, two of the 14 children killed in road traffic were not using a CRS or seat belt.
In 2014, 23% of car occupants killed outside urban areas were not wearing a seat belt.
| % | |||
|---|---|---|---|
| 2005 | 2010 | 2012 | |
| Front seat | |||
| General (driver + passengers) | 74 | 88 | 90 |
| Urban roads (driver) | 69 | 83 | 86 |
| Rural roads (driver) | 81 | 94 | 95 |
| Rear seats | |||
| General | 51 | 76 | 81 |
| Children (use of child restraint) | No information |
Table 37.6. Seat belt wearing rate by car occupancy and road type
Helmet use is compulsory for riders of all powered two-wheelers. The helmet wearing rate is nearly 100%. Nevertheless, in 2014, 3% of motorcycle users killed outside urban areas were not wearing a helmet, and in urban areas 10% did not use a helmet. As for moped riders, among the 34 fatalities outside urban areas, eight were not wearing a helmet. All moped riders killed on urban roads were wearing a helmet.
National road safety strategies and targets
Organisation of road safety
The agency that centralises most aspects of road safety is the Directorate-General for Traffic, which belongs to the Ministry of the Interior. The core responsibilities of the DGT are at a national level on all interurban roads, except for the Basque Country, Catalonia and part of Navarre. Key missions of the DGT include:
- Issuing and renewing driving licences and vehicle authorisations, regulating and licensing private driving training schools, and supervising the Roadworthiness Inspection System.
Registering vehicles, drivers and traffic offences.
Controlling traffic and enforcing traffic law on all interurban roads.
Managing the Traffic Division of the Civil Guard (the police body in charge of traffic control and traffic law enforcement), with around 10 000 officers.
Centralising road traffic statistics and co-ordinating crash investigations.
Developing road safety strategies, plans and policies, in coordination with other relevant ministries or public bodies.
Supervising driving information and road safety education campaigns.
Road safety strategy for 2011-20
The Spanish Road Safety Plan 2011-20 was adopted by the Council of Ministers on 25 February 2011.
Road safety targets
The main objective of the Spanish Road Safety Strategy is to reduce by 2020 the rate of road fatalities to below 37 per million inhabitants. This target is aligned with the European objective of halving the number of people killed by 2020. The goal will be revised in 2016 as Spain has already reached its target, with a 2014 fatality rate of 36 deaths per million inhabitants.
The process of drawing up the strategy was based on the analysis of data and information contained in official, valid and sustainable sources of information and the participation of the various public and private agents through working groups and international comparison. Other strategies have been analysed to assess their contributions, including the Infrastructure and Transport Strategic Plan (2005-20), the Strategic Action Plan for the Transport of Goods and Passengers, the 2008-2012 Action Plan for Spain's Energy Saving and Efficiency Strategy, Spain's Sustainable Mobility Strategy, and Spain's Health and Safety at Work Strategy (2007-12).
A mid-term review of the strategy is planned in 2016, which will include an evaluation of measures taken in the first half of the decade and a proposal for a revised target.
Monitoring targets
Spain has adopted a number of safety performance indicators, which are closely monitored.
Recent safety measures (2013-16)
Road safety management
- The licensing system is being reviewed regarding both theoretical and practical tests with more focus on safe and responsible driving.
- DGT is improving its crash data information systems with the progressive inclusion of new parameters, such as risk exposure, descriptive analysis and time trends. In addition, Spain is one of the pioneer countries in the collection and analysis of MAIS3+ data as recommended by the IRTAD Group and the European Commission.
- In 2014, the following changes to the Law on Road Safety were approved:
- ❖ zero tolerance for alcohol, drugs and medicines at non-therapeutic doses
- ❖ immobilisation of the vehicle if a child restraint system appropriate for the minor passenger is not used
Table 37.7. Targets and performance indicators of the 2011-20 road safety plan
| Indicators | Reference figures in 2009 | Figures in 2014 | Target figures 2020 |
|---|---|---|---|
| Reach a fatality rate of 37 deaths per million inhabitants |
59 | 36 | < 37 |
| Reduce by 35% the number of serious injuries | 13 923 | 9 574 | 9 050 |
| No child (< 12) killed without a child restraint system |
12 | 2 | 0 |
| 25% fewer drivers between the ages of 18 and 24 killed or seriously injured at weekends |
730 | 360 | 548 |
| 10% fewer drivers killed above the age of 64 | 203 | 213 | 183 |
| 30% fewer deaths due to being run over | 459 | 310 | 321 |
| 1 million more cyclists without their death rate going up |
1.2 cyclists killed/100 000 population | 1.6 cyclists killed/ 100 000 population |
1.2 cyclists killed/100 000 population |
| Zero deaths in cars in urban areas | 101 | 71 | 0 |
| 20% fewer deaths and serious injuries amongst motorcyclists |
3 473 | 2 870 | 2 778 |
| 30% fewer deaths due to having come off a single carriageway |
520 | 277 | 364 |
| Less than 1% positive tests for alcohol in random preventive tests |
6.7% | 1.6% | < 1% |
| 50% reduction in the percentage of light vehicles which exceed the speed limit by more than 20km/h |
12.3% (motorways) 6.9% (dual carriageways) 15.8% (single carriageway limit 90km/h) 16.4% (single carriageway limit 100 km/h) |
n.a. | 6.2% (motorways) 3.5% (dual carriageways) 7.9% (single carriageway limit 90km/h) 8.2% (single carriageway limit 100 km/h) |
Figure 37.7. Trends in road fatalities towards national target
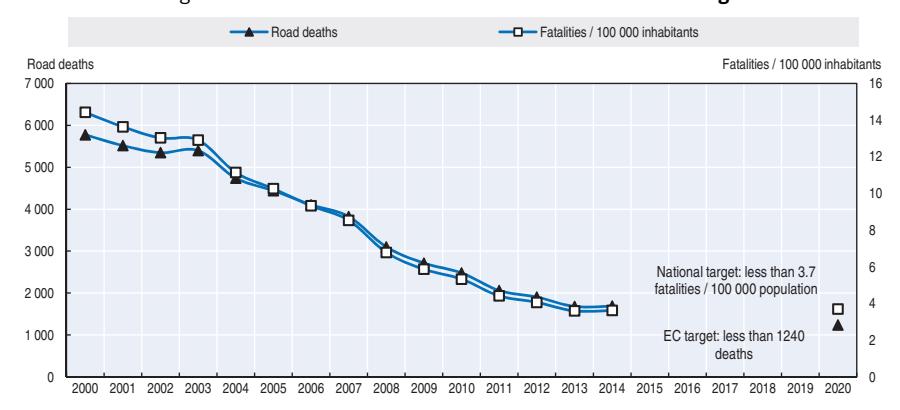
- ❖ prohibition of the use of radar detectors
- ❖ implementation of the State Traffic Fatalities Register to expedite accident rate reports
- ❖ introduction of procedures to facilitate cross-border exchange of information on road safety related traffic offences, following EU Directive 2011/82.
- In 2014, a new code was passed regulating the communication of road crash data to the National Register of Victims of Road Crashes. It entered into force on 1 January 2015. This new rule was accompanied by the establishment of a new crash form to be used by traffic police officers at the scene of the crash.
Road users
Education and training
- Over 20 000 information letters were sent to school headmasters with details on road safety actions; a guide listing the location of school transport stops and safe school routes was developed (2013).
- Channels of communication with citizens were expanded using social networks, a mobile application and the renewal of the DGT web page (2013).
- Applicants for a driving licence were better trained through new theoretical and practical driving tests (2013).
- Week-long campaigns conducted in 2015 with the Traffic Division of the Civil Guard on interurban roads and local police forces in built-up areas included trucks and vans, school transport, speed, motorcycles and bicycles, use of mobile phones while driving, alcohol and drugs, helmets, seat belts and child restraint systems, rural roads, vehicle conditions and roadworthiness tests.
- Letters sent to traffic offenders to inform them about their penalties are accompanied by information about the risks associated with the traffic violations they committed.
- DGT emphasised education for children, driving licence applicants and traffic offenders and is investigating campaigns for groups such as business professionals, healthcare personnel, and those who work with minors at risk (2014).
- Development of a free mobile app to protect drivers, cyclists and pedestrians. The app warns the driver through voice messages of the presence of vulnerable road users (cyclists and pedestrians) and traffic events such as works or crashes. The app works on interurban roads throughout the country.
Monitoring and mobility
- In 2015, new measures for speed management were implemented. The operational margin of speed cameras was set at 7 km/h for speed limits up to 100 km/h, and 7% for higher speed limits. In addition, road sections with intensified enforcement through mobile speed cameras are now published on the website of the Directorate General for Traffic. Sections are selected on the basis of their actual speeds and crash records.
- There are strengthened controls for drink driving on rural roads.
- On high risk rural road sections, heavy goods vehicle traffic is diverted from conventional roads to high capacity roads.
- In 2013, the Pegasus radar system was installed in a helicopter owned by the DGT, in order to monitor traffic on secondary roads. Four additional helicopters in 2014, and two in 2015, have been equipped with the Pegasus system.
- Comprehensive checks are undertaken on rural roads to detect multiple offenders, i.e. drivers that commit more than one traffic violation at the same time.
- Strengthened checks for drug driving. In 2015, almost 70 000 preventive tests were carried out, as compared to about 30 000 in 2014. Furthermore, the Directorate General for Traffic has provided 450 local police forces with 10 000 drug test kits and training.
- An agreement was signed in 2015 with the "Cities that walk" network, in order to coordinate and conduct activities to promote safe pedestrian mobility.
Infrastructure
● DGT will implement measures to improve safety and accessibility for persons with disabilities.
Vehicles
- Programmes to promote vehicle safety measures included, among other measures, sending information letters to owners of vehicles of more than seven years old (2013-14).
- The content in the vehicle registry was expanded in 2014 to include more technical data and information relating to technological safety elements, interventions carried out at garages; changes to the vehicle and kilometres driven, the rescue sheet, active safety elements and the rating stars awarded at the European New Car Assessment Programme (EuroNCAP).
Post crash measures
● Implementation of the Road Traffic Accident Victims Unit in 2013 to support traffic casualties and their relatives and inform them about available private and public services.
Recent and ongoing research
Important research conducted in 2014-15 included the following:
- Alvarez, F.J., J.C. Gonzalez-Luque and M. Seguí (2015), "Drugs Substance Use Disorder and Driving: Intervention of Health Professionals in Treatment of addictions", Adicciones 2015 15; 27(3):161-7: http://uvadoc.uva.es/bitstream/10324/15243/1/PD-288.pdf (accessed 30 April 2016).
- Alvarez, F.J. et al. (2015), "Alcohol, drogas y medicamentos en conductores de vehículos de España", Informe Técnico DGT, www.dgt.es/Galerias/seguridad-vial/investigacion/estudios-e-informes/2015/ 20150600.-Informe-2013-drogas-alcohol-y-medicamentos.pdf (accessed 30 April 2016).
- Castillo-Manzano, J.I., M. Castro-Nuño and X Fageda (2015), "Can cars and trucks coexist peacefully on highways? Analyzing the effectiveness of road safety policies in Europe", Accident Analysis and Prevention 77 (2015) 120-126: http://dx.doi.org/10.1016/j.aap.2015.01.010.
- Ferrer, A. (2014), "Desarrollo de una guía metodológica de buenas prácticas para la valoración del 'mal uso' cualitativo de los sistemas de retención infantil", Informe técnico, Dirección General de Tráfico, www.dgt.es/Galerias/seguridad-vial/investigacion/estudios-e-informes/2014/o-8859- 1\_Q\_buenas\_prE1cticas\_para\_la\_valoraciF3n\_del\_mal\_uso\_cualit\_-ativo-de-los-SRI\_INFORME-PARA-WEB.pdf (accessed 30 April 2016).
- Pons Patentes y Marcas (2014), "Elaboración de un estudio sobre los dispositivos que existan en la actualidad y se estén utilizando para la monitorización del comportamiento de los conductores durante el ejercicio de la conducción, las variables registradas, exactitud y fiabilidad de las mismas", Informe Técnico, Dirección General de Tráfico, www.dgt.es/Galerias/seguridad-vial/ investigacion/estudios-e-informes/2014/0100dgt22957\_Estudio-monitorizacion-comportamientovial_INFORME-PARA-WEB.pdf (accessed 30 April 2016).
References
- Abellan et al. (2011), "El valor monetario de una vida estadística en España Estimación en el contexto de los accidentes de tráfico", DGT, Spain.
- DGT (2015), "Main figures in road safety data, Spain 2014", www.dgt.es/Galerias/seguridad-vial/ estadisticas-e-indicadores/publicaciones/principales-cifras-siniestralidad/2015-2228\_principales\_cifras\_de\_ la_Siniestralidad_Vial_2014_ACCESIBLE.pdf.
Websites
● General Traffic Directorate: www.dgt.es.
Chapter 38
Sweden
This chapter presents detailed 2014 and 2015 road safety data for Sweden. It looks at trends in traffic and road safety from the years 1990 to 2015 and road user behaviour patterns. This includes data on speed, drink driving, drugs and driving, distracted driving, fatigue, and seat belt and helmet use. The chapter reviews Sweden's road safety strategy and national targets to 2020 and the performance indicators put into place to help with monitoring. It also highlights the most recently implemented safety measures.*
* All data stem from the Swedish Transport Administration, Swedish Transport Agency and IRTAD unless otherwise noted. For more information please contact: hans-yngve.berg@transportstyrelsen.se; anna.vadeby@vti.se.
Sweden's positive trend in road safety continues, although the rate of reduction in fatalities is now starting to level off. A 4% decrease in fatalities was recorded in 2015 over 2014 figures, a total of 259 deaths, similar to 2013 levels. This makes Sweden one of the world's safest countries on the roads, maintaining a rate of 2.7 fatalities per 100 000 inhabitants. With vehicle occupants seeing the most reductions in recent years, Sweden's focus is now on improving safety for vulnerable road users and motorcyclists. The motorcycle fleet has doubled since 1996 resulting in a slower improvement for this group of users. Sweden is currently on track to reach its 2020 target of a maximum of 220 fatalities on the roads.
Road safety data collection
Definitions applied in Sweden
- Road fatality: Person killed in a traffic crash or within 30 days of the crash. Suicides have been excluded from official statistics since 2010.
- Slightly injured person: Persons slightly injured in road traffic crashes reported by the police.
- Serious injury: Two definitions are used. Road traffic accidents with fatal and severe personal injury reported by the police are still used as official statistics. Another definition is used in the preventive road safety work. This definition is based on health loss following a traffic injury in which the previous health condition is not recovered within a reasonable amount of time. A person with any percentage of medical impairment, who has not recovered their previous physical health condition, is defined as seriously injured.
Medical impairment is a concept for evaluating various functional impairments, regardless of the reason. The disability scale is based on the level of functional impairment: For example, total paralysis is regarded as 100% impairment, the loss of one hand as 50-65%, and the loss of the outer joint of the ring finger as 2%. A person with any percentage of medical disability who has not recovered their previous physical health condition is therefore defined as seriously injured. Today, the medical impairment cut-off is 1% but discussions are ongoing on adding a complementary category of 10% or higher.
Sweden is therefore not using the score of three or more on the Maximum Abbreviated Injury Scale (MAIS3+) as a formal measure of a seriously injured person. MAIS3+ is, however, used to calculate the number of persons seriously injured and is therefore an important part of the Swedish efforts to increase the level of road safety.
Data collection
Sweden's safety data system integrates police and health data. This system, called STRADA, is composed of two parts:
- STRADA police: Based on crash reports by the police, which include detailed information on crashes.
- STRADA hospital: Based on medical information.
The system is based on a systematic link between police and health data and allows accurate information on the severity and consequences of crashes to be obtained.
STRADA, however, only provides information on seriously injured people and acquires medical information about injured persons visiting an emergency hospital following the crash. The number of people less seriously injured is likely to be underreported. As an example, people suffering from a minor injury requiring only primary care, without being further directed to an emergency hospital, are not recorded in STRADA. However, slightly injured persons known by the police are reported into STRADA.
Most recent safety data
Road crashes in 2015 – final data
In 2015, 259 persons were killed in road crashes, 11 less than in 2014 representing a 4% decrease. The steep reduction in the number of fatalities among protected road users – drivers and passengers of cars, buses and trucks – has levelled out for the first time since 2003. Unprotected road users such as pedestrians, cyclists and motorcyclists have seen gradual and slow positive developments. Compared to 2014, the number of killed cyclists, pedestrians and mopeds decreased. Despite the levelling off of the reductions among protected road users, the safety issues in Sweden appear to be switching from protected road users outside cities to vulnerable road users within urban areas. Close focus on developments regarding protected road users is still needed and efforts to continuing reducing the number of fatalities in this group are important.
Road crashes in 2014
In 2014, 270 persons were killed in road crashes, 10 more than in 2013 representing a 4% increase. The number of persons seriously injured increased by 2%, from 4 800 to 4 900. The number of fatalities among protected road users continues to decline. However, vulnerable road users have not experienced the same positive development, in particular cyclists, who experienced an increase in the number of fatalities. This development is also seen among injured road users. Therefore, safety issues in Sweden are shifting from protected road users outside cities to vulnerable road users within urban areas
Trends in traffic and road safety (1990-2015)
Traffic
Between 1990 and 2014, the number of motorised vehicles increased by 32% and the overall vehicle kilometres driven by 23%. Passenger cars account for about 81% of traffic volumes (vehicle kilometres) on Swedish roads. Buses and motorcycles account for just over 1% each, light trucks for 11% and heavy trucks for 6%. Light trucks are the type of vehicle showing the most rapid increase, both in terms of numbers of vehicles and traffic volume.
In 2014, the total traffic volume increased by 1.9% compared to 2013. It increased by 2% for passenger cars and light trucks and by 2.3 %, for the heaviest trucks (> 26 ton). Traffic volume decreased by 4.7% for trucks between 3.5 and 26 tonnes, and by 1.9% for trucks below 3.5 tonnes. Motorcycle traffic volume decreased by 3.7% compared to 2013.
Road safety
Crashes and casualties
The number of road fatalities reached a peak in 1965 and 1966 with 1 313 road deaths, and since then road deaths have decreased by almost 80%.
Between 1990 and 2015, the number of road fatalities decreased by 66%, while the number of injury crashes between 1990 and 2014 was reduced by only 22%. This variation is explained by a much better reporting of injury crashes in recent years and by a strong focus on reducing the most severe crashes.
The overall positive trend can partly be explained by gradual improvements in infrastructure, vehicle fleet, an increased focus on injury prevention and reduced speeds. Both the safe national road indicators and safe vehicle indicators are improving, and road design has long embraced greater safety.
Sweden has experienced a substantial drop in injured occupants of passenger cars since 2003. For the seriously injured the drop is so radical that since 2011 more cyclists than car occupants have been seriously injured. This is mainly due to safer cars, lower speeds and the introduction of median barriers.
Road safety trends in recent years have more or less stagnated for unprotected road users since 2013 but also for protected road users in 2015.
Rates
Since 1990, the death rate per 100 000 inhabitants has decreased by almost 70%, while the number of vehicles per 1 000 inhabitants has increased by more than 17%. The rate reached a record low of 2.7 in 2013, slightly increased to 2.8 in 2014, then dropped to 2.7 once again in 2015.
Analysis of seriously injured data
In 2014, approximately 1 200 persons suffered MAIS3+ injuries in Sweden: 37% were cyclists and 27% were in passenger cars. Since 2007 the number of persons suffering MAIS3+ injuries has decreased by 17%, but this differs for different road users. While the number of injured persons in passenger cars has decreased by 37%, the number of injured cyclists is slightly higher than in 2007.
| 2014 % change from | |||||||||
|---|---|---|---|---|---|---|---|---|---|
| 1990 | 2000 | 2010 | 2013 | 2014 | 2013 | 2010 | 2000 | 1990 | |
| Reported safety data | |||||||||
| Fatalities | 772 | 591 | 266 | 260 | 270 | 3.8 | 1.5 | -54.3 | -65.0 |
| Injury crashes | 16 975 | 15 770 | 16 255 | 14 940 | 12 926 | -13.5 | -20.5 | -18.0 | -23.9 |
| Injured persons with MAIS3+ | 1 217 | 1 091 | 1 192 | ||||||
| Deaths per 100 000 inhabitants | 9.1 | 6.7 | 2.8 | 2.7 | 2.8 | 2.9 | -1.7 | -58.0 | -69.1 |
| Deaths per 10 000 registered vehicles | 1.7 | 1.2 | 0.5 | 0.4 | 0.5 | 1.9 | -3.1 | -62.7 | -73.7 |
| Deaths per billion vehicle kilometres | 12.0 | 8.5 | 3.5 | 3.3 | 3.4 | 1.9 | -1.7 | -60.1 | -71.6 |
| Traffic data | |||||||||
| Registered vehicles (thousands) | 4 461 | 4 842 | 5 654 | 5 813 | 5 923 | 1.9 | 4.8 | 22.3 | 32.8 |
| Vehicle kilometres (millions) | 64 310 | 69 267 | 76 731 | 77 765 | 79 227 | 1.9 | 3.3 | 14.4 | 23.2 |
| Registered vehicles per 1 000 inhabitants | 523 | 546 | 605 | 608 | 614 | 1.0 | 1.5 | 12.4 | 17.4 |
Table 38.1. Road safety and traffic data
1 2 http://dx.doi.org/10.1787/888933385686
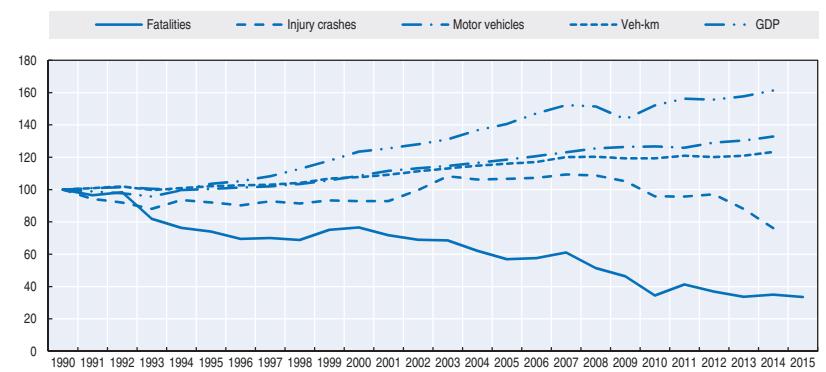
Figure 38.1. Road safety, traffic and GDP trends index 1990 = 100
Source: World Bank for Gross Domestic Products (GDP; constant prices).
Road safety by user group
Since 1990, all user groups have benefited from the improvements in safety. However, the reduction in fatalities was much smaller for motorcyclists than for other road users.
This relative lack of progress is partly explained by the doubling of the motorcycle fleet between 1996 and 2013. To respond to this trend, in April 2010 the Swedish Transport Administration presented a new national strategy on motorcycle and moped safety. The main result is to focus on Anti-lock Braking Systems (ABS), increased speed compliance by motorcyclists and proper helmet use for moped riders. In 2013, 40 motorcyclists died in road traffic crashes, a 29% increase compared to 2012. However, in 2014 the number of killed motorcyclists decreased to 31 but increased again to 44 in 2015.
The decrease in the number of deaths in 2015 concerned primarily pedestrians, cyclists and, to some extent, moped riders. The number of fatalities increased for other categories of road users.
Seventeen cyclists were killed in 2015, 16 less than in 2014. However, the number of cyclist fatalities was unusually high in 2014. For moped riders and pedestrians, the number of fatalities decreased respectively, from 8 to 5 and 52 to 28.
Pedestrian safety deteriorated with an increase of pedestrian fatalities of 68% between 2010 and 2014 but in 2015 it returned to normal figures again.
| 2014 | 2014 % change from | ||||||||
|---|---|---|---|---|---|---|---|---|---|
| 1990 | 2000 | 2010 | 2013 | 2013 | 2010 | 2000 | 1990 | ||
| Cyclists | 68 | 47 | 21 | 14 | 33 | 135.7 | 57.1 | -29.8 | -51.5 |
| Moped users | 22 | 10 | 8 | 3 | 8 | 166.7 | 0.0 | -20.0 | -63.6 |
| Motorcyclists | 46 | 39 | 37 | 40 | 31 | -22.5 | -16.2 | -20.5 | -32.6 |
| Passenger car occupants | 468 | 393 | 151 | 144 | 122 | -15.3 | -19.2 | -69.0 | -73.9 |
| Pedestrians | 134 | 73 | 31 | 42 | 52 | 23.8 | 67.7 | -28.8 | -61.2 |
| Others | 34 | 29 | 18 | 17 | 24 | 41.2 | 33.3 | -17.2 | -29.4 |
| Total | 772 | 591 | 266 | 260 | 270 | 3.8 | 1.5 | -54.3 | -65.0 |
Table 38.2. Road fatalities by road user group
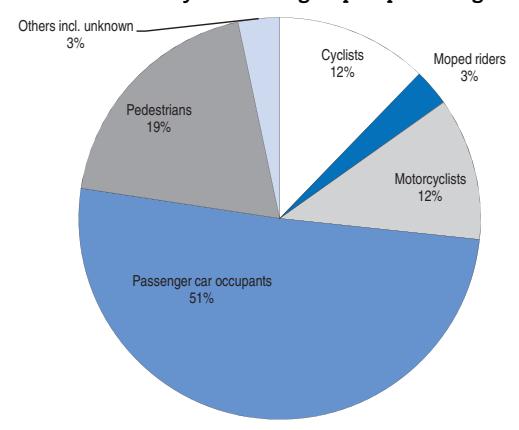
Figure 38.2. Road fatalities by road user group in percentage of total 2014
Road safety by age group
Since 1990, the reduction in fatalities has benefited all age groups, but the highest reduction concerns the younger age groups. Child fatalities (0-14) have been halved since 2000, partly due to the legislation on child-restraint systems, but also to efforts to separate traffic modes in urban areas.
Since 2010, there has been an increase by 45% in the number of older people (65+) killed in traffic. Sweden has an ageing population which is still very active in the road transport system. Therefore there are more vulnerable persons exposed to injury risk.
| 2014 % change from | |||||||||
|---|---|---|---|---|---|---|---|---|---|
| Age | 1990 | 2000 | 2010 | 2013 | 2014 | 2013 | 2010 | 2000 | 1990 |
| 0-5 | 12 | 2 | 3 | 1 | 3 | -75.0 | |||
| 6-9 | 10 | 3 | 3 | 2 | 2 | Figures too small for meaningful comparisons |
-80.0 | ||
| 10-14 | 13 | 14 | 4 | 1 | 2 | -84.6 | |||
| 15-17 | 34 | 16 | 9 | 7 | 7 | 0.0 | -22.2 | -56.3 | -79.4 |
| 18-20 | 88 | 53 | 20 | 15 | 14 | -6.7 | -30.0 | -73.6 | -84.1 |
| 21-24 | 66 | 49 | 26 | 25 | 11 | -56.0 | -57.7 | -77.6 | -83.3 |
| 25-64 | 357 | 300 | 137 | 133 | 138 | 3.8 | 0.7 | -54.0 | -61.3 |
| 65 | 192 | 154 | 64 | 76 | 93 | 22.4 | 45.3 | -39.6 | -51.6 |
| Total | 772 | 591 | 266 | 260 | 270 | 3.8 | 1.5 | -54.3 | -65.0 |
Table 38.3. Road fatalities by age group
Road safety by road type
In 2014, 57% of fatalities occurred on rural roads, 25% on urban roads and 12% on motorways.
Over the past 20 years, there has been a major improvement over the whole network.
The urban road environment was improved through the construction of mini roundabouts, cycle lanes and other infrastructure measures. As there has been less
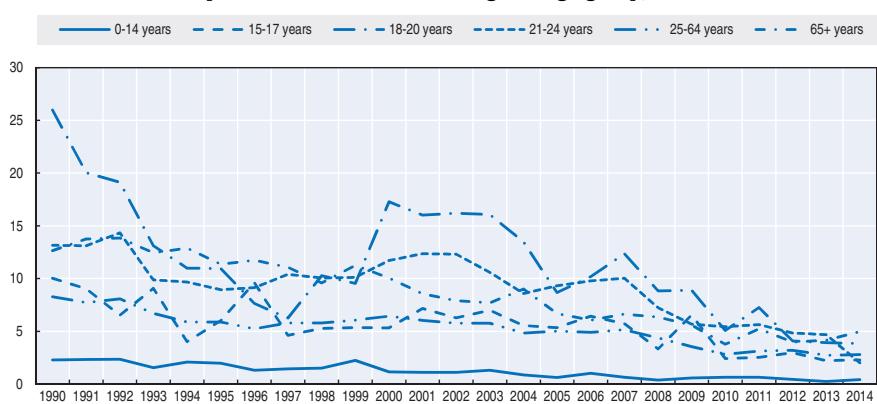
Figure 38.3. Road fatality rates by age group Deaths per 100 000 inhabitants in a given age group, 1990-2014
Figure 38.4. Road fatality rate by age and road user group Fatalities per 100 000 inhabitants, 2014
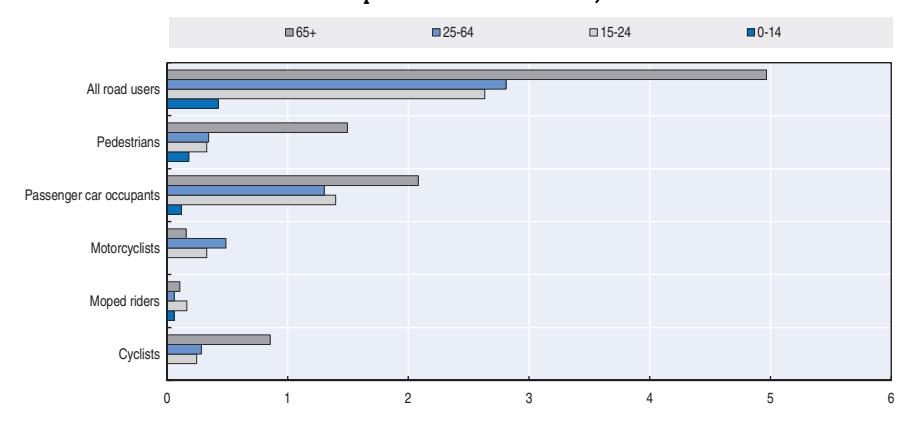
positive development recently in the safety of vulnerable roads users, future efforts will focus on safer municipal passages for pedestrians, cyclists and moped riders.
On rural roads, improvements in road safety since 2000 are in part due to the implementation of speed cameras and the generalisation of the "2+1" roads (i.e. the transformation of traditional two wide lane roads into three narrow lane roads with a median barrier). The central lane alternates between traffic directions at regular intervals to provide ample passing opportunities. After years of discussion and debate, the first 2+1 road was built, and it has been very cost effective by reducing head-on collisions on rural roads. The consistent trend towards safer vehicles and an increased focus on injury prevention has also supported road safety.
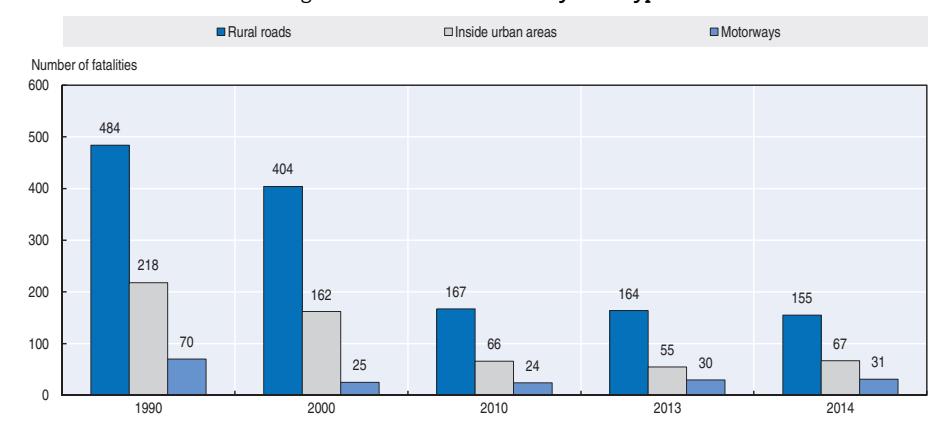
Figure 38.5. Road fatalities by road type
Economic costs of traffic crashes
Traffic crashes represent a significant cost for society, estimated in 2011 at around EUR 5.2 billion, or 1.3% of GDP. The cost of road crashes was first evaluated in 1990 by the ASEK Group, on the basis of a willingness-to-pay approach to assess the unit cost of a fatality, a hospitalised person, a slightly injured person and a property-damage-only crash. Since then, these unit costs are regularly re-evaluated taking into account the evolution of GDP and of the Consumer Price Index.
| Unit cost | Total | |
|---|---|---|
| Fatalities | EUR 900 million | |
| Hospitalised persons | EUR 2 700 million | |
| Slight injuries | EUR 800 million | |
| Property damage costs | EUR 800 million | |
| Total | EUR 5.2 billion | |
| Total as % of GDP | 1.3% |
Table 38.4. Cost of road crashes, 2011
Recent trends in road user behaviour
Speed
Speeding is a major problem in Sweden and the percentage of drivers exceeding speed limits was increasing at the beginning of the century. However, there are now indications that compliance with speed limits is somewhat better, primarily due to road safety cameras.
The reduction in the number of fatalities since 2007 is mainly explained by ongoing improvements to the vehicle fleet and infrastructure, and not least by reduced speeds. Average speeds on the national road network are estimated to have increased somewhat from 2013 to 2014 but have now returned to the 2012 level of 78.2 km/h (target: 77 km/h). However, the result is still below the required trend. Despite average speeds being in line with the required trend, compliance with speed limits remains at an unacceptably low level. In 2014, the share of traffic volume within speed limits was estimated at 47% (target: 80%) on national roads and 63% (target: 80%) on municipal roads.
Sweden has adopted tighter speed limits and introduced new limits in 10 km/h steps, ranging from 30 km/h to 120 km/h. In some specific areas, speed limits of 5, 10 and 20 km/h are also used.
The table below summarises the main speed limits in Sweden.
Table 38.5. Passenger car speed limits by road type, 2016
| General speed limit | |
|---|---|
| Urban roads | 30-50 km/h |
| Rural roads | 60-100 km/h |
| Motorways | 110 km/h or 120 km/h |
Drink driving
In Sweden, the legal blood alcohol content (BAC) limit is 0.2 g/l. A crash is defined as alcohol-related if a (BAC) level of above 0.2 g/l can be proven in the driver, rider, pedestrian or cyclist involved .Even if only 0.23% of all drivers in random tests are above the legal limit, in 2015, 61 out of the 259 fatalities (or 24%) involved a driver, rider, pedestrian or cyclist under the influence of alcohol.
The goal for Sweden is that, by 2020, 99.9% of drivers should be under the legal BAC limit of 0.2 g/l. The police's sobriety checks, which have decreased in number in recent years, represent an important measure for improving this indicator. An important role in future efforts to prevent drunk driving will also be played by devices that quickly and reliably identify alcohol in exhaled breath.
Drugs and driving
A drug related crash is defined as any crash where one of the persons involved has any trace of an illegal drug in the body.
It is forbidden to drive a motor vehicle under the influence of illegal drugs. A driver who is under suspicion of driving after taking illegal drugs must leave a sample of blood or saliva to be analysed. It is up to the driver to decide whether to drive when using medication. If the medication has a negative effect on driving, the person is not allowed to drive. In 2015, 21 fatalities involved a driver under the influence of illegal drugs; amphetamines being the substance most commonly found.
Distraction
The Swedish Road Traffic Ordinance requires drivers to pay sufficient attention to driving. To avoid crashes, road users shall "observe the care and attention that the circumstances demand". However, from 2013, the government has strengthened this bylaw, forbidding the use of communications devices when driving if "the use influences the driving in an unfavourable way". Sweden has not evaluated the problem but using a device like a smartphone is estimated to cause about 1% of all fatal crashes. In 2015, the government decided to undertake an assessment of the safety effect of the new by-law. The evaluation will be finished in April 2017.
Sleepiness and fatigue
Fatigue may be a stronger cause of road crashes than alcohol, it interacts with alcohol and drugs in a dramatic way. Sweden has no clear facts on the magnitude of the problem, but it is estimated that 10-20% of all crashes are caused by fatigue. Fatigue mostly concerns single-car crashes.
Seat belts and helmets
Seat belt use has been compulsory for front seats since 1975, rear seats since 1986 and it has been compulsory for children under 135 cm to use a child restraint system since 1988. The medical recommendation is that a booster seat or similar device be used up to the age of 12.
There has been a long-term upward trend in the use of seat belts. This trend will probably continue due to the increasing percentage of cars with seat belt reminder or warning functions.
The use of seat belts in the front of passenger cars was at 98 % during 2015. The proportion of car drivers killed who were unrestrained has decreased since 2001 and was at 38% in 2015.
In rear seats, children have always had a much higher rate of belt use than adults. In 2015, 98% of children in the rear seat were belted. This is an increase compared with 2014 and seat belt use among children in rear seats is now on a par with that of front seats.
| % | |||
|---|---|---|---|
| 2000 | 2014 | 2015 | |
| Front seat | |||
| General (driver + passengers) | 91 | 97 | 98 |
| Driver | 90 | 98 | 98 |
| Passenger | 92 | 96 | 97 |
| Rear seats | |||
| General | 81 | 89 | 93 |
| Children (use of child restraint) | 89 | 95 | 97 |
Table 38.6. Seat belt wearing rate by car occupancy and road type
All riders of powered two-wheelers (PTWs) are required to wear a helmet. The helmet wearing rate by riders of PTWs is high, at 96-99%. In Sweden, it is mandatory for children below 15 years of age to use a helmet while cycling, and 60-70% of children comply. About 30% of adults use helmets, but it varies greatly by city.
National road safety strategies and targets
Organisation of road safety
Several agencies in Sweden support the government in the field of road safety. Authorities co-operate with each other but have specific tasks within the road transport system. The three main governmental agencies are:
● Transportstyrelsen, the Swedish Transport Agency, whose goal is to offer good accessibility and high-quality, secure and environmentally friendly rail, air, sea and road transport. The Agency has overall responsibility for drawing up regulations and ensuring that authorities, companies, organisations and citizens comply with them.
- Trafikverket, the Swedish Transport Administration, is responsible for long-term planning of the transport system for all types of traffic, as well as for building, operating and maintaining public roads and railways. The Swedish Transport Administration is also responsible for administering the theoretical and practical driving tests needed for a driving licence for both professional and private drivers.
- Trafikanalys, Transport Analysis, which reviews the bases for decisions, assesses measures and is responsible for statistics.
Sweden is divided into 290 municipalities and 20 county councils. These municipalities and counties have responsibility for local road safety. Local government has a long tradition in Sweden. The country's municipalities, county councils and regions are responsible for providing a significant proportion of all public services, including road safety. They have a considerable degree of autonomy, as well as independent powers of taxation. Local selfgovernment and the right to levy taxes are stipulated in the Instrument of Government, one of the four pillars of the Swedish Constitution.
Road safety strategy for 2011-20
The basis of Swedish road safety work is Vision Zero, a strategic approach towards a safe system, whereby no-one is at risk of being fatally or severely injured while using road transport. There is no safety plan in a traditional sense.
Road safety targets
The current interim targets were adopted by the Swedish Parliament in 2009 and specify that the number of road fatalities should be halved between 2007 and 2020. That translates into a maximum of 220 road deaths in 2020. The number of seriously injured on the roads is to be reduced by a quarter. In addition to the current national target, there is an interim target at the EU level, for halving the number of road deaths between 2010 and 2020. This corresponds to a more stringent interim target of a maximum of 133 road deaths in 2020. No decision has yet been made to adjust the Swedish target to this level, and so the interim target of no more than 220 road deaths remains.
The target level and the monitoring process for reaching this target are being revised during 2015-2016 in order to make sure that the target levels and the indicators are as relevant as possible.
Monitoring targets
The Swedish Transport Administration regularly publishes progress reports towards the 2020 road safety objectives. The latest report was published in April 2015 "Analysis of road safety trends 2014. Management by objectives for road safety work towards the 2020 interim targets".
Compared to the mean value for 2006-08, the number of fatalities in 2014 has decreased by 38%, which represents an average annual decrease of approximately 7%. In order to achieve the target of no more than 220 deaths in 2020, the number of fatalities needs to decrease on average by 5% every year until then. The trend for the number of fatalities is thus currently on track for the 2020 target.
The number of seriously injured was estimated at approximately 5 400 for 2007 and approximately 4 900 for 2014. The interim target sets the maximum number of seriously injured at 4 000 for 2020, which corresponds to an annual rate of reduction of just over 2%. The number of seriously injured has declined by about 10% since 2007, which is an annual reduction of 1.4%. The trend is thus no longer sufficient in terms of the required annual reduction. A prerequisite for achieving the target is an improvement in cycling safety, especially if bicycle traffic volumes continue to rise.
To achieve the road safety targets, road safety work is managed by objectives and targets have been set for a number of performance indicators. These are the indicators used in the analysis of 2014 data. The table below shows the present level of the various indicators and an assessment of whether their rates of change are sufficient for achieving the target by 2020.
Table 38.7. Monitoring of safety performance indicators towards the 2020 interim targets
| Indicator | Starting point | 2015 | Target for 2020 | Trend |
|---|---|---|---|---|
| Number of road fatalities | 440 | 270 | 220 | In line with the required trend. |
| Number of seriously injured* | 5 400 | 4 900 | 4 000 | Not in line with the required trend |
| Share of traffic volume within speed limits, national road network |
43% | 46% | 80% | Not in line with the required trend |
| Share of traffic volume within speed limits, municipal road network |
64% | 64% | 80% | Not in line with the required trend |
| Share of traffic volume with sober drivers | 99.71% | 99.77% | 99.90% | Not in line with the required trend |
| Share of front seat passenger car occupants wearing a seat belt |
96% | 98% | 99% | In line with the required trend |
| Share of cyclists wearing a helmet | 27% | 38% | 70% | Not in line with the required trend |
| Share of moped riders using a helmet correctly | 96% | 97% | 99% | Not in line with the required trend |
| Share of new passenger cars with the highest Euro NCAP score |
20% | 63% | 80% | In line with the required trend |
| Share of safe motorcycles (ABS) | 9% | 44% | 70% | In line with the required trend |
| Share of traffic volume on roads with speed limit above 80 km/h and median barriers |
50% | 73% | 75% | In line with the required trend |
| Share of safe pedestrian, cycle and moped crossings on main municipal road networks |
19% | 25% | Not defined | |
| Share of municipalities with good-quality maintenance of pedestrian and cycle paths |
15% | No measurement in 2015 |
70% |
* Seriously injured is defined here as the number of persons with a medical impairment above 1%.
Recent safety measures (2013-16)
Speed management
● There are around 1 100 speed cameras on the rural network in Sweden. During 2014, only a few new cameras were introduced, but for the period 2015-20, yearly additions of about 200 new cameras are planned. This is expected to have a significant impact on speed compliance.
Vehicles
● The development of ABS as standard equipment on motorcycles has moved quickly over the last three years. From being standard with only one manufacturer and an expensive option with the others, ABS has become a natural piece of standard equipment on the
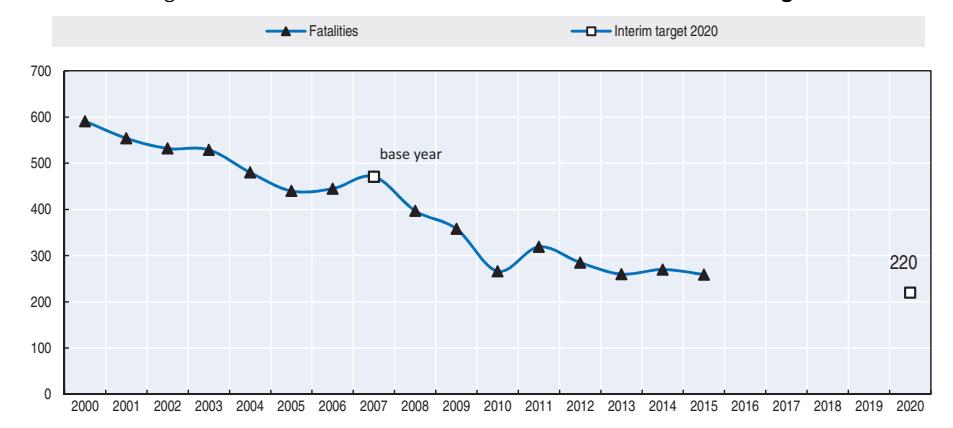
Figure 38.6. Trends in road fatalities towards national interim target
majority of the major motorcycle models. The percentage of traffic volume of motorcycles fitted with ABS increased from 9% in 2007 to 44% in 2015. The goal for 2020 is 70%.
Recent and ongoing research
Some research projects are presented below.
- Berg, H-Y., J. Ifver and M. Hasselberg (2016), "Public health consequences of road traffic injuries – Estimation of seriously injured persons based on risk for permanent medical impairment", Transportation Research Part F 38 (2016) 1-6.
- Eriksson, J. and G. Sörensen (2015), "Winter weathers' impact on injuries in singlepedestrian accidents", VTI report 868 – 2015. VTI. Linköping. In Swedish, summary in English.
- Forsman, Å. (2015), "Alcohol, drugs and medicines among killed drivers of passenger cars Year 2005-2013", VTI-notat 11-2015, VTI, Linköping. In Swedish, summary in English.
- Gregersen, N.P., et al., "Accident involvement of young moped riders Causes and consequences", VTI Report 856 – 2015,VTI, Linköping. In Swedish, summary in English.
- Vadeby, A. and U. Björketun (2016), "Safe accessibility traffic safety evaluation 2013 and 2014", VTI-notat 7-2016, VTI, Linköping. In Swedish, summary in English.
- Vadeby, A. and U. Björketun (2015), "New speed limits in Sweden long term traffic safety effects", VTI Report 860 – 2015, VTI, Linköping. In Swedish, summary in English
References
The Swedish Transport Administration (2015), Analysis of road safety trends 2014. Management by objectives for road safety work towards the 2020 interim targets: http://online4.ineko.se/trafikverket/ Product/Detail/50450 (accessed 11 May 2016).
Websites
- Swedish Transport Administration: www.trafikverket.se.
- Swedish Transport Agency: www.transportstyrelsen.se/en/.
- Swedish National Road and Transport Research Institute VTI: www.vti.se/en/.
- Transport Analysis: www.trafa.se.
- Chalmers University: www.chalmers.se.
Chapter 39
Switzerland
This chapter presents detailed 2014 and 2015 road safety data for Switzerland. It looks at trends in traffic and road safety from the years 1990 to 2015 and road user behaviour patterns. This includes data on speed, drink driving, drugs and driving, distracted driving, fatigue, and seat belt and helmet use. The chapter reviews Switzerland's road safety strategy along with the most recently implemented safety measures.*
* All data stem from Federal Roads Office (FEDRO), Swiss Council for Accident Prevention (bfu) and IRTAD unless otherwise noted. For more information please contact: philippe.bapst@astra.admin.ch or s.niemann@bfu.ch.
In 2015, there were 253 road fatalities in Switzerland, 10 more than the previous year, or a 4% increase. However, as 2014 fatalities were the lowest on record, this figure does not question the overall decreasing trend. The number of fatalities for 2015 remains below the average of the last four years. Electric bicycles have formed a new category of vehicles in police records. In 2015, 14 fatal and 163 seriously injured electric bike riders were registered. Since January 2014, a number of measures of the Swiss road safety programme Via Sicura came into force including use of daytime running lights and stricter measures on speeding and drink driving.
Road safety data collection
Definitions applied in Switzerland
- Road fatality: Death which occurred within 30 days of the road crash.
- Seriously injured person: Until 2014, a serious injured person had to be either hospitalised for at least 24 hours or be incapable of resuming his or her daily activity for 24 hours. Since January 2015 hospitalisation for at least 24 hours became the minimum precondition for classification as a serious injury. To enable standardisation the severity scale was linked to the codes of the National Advisory Committee for Aeronautics, used by all emergency services in Switzerland. A serious injury is either a significant (NACA Codes 3 and 4) or a life-threatening injury (NACA Codes 5 and 6).
- Slight injury: Minor injury such as superficial skin injury. The casualty can leave the crash site unaided. An outpatient treatment in a hospital or by physicians may still be required.
- Injury crash: Crash resulting in at least one injured or killed person.
In Switzerland, injury severity is assessed by police present at the scene. Following the new definition on serious injury, in force since January 2015, police officers are trained to record injury severity based on the new classification.
Data collection
Since January 2011, the Federal Roads Office (FEDRO) is responsible for all Swiss road crash data. A new reporting form was introduced to all cantonal police forces and a new platform for data entry and data analysis (statistical and geographical) is available online.
To estimate the real extent of road traffic injuries, police-reported data is compared to insurance data. Factors are then calculated to correct the number of unreported cases by road use and age group.
In order to have a better understanding of the consequences of road crashes, the Swiss Federal Roads Office started a research project to link police-reported data of a given year with other data sources, including hospital data. This will allow coding of the recommended maximum Abbreviated Injury Scale score based on the International Classification of Diseases (ICD-10). A yearly data linkage procedure is now being implemented. The availability of data for several years will allow the addressing of important research questions. A research report with initial results was published in 2014. The first reporting of MAIS3+ cases based on the data linkage will be done in July 2016.
Most recent safety data
Road crashes in 2015
In 2015, there were 253 road fatalities in Switzerland, a 4% increase from 243 in 2014. However, this figure does not question the overall decreasing trend. The number of fatalities in 2015 is below the average for the last four years.
While cyclist deaths decreased by 14%, 14 e-Bike riders were killed – 5 more than in 2014. There were 66 fatally injured motorcycle riders, a 25% increase compared to 2014, probably due to the mild weather in summer 2015.
As mentioned above, a new and tightened definition of "serious injury" was introduced in 2015. This led to a decrease in the number of seriously injured road users while slightly injured road users increased compared to the previous year.
Road crashes in 2014
In 2014, a total of 17 803 injury crashes occurred on Switzerland's roads in which 243 persons were killed – a 10% decrease in comparison to 2013. In 2014, Switzerland experienced its lowest level of fatalities since record-keeping began.
The downward trend in the number of serious injuries has continued. Safer vehicles are likely to have contributed to this trend as the share of seriously injured passenger car occupants has been decreasing substantially in recent years. However, 29 cyclists were killed – 12 more fatalities than in 2013. The number of seriously injured cyclists has increased by 13%. There were 145 seriously injured e-Bike riders, continuing the negative trend observed in recent years. Pedestrian deaths declined by 40% to 43 persons killed.
Trends in traffic and road safety (1990-2015)
Traffic
Since 1990, distance travelled (vehicle-kilometres) increased by 27% and the number of motorised vehicles increased by 53%.
Total vehicle-kilometres travelled in 2014 showed an increase of 1.6% compared with the previous year. Provisional figures for 2015 indicate that the overall traffic volume rose again (1.2%).
Constant population growth and the ever-increasing trend of mobility lead to increasing traffic volume for both individual and public transport. An important characteristic of the traffic in Switzerland is the transport of freight through the Alps. In recent years there has been stagnation in transalpine freight traffic. However, the proportion of foreign vehicles is still above 70%.
Road safety
Crashes and casualties
Road fatalities peaked in 1971, when 1 720 people died on the roads. Between 1971 and 1996, the number of fatalities significantly diminished. The average annual reduction from 1971 to 1976 was 7.5%, and then 3%, until 1996. Between 1997 and 2000, the number of casualties was stable at around 600 per year. In 2004-06, the rate of decrease significantly accelerated. Recent figures show a downward trend in the numbers of those seriously injured, after years of little change.
In the last 15 years several important safety measures have been implemented in Switzerland, including:
- 2005: The legal blood alcohol content (BAC) limit was lowered to 0.5 g/l. At the same time police were authorised to check for alcohol without suspicion.
- 2005: Jurisdiction for licence withdrawal was strengthened and a new, two-stage drivers' training was introduced.
- 2013-14: The first measures of the road safety programme "Via Sicura" came into force, including mandatory daytime running lights, a zero blood alcohol limit for novice, bus and truck drivers, and tightened sanctions for excessive speeding up to lifelong licence withdrawal, seizure and exploitation of motor vehicles.
Rates
In 2014, the mortality rate expressed in terms of deaths per 100 000 inhabitants was 3.0, a 60% decrease compared to 2000. Similarly, the mortality risks, expressed in terms of deaths per distance travelled, have decreased by two-thirds since 2000.
1990 2000 2010 2013 2014 2014 % change from 2013 2010 2000 1990 Reported safety data Fatalities 925 592 327 269 243 -9.7 -25.7 -59.0 -73.7 Injury crashes 23 834 23 737 19 609 17 473 17 803 1.9 -9.2 -25.0 -25.3 Deaths per 100 000 inhabitants 13.9 8.3 4.2 3.3 3.0 -10.8 -28.9 -63.9 -78.5 Deaths per 10 000 registered vehicles 2.2 1.2 0.6 0.5 0.4 -10.7 -30.8 -66.7 -81.2 Deaths per billion vehicle kilometres 18.6 10.6 5.2 4.3 3.9 -10.2 -26.5 -63.7 -79.3 Traffic data Registered vehicles (thousands) 4 242 4 822 5 525 5 869 5 937 1.2 7.5 23.1 40.0 Vehicle kilometres (millions) 49 624 55 686 62 339 62 647 63 028 0.6 1.1 13.2 27.0 Registered vehicles per 1 000 inhabitants 636 673 710 730 729 -0.1 2.8 8.4 14.8
Table 39.1. Road safety and traffic data
1 2 http://dx.doi.org/10.1787/888933385699
Road safety by user group
All user groups have benefited from the improvement in road safety since 1990. A sharp decrease is observed for moped riders (-98%) that is mainly due to a large reduction in moped distance travelled in recent years.
Since 2000, car occupant safety has improved substantially (-65%). The penetration of safer vehicles in the fleet partly explains these good results.
Since 2011, electric bikes constitute a new category of vehicle in police records. From 2011 to 2014 serious or fatal crashes involving these vehicles increased in proportion to the sales figures. In 2015, 14 fatal and 163 seriously injured electric bike riders were registered by the police. From 2011 to 2015, 8 of 10 fatally injured e-Bike riders were aged 65 or older.
In the last few years, on average 65 pedestrians were killed each year. The figure for 2014, with 43 pedestrians killed, was a statistical outlier downwards. In 2015, the number of killed pedestrians increased again to 58.
40 60 80 100 140 160 1990 1991 1992 1993 1994 1995 1996 1997 1998 1999 2000 2001 2002 2003 2004 2005 2006 2007 2008 2009 2010 2011 2012 2013 2014 2015 Fatalities Injury crashes Motor vehicles Veh-km GDP
Figure 39.1. Road safety, traffic and GDP trends index 1990 = 100
Source: World Bank for Gross Domestic Product (GDP; constant prices).
Table 39.2. Road fatalities by road user group
| 2014 % change from | |||||||||
|---|---|---|---|---|---|---|---|---|---|
| 1990 2000 2010 2013 |
2014 | 2013 | 2010 | 2000 | 1990 | ||||
| Cyclists | 58 | 48 | 34 | 21 | 34 | 61.9 | 0 | -29.2 | -41.4 |
| Moped users | 49 | 19 | 4 | 8 | 1 | -87.5 | -75.0 | -94.7 | -98.0 |
| Motorcyclists | 155 | 92 | 67 | 55 | 53 | -3.6 | -20.9 | -42.4 | -65.8 |
| Passenger car occupants | 455 | 273 | 129 | 103 | 97 | -5.8 | -24.8 | -64.5 | -78.7 |
| Pedestrians | 167 | 130 | 75 | 69 | 43 | -37.7 | -42.7 | -66.9 | -74.3 |
| Others | 41 | 30 | 18 | 13 | 15 | 15.4 | -16.7 | -50.0 | -63.4 |
| Total | 925 | 592 | 327 | 269 | 243 | -9.7 | -25.7 | -59.0 | -73.7 |
Figure 39.2. Road fatalities by road user group in percentage of total 2014
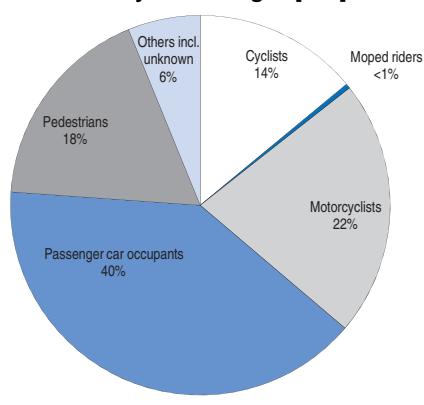
Road safety by age group
Since 1990, a reduction in fatalities has been observed in all age groups, with a greater than average reduction for teenagers and young people. The trend for the elderly is less positive than for other age groups. Older people are particularly vulnerable as pedestrians. In the period 2011-14, 60% of all pedestrian fatalities were aged 65 or over.
The mortality rate of young people (18-20) has decreased substantially since 2004. This is partly explained by a reduced exposure as the mean age for obtaining a driving licence is increasing. Another explanation is the introduction in 2005 of the two-phase licensing scheme, with a three-year probationary licence.
| | | | | | | | 2014 % change from | | | |
|-------|------|------|------|------|------|----------------------------------------------------------------|--------------------|-------|-------|--|
| Age | 1990 | 2000 | 2010 | 2013 | 2014 | | 2010 | 2000 | 1990 | |
| 0-5 | 15 | 10 | 4 | 7 | 2 | Comparison is not relevant
due to small absolute
numbers | | -80.0 | -86.7 | |
| 6-9 | 12 | 11 | 0 | 3 | 2 | | | -81.8 | -83.3 | |
| 10-14 | 20 | 7 | 4 | 2 | 5 | | | -28.6 | -75.0 | |
| 15-17 | 28 | 26 | 12 | 2 | 2 | 0.0 | -83.3 | -92.3 | -92.9 | |
| 18-20 | 93 | 42 | 21 | 13 | 18 | 38.5 | -14.3 | -57.1 | -80.6 | |
| 21-24 | 121 | 49 | 15 | 17 | 20 | 17.6 | 33.3 | -59.2 | -83.5 | |
| 25-64 | 438 | 285 | 170 | 125 | 108 | -13.6 | -36.5 | -62.1 | -75.3 | |
| 65 | 198 | 161 | 101 | 100 | 86 | -14.0 | -14.9 | -46.6 | -56.6 | |
| Total | 925 | 592 | 327 | 269 | 243 | -9.7 | -25.7 | -59.0 | -73.7 | |
Table 39.3. Road fatalities by age group

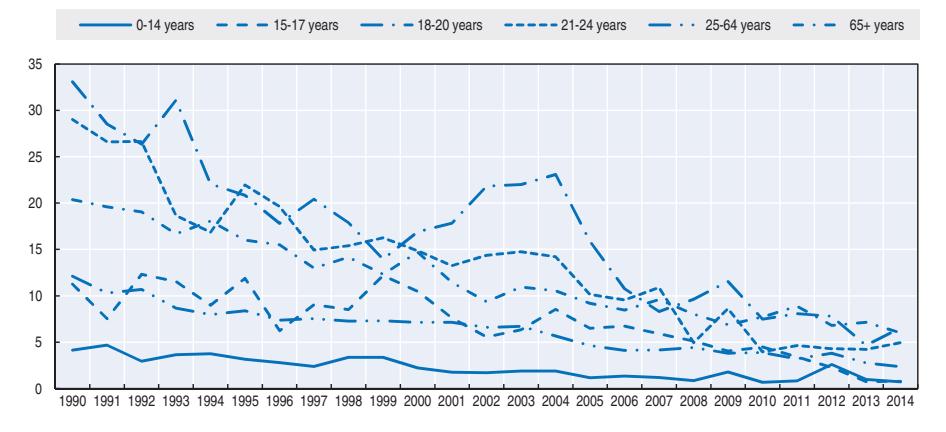
Road safety by road type
In the last 25 years fatalities in urban areas decreased by 60%, on rural road by 68% and 75% on motorways. Motorways, the safest roads, have thus become even saver.
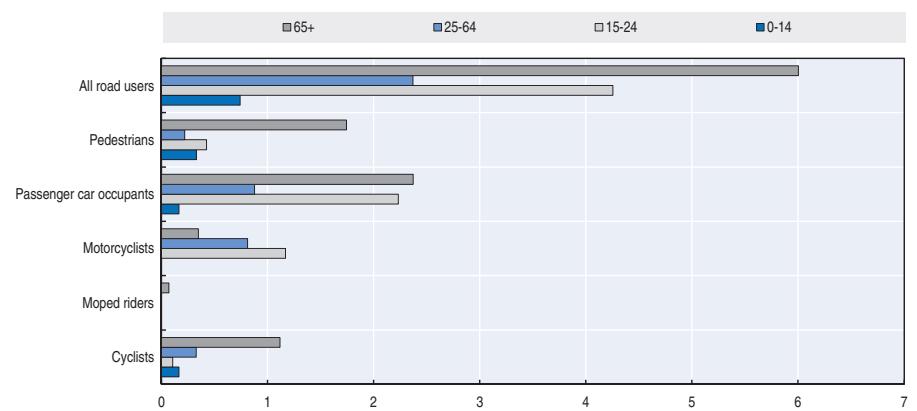
Figure 39.4. Road fatality rate by age and road user group Fatalities per 100 000 inhabitants, 2014
In 2015, for the first time, more road users were killed on urban road than on rural roads (119 vs. 113). 21 were killed on motorways, 9 more than 2014 but still few compared to the other road types.
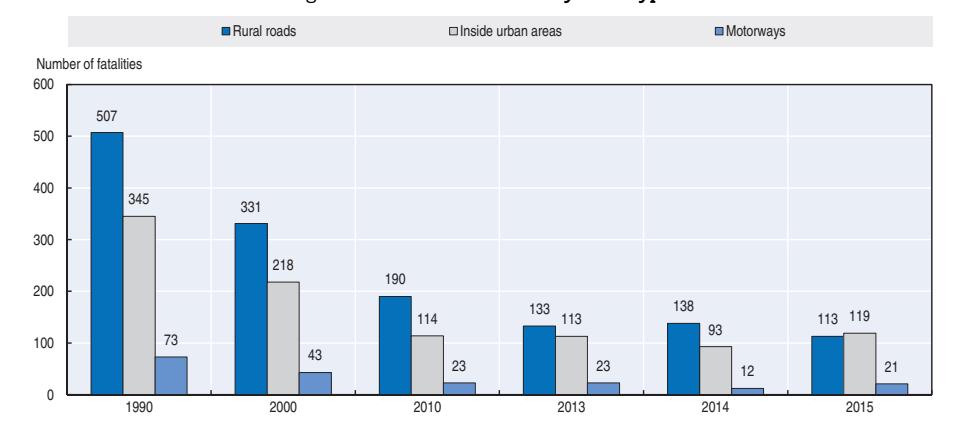
Figure 39.5. Road fatalities by road type
Economic costs of traffic crashes
In 2012, the cost of road crashes was CHF 9.9 billion. This estimate of the total economic burden is based on a willingness-to-pay approach (Niemann et al., 2015). The estimate includes non-reported crashes.
Table 39.4. Costs of road crashes, 2012
| Unit cost (CHF) | Total | |
|---|---|---|
| Fatalities | 3.11 million | 0.9 billion |
| Hospitalised persons | 0.36 million | 5.6 billion |
| Slight injuries | 0.02 million | 1.1 billion |
| Property damage costs | 2.4 billion | |
| Total | CHF 9.9 billion |
Source: bfu (2015).
Recent trends in road user behaviour
Speed
In 2015, speed was a contributing factor in about 27% of fatal crashes. In most cases, inappropriate speed is to blame rather than excessive speed. In 2010, the proportion of drivers above the speed limit was 23% on urban roads, 31% on rural roads and 18% on motorways. The survey on actual speeds was stopped in 2010.
The table below summarises the main speed limits in Switzerland.
Table 39.5. Passenger car speed limits by road type, 2016
| General speed limit | |
|---|---|
| Urban roads | 50 km/h |
| Rural roads | 80 km/h |
| Motorways | 120 km |
Drink driving
An alcohol crash is defined as any fatal crash, in which any active participant (driver, pedestrian, cyclist, etc.) has a blood alcohol level (BAC) above the legal limit.
In 2005, the maximum legal BAC was reduced from 0.8 g/l to 0.5 g/l and random breath testing was introduced. As of 1 January 2014, novice drivers are subject to a zero alcohol limit for their first three years behind the wheel. The same restriction applies to all professional drivers.
In 2015, 14% of fatal crashes involved a driver with a BAC above 0.5 g/l. In the last few years the share of alcohol crashes on all fatalities declined. While the share of drivers under influence of alcohol is not known, results from research areas show that the acceptance of drink driving in the population is decreasing.
Drugs and driving
In 2015, 16 road fatalities (6%) were explicitly due to a road user impaired by drugs, legal or not. However, in official statistics, the consumption of drugs is probably underreported.
In Switzerland the limit for drugs is set at zero ("zero tolerance"). The road traffic law specifies that driving ability must be ensured. The use of any drugs which reduce driving ability is prohibited. In the case of some drugs, like THC or amphetamine, a positive test is proof of reduced driving ability and considered an offence. In the case of other drugs or medical substances a "three-pillar system" is used: Driving impairment is judged by police, physicians and blood tests.
Distraction
"Distraction or lack of attention" is cited in 23% of fatal crashes. Distraction or lack of attention is judged by the police at scene and includes distraction by passengers, animals, use of mobile phone, handling car equipment like air conditioning or a navigation system.
The use of mobile phones without a hands-free set or for texting is subject to a fine of CHF 100. Although using mobile phones with hands-free sets is not prohibited, in several cases the Swiss Federal Court has qualified such use as a situation that leads to impaired driving.
Sleepiness and fatigue
According to police reporting, 3% of all fatal crashes in 2014 were due to fatigue. The real number is expected to be much higher.
Seat belts and helmets
Seat belt use has been compulsory in front seats since 1981 and in rear seats since 1994. Since 2002, dedicated child-restraint systems have been mandatory for all children below the age of seven. Starting from 1 April 2010, new regulations have been applied for the transport of children in cars: Children between 7 and 12 and less than 150 cm must be restrained with a certified child-restraint system.
In 2015, seat belt wearing rates among car drivers and front-seat passengers remained stable, with figures of 93% and 92% respectively. The rate in back seats remains low at 76%. Significant differences were again revealed by location and language region: the wearing rate was highest (96%) on motorways. On rural roads and urban roads it was lower at 93% and 92%.
In the past three years, 46% of killed car occupants were not wearing a seat belt. Considering the actual wearing rate and a 50% protective effect of the seat belt on front seats and 25% on rear seats, it is estimated a 100% wearing rate in front and rear seats would have saved five lives in 2013.
| | % | | | | | | | |-----------------------------------|-----------|-----------|-----------|------|--|--|--| | | 2000 | 2010 | 2014 | 2015 | | | | | Front seat | | | | | | | | | Driver | 77 | | 94 | 93 | | | | | Passenger | | | 93 | 92 | | | | | Urban roads (driver) | 66 | | 92 | 92 | | | | | Rural roads (driver) | 74 | | 93 | 93 | | | | | Motorways (driver) | 89 | | 97 | 96 | | | | | Rear seats | | | | | | | | | General | 32 | | 77 | 76 | | | | | Children (use of child restraint) | 85 (2002) | 94 (2007) | 93 (2012) | | | | |
Table 39.6. Seat belt wearing rate by car occupancy and road type
Helmet wearing has been compulsory on motorcycles since 1981 and on mopeds (up to 50 cc, maximum speed 45 km/h) since 1990. Observation indicates a compliance rate of almost 100%.
Since 2012 bicycle helmets are required on electric bicycles above 25 km/h pedal assistance.
National road safety strategies and targets
Organisation of road safety
Due to Swiss federalism, many organisations are involved in and responsible for road safety, including local and cantonal authorities, special interest groups and insurance companies. The leading roles in road safety are taken mainly by the three organisations: The Fund for Road Safety, the Swiss Council for Accident Prevention (bfu) and the Federal Roads Office (FEDRO). The Swiss Federal Council regulates the national road safety policy and is responsible for the Via Sicura road safety programme.
Road safety strategy for 2011-20
On 15 June 2012, the Swiss Federal Council adopted the road safety programme Via Sicura, almost 10 years after the first proposal. A range of safety measures is being progressively implemented (see details in section below).
Road safety targets
No quantitative target was set under the Via Sicura programme.
Monitoring targets
An evaluation of the Swiss road safety programme Via Sicura will be carried out in 2016. First results are expected in 2017.
Bfu regularly publishes safety performance indicators, including daytime running lights, seat belt use and bicycle helmet use.
Recent safety measures (2013-16)
On January 2014, a number of measures of the Swiss road safety programme Via Sicura came into force.
Speed management
● A driver's licence is revoked for a minimum two years in cases of excessive speeding and for 10 years to life in case of repeated offences.
Drink driving
- As of 1 January 2014, novice drivers are subject to a zero alcohol limit for their first three years behind the wheel. The same restriction applies to all professional drivers.
- Excessive drink-driving offenders must equip their car with an alcolock.
- A test on fitness to drive is mandatory for those convicted of offences such as driving under the influence of drugs.
Infrastructure
● A new norm "Single Accident Site Management" was published in 2015.
Vehicles
● As of January 2014, daytime running lights are mandatory for all motorised vehicles. The bfu-survey on daytime running lights was conducted in July 2014. Six months after daytime running lights became mandatory 94% of vehicles were in compliance with the new regulation (compared to 68% in 2013).
Recent and ongoing research
- A study on the safety of e-Bikes was published: bfu-Report Nr. 72, www.bfu.ch/sites/assets/ Shop/bfu\_2.258.01\_bfu-Report%20Nr.%2072%20–%20E-Bikes%20im%20Strassenverkehr%20– %20Sicherheitsanalyse.pdf (accessed on 10 May 2016).
- A study on the safety effects of accident recorders is ongoing.
References
Bfu (2015), SINUS 2015 Annual report, Swiss Council for Accident Prevention.
Niemann, S., C. Lieb and H. Sommer (2015), Nichtberufsunfälle in der Schweiz: Aktualisierte Hochrechnung und Kostenberechnung, bfu-Report 71. Bern, bfu – Beratungsstelle für Unfallverhütung.
Websites
- Federal Roads Office (FEDRO/ASTRA): www.astra.admin.ch.
- Swiss Council for Accident Prevention (bfu): www.bfu.ch.
- STATUS 2015: statistics on non-occupational accidents and the level of safety in Switzerland: www.bfu.ch/sites/assets/Shop/bfu\_2.265.08\_STATUS%202015%20%e2%80%93%20Statistics%20on%20nonoccupational%20accidents%20and%20the%20level%20of%20safety%20in%20Switzerland.pdf.
- Road accident data: www.astra.admin.ch/unfalldaten.
Chapter 40
United Kingdom
This chapter presents 2014 road safety data for the United Kingdom along with provisional data from 2015. It looks at trends in traffic and road safety from the years 1990 to 2014 and road user behaviour patterns. This includes data on speed, drink driving, drugs and driving, distracted driving, fatigue and seat belt usage. The chapter reviews the United Kingdom's road safety strategy and recently implemented safety measures.*
* Information and data presented in this report from the Department for Transport concern the United Kingdom (i.e. Great Britain + Northern Ireland). Where comparable information is not available for Northern Ireland, data are provided for Great Britain only, which accounts for 97% of UK fatalities. All data stem from the Department for Transport and IRTAD unless otherwise noted. For more information please contact: anil.bhagat@dft.gsi.gov.uk
In 2014, the United Kingdom saw an increase of 4% in the number of fatalities with a total of 1 775 killed in road crashes, 62 more than 2013. Nevertheless, this remains the third lowest year on record after 2012 and 2013. This increase in fatalities was seen mainly in the over 60 age group and among pedestrians. Weather conditions and a large increase in vehicle kilometres travelled may have contributed to it. The United Kingdom still has one of the lowest fatality rates in 2014 of 2.9 deaths per 100 000 inhabitants. Key priorities for 2015 onward include protecting vulnerable users and adopting the Safe System approach.
Road safety data collection
Definitions applied in the United Kingdom
- Road fatality: Human casualties whose injuries resulted in death within 30 days of a road accident. Confirmed suicides are excluded.
- Serious injury: An injury for which a person is detained in hospital as an "in-patient", or any of the following injuries whether or not they are detained in hospital: fractures, concussion, internal injuries, crushings, burns, severe cuts, severe general shock requiring medical treatment and injuries causing death 30 or more days after the accident. Casualties are recorded as seriously or slightly injured by police on the basis of information available within a short time following the accident, and may take into account whether the casualty is hospitalised. Hospitalisation procedures vary regionally.
- Slight injury: An injury of a minor character such as a sprain (including neck whiplash), bruise or cut which are not judged to be severe, slight shock requiring roadside attention and injuries not requiring medical treatment.
- Injury accident: An accident in which at least one person is injured or killed.
Data collection
There are three main sources of safety information in the United Kingdom:
- The national road accident reporting system, STATS19, which is based upon police reports.
- Information from coroners (in England and Wales) and procurators fiscal (in Scotland) on the levels of alcohol in the blood of people killed in road traffic accidents.
- Hospital episode statistics (HES).
Most of the data in this report, which is also included in the IRTAD database, come from STATS19.
While all fatal crashes are reported by the police, data from hospitals, surveys and compensation claims indicate that a considerable proportion of non-fatal casualties are not known to the police. The best current estimate derived from the National Travel Survey (2014) is that the total number of road casualties in Great Britain annually, including those not reported to the police, is within the range 660 000 to 830 000 with a central estimate of 740 000 (DfT, 2015a).
The National Travel Survey results suggest that about 10% of crashes reported by the respondents are outside the scope of STATS19 accident data. This should be borne in mind when using and analysing the STATS19 data.
Linking HES data from hospitals and police data for England gives a better understanding of injury severity and outcomes. Around 47% of the police-reported seriously injured casualties for England alone are matched to the hospital records. As part of this linkage, the Department for Transport has been working with the Maximum Abbreviated Injury Scale (MAIS) to rate the severity of injury crashes. The Department expects to publish estimates based on the England HES data grossed up to the whole of Great Britain in autumn 2016.
Most recent safety data
Road crashes in 2015 – provisional data
In the year ending September 2015, there were 1 780 reported road fatalities in Great Britain, a 3% increase from 1 731 in the previous year. This increase is not statistically significant. This means that the increase is probably to do with a combination of factors that have come about by chance, rather than any specific change. There has been a statistically significant decrease in the number of people injured in road traffic accidents between the years ending September 2014 and 2015.
Motor traffic levels rose by 2.2% compared with the 12-month period ending September 2014.
A straight comparison between the first three individual quarters of 2014 and 2015 (i.e. just nine months, rather than a full 12 months) shows that the two years have an almost identical number of fatalities (around 1 260). Therefore, the fourth quarter of 2015 is key to how the two years will compare. The fourth quarter of 2015 was marked by rainfall and flooding across northern Britain. Flooding inevitably closes roads and discourages people from taking road trips. It is possible, but no means inevitable, that the final 2015 fatality figure could be lower than 2014 (DfT, 2016).
The final figures for 2015 will be published at the end of June 2016.
Road crashes in 2014
A total of 1 775 people were killed in reported road traffic crashes in Great Britain in 2014. This is an increase of 62 fatalities (or 4%) from 2013. It is the third lowest year on record after 2012 and 2013. With the exception of 2010 to 2011, which was affected by severe weather, 2014 is the first rise in fatalities over the calendar year since 2003. The vast majority of the increase in the number of fatalities has been in casualties aged 60 or older and pedestrians (Dft, 2015b).
The number of people seriously injured in reported road traffic accidents in Great Britain increased by 5% to 22 807 in 2014, compared with 2013.
The change in neither fatalities nor seriously injured casualties is statistically significant. However, they have both increased and the final figures are not far off the 95% confidence interval. Furthermore, the number of slightly injured casualties has increased by a statistically significant amount. When three independent measures move in the same direction, even if some of them do not change by a statistically significant amount, it can suggest that the changes have not entirely come about through random variation.
To complicate the picture, though, the vast majority of the increase in the number of fatalities has been in casualties aged 60 or older and pedestrians. There are no obvious factors that would affect just people in this age group to such a significant degree.
The complexity of what happened during 2014 makes it impossible to be sure whether the increases in fatalities and injuries in reported road traffic accidents reflect some underlying changes on Great Britain's roads, or whether they reflect a natural variation in crashes around the country.
Trends in traffic and road safety (1990-2014)
Traffic
Motor vehicle traffic in Great Britain peaked in 2007 and decreased consecutively each year to 2010. From 2010 to 2013, traffic volumes remained broadly stable and in 2013 overall motor vehicle traffic volume levels were similar to levels seen in 2003.
In 2014 car traffic saw the largest annual increase since 2002. Light Goods Vehicle (LGV) traffic attained the highest ever figure. Motor vehicle traffic increased by 2.4 % between 2013 and 2014 on Great Britain's roads. Traffic on all types of road increased in 2014 compared to 2013.
Provisional estimates for 2015 indicate that annual motor vehicle traffic was at the highest level ever, exceeding 511 billion vehicle kilometres.
Road safety
Crashes and casualties
Road fatalities reached a peak in 1941 to just over 9 000 in Great Britain. Since then it decreased by more than 80% reaching 1 775 in 2014. This was the third lowest year on record, after 2012 and 2013.
The number of fatalities in the United Kingdom decreased by 66% from 1990 to 2014, and by 48% between 2000 and 2014. Various factors may have contributed to the recent large reductions in fatalities in addition to the longer-term trends in improved vehicle safety, road engineering, trauma care and education. The recession and economic downturn led to falling traffic levels and the continued reduction in average speeds will have played a significant part. Similarly large falls in fatalities were seen in the recession in the early 1990s.
Over more recent years, though, traffic levels have risen again, probably now exceeding the pre-recession levels. This might be one key reason why casualty levels have, at best, plateaued and might start to increase again.
As the number of road casualties decreases, understanding the reasons behind yearon-year changes becomes more important, and weather patterns provide useful context. A statistical model has indicated that had the weather throughout 2014 been closer to the long term average then there may have been around 40 fewer fatalities during the year – suggesting that the rise from non-weather related factors was of the order of 1%. This does not change what happened in terms of road safety, but helps policy makers and practitioners decide what changes in casualty numbers relate to factors they can influence and what changes are owing to external factors.
Rates
Fatality rates have generally been on a downward trend since 1973, with some intermittent periods where small increases were observed. In 2014, the UK had a fatality rate of 2.9 deaths per 100 000 inhabitants.
Table 40.1. Road safety and traffic data, United Kingdom
| 2014 | 2014 % change from | ||||||||
|---|---|---|---|---|---|---|---|---|---|
| 1990 | 2000 | 2010 2013 |
2013 | 2010 | 2000 | 1990 | |||
| Reported safety data | |||||||||
| Fatalities | 5 402 | 3 580 | 1 905 | 1 770 | 1 854 | 4.7 | -2.7 | -48.2 | -65.7 |
| Injury crashes | 265 600 | 242 117 | 160 080 | 144 480 | 152 407 | 5.5 | -4.8 | -37.1 | -42.6 |
| Deaths per 100 000 inhabitants | 9.4 | 6.1 | 3.0 | 2.8 | 2.9 | 3.9 | -5.4 | -52.8 | -69.6 |
| Deaths per 10 000 registered vehicles | 2.4 | 1.2 | 0.5 | 0.5 | 0.5 | 3.0 | -6.8 | -58.2 | -76.5 |
| Deaths per billion vehicle kilometres | 12.8 | 7.4 | 3.8 | 3.5 | 3.6 | 2.2 | -5.2 | -52.0 | -72.2 |
| Traffic data | |||||||||
| Registered vehicles (thousands) | 25 191 | 29 629 | 35 170 | 36 101 | 36 715 | 1.7 | 4.4 | 23.9 | 45.7 |
| Vehicle kilometres (millions) | 422 840 | 482 951 | 507 814 | 508 584 | 521 188* | 2.5 | 2.6 | 7.9 | 23.3 |
| Registered vehicles per 1 000 inhabitants | 440 | 503 | 560 | 563 | 568 | 0.9 | 1.4 | 13.0 | 29.1 |
* Estimation.
1 2 http://dx.doi.org/10.1787/888933385707
Figure 40.1. Road safety, traffic and GDP trends index 1990 = 100, United Kingdom
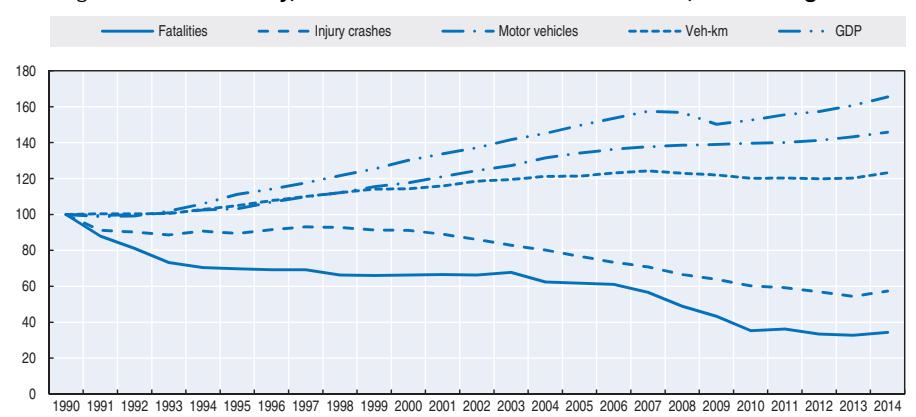
Source: World Bank for Gross Domestic Product (GDP;constant prices).
Road safety by user group
Since 1990, the reduction in mortality has benefited all road users. Of all the user groups with significantly large numbers, the greatest reduction has been for pedestrians over the long-term.
However, pedestrians accounted for three-quarters of the increase in total fatalities between 2013 and 2014. Pedestrian fatalities in Great Britain increased by 12%, from 398 in 2013 to 446 in 2014. In particular, almost all of this increase was in casualties aged 60 or over. There is no clear reason for this increase.
In 2014, car occupants accounted for 45% of road deaths, pedestrians for 25%, motorcyclists for 19%, and cyclists for 6%.
| 2014 % change from | |||||||||
|---|---|---|---|---|---|---|---|---|---|
| 1990 | 2000 | 2010 | 2013 | 2014 | 2013 | 2010 | 2000 | 1990 | |
| Cyclists | 267 | 131 | 111 | 113 | 116 | 2.7 | 4.5 | -11.5 | -56.6 |
| Moped users | 37 | 15 | 10 | 4 | 6 | 50.0 | -40.0 | -60.0 | -83.8 |
| Motorcyclists | 634 | 597 | 403 | 337 | 347 | 3.0 | -13.9 | -41.9 | -45.3 |
| Passenger car occupants | 2 462 | 1 784 | 867 | 819 | 839 | 2.4 | -3.2 | -53.0 | -65.9 |
| Pedestrians | 1 754 | 889 | 415 | 405 | 464 | 14.6 | 11.8 | -47.8 | -73.5 |
| Others | 248 | 164 | 99 | 92 | 82 | -10.9 | -17.2 | -50.0 | -66.9 |
| Total | 5 402 | 3 580 | 1 905 | 1 770 | 1 854 | 4.7 | -2.7 | -48.2 | -65.7 |
Table 40.2. Road fatalities by road user group, United Kingdom
Figure 40.2. Road fatalities by road user group in percentage of total 2014, United Kingdom
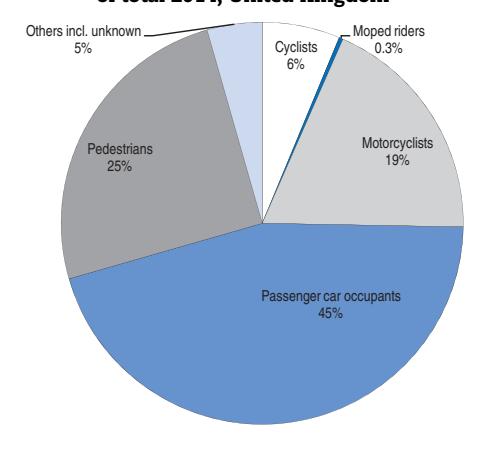
Road safety by age group
Since 1990, the reduction in fatalities has benefited all age groups, with the highest reduction for the youngest group (0-14), for which fatalities decreased from 394 in 1990, to 50 in 2014.
The elderly (over 65) have not benefited at the same rate as the average population from the improvement in road safety. They are particularly vulnerable as pedestrians. Nearly three-quarters of the increase in total fatalities across all user groups between 2013 and 2014 in Great Britain are of older (aged 60 or over) pedestrians. There are no obvious factors that would affect just people in this age group to such a significant degree. Although the proportion of the population aged 60 or older is increasing, this change is a gradual one, rather than a sudden one. This, therefore, is likely to lead to a gradual increase in casualties rather than step changes. It would also affect the injured casualty numbers as well, rather than mainly the fatality figures. The absence of a mechanism for such a change would indicate, therefore, that these changes have come about through chance or one-off events.
In 2014, the 18-20 group has the highest risk, with a fatality rate per 100 000 inhabitants twice that of the general population.
| 2014 % change from
Age
1990
2000
2010
2013
2014
2013
2010
2000
1990
0-5
123
41
16
13
11
-15.4
-31.3
-73.2
-91.1
6-9
108
41
14
7
16
128.6
14.3
-61.0
-85.2
10-14
163
89
12
21
23
9.5
91.7
-74.2
-85.9
15-17
335
169
93
48
38
-20.8
-59.1
-77.5
-88.7
18-20
558
342
206
153
148
-3.3
-28.2
-56.7
-73.5
21-24
616
304
156
195
187
-4.1
19.9
-38.5
-69.6
25-64
2 223
1 908
1 031
924
957
3.6
-7.2
-49.8
-57.0
65
1 241
679
377
409
474
15.9
25.7
-30.2
-61.8
Total
5 402
3 580
1 905
1 770
1 854
4.7
-2.7
-48.2
-65.7 | | | | | | |
|---------------------------------------------------------------------------------------------------------------------------------------------------------------------------------------------------------------------------------------------------------------------------------------------------------------------------------------------------------------------------------------------------------------------------------------------------------------------------------------------------------------------------------------------------------------------------------------------------------------------------------------------------------------------------------------------------------------------------------------------------------------------------------------------------------------------------------|--|--|--|--|--|--|
| | | | | | | |
| | | | | | | |
| | | | | | | |
| | | | | | | |
| | | | | | | |
| | | | | | | |
| | | | | | | |
| | | | | | | |
| | | | | | | |
| | | | | | | |
| | | | | | | |
Table 40.3. Road fatalities by age group, United Kingdom
Figure 40.3. Road fatality rates by age group Deaths per 100 000 inhabitants in a given age group, 1990-2014, United Kingdom
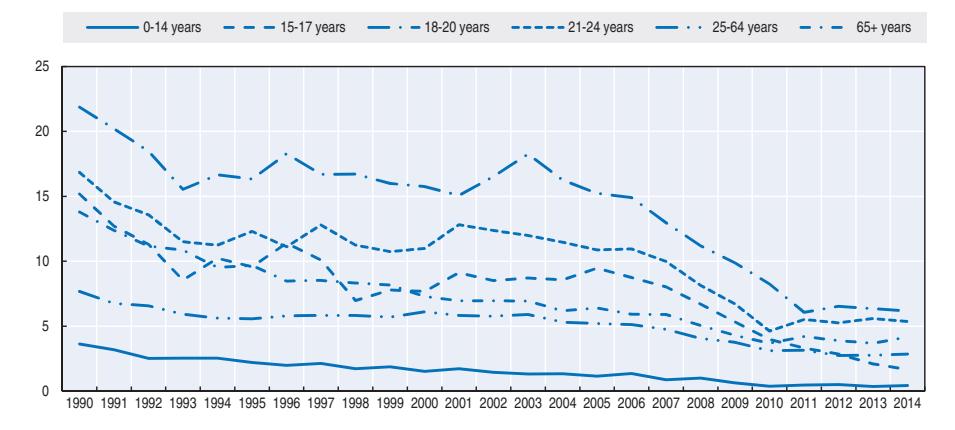
Road safety by road type
In 2014, most fatalities (61%) occurred on rural roads. This is considerably higher than the 42% of traffic on these roads. Traffic on urban roads usually travels at lower speeds; as a result injuries from collisions involving just cars, buses and goods vehicles tend to be less serious. The higher average speeds on rural roads more frequently results in more serious injuries and deaths. Since 1990, the largest improvement was made on urban roads, possibly as a result of improved secondary safety and highway engineering.
The number of people killed on urban roads increased in 2014. This ties in with the increase in pedestrian deaths in Great Britain as the majority of pedestrian fatalities and injuries happen on built-up roads.
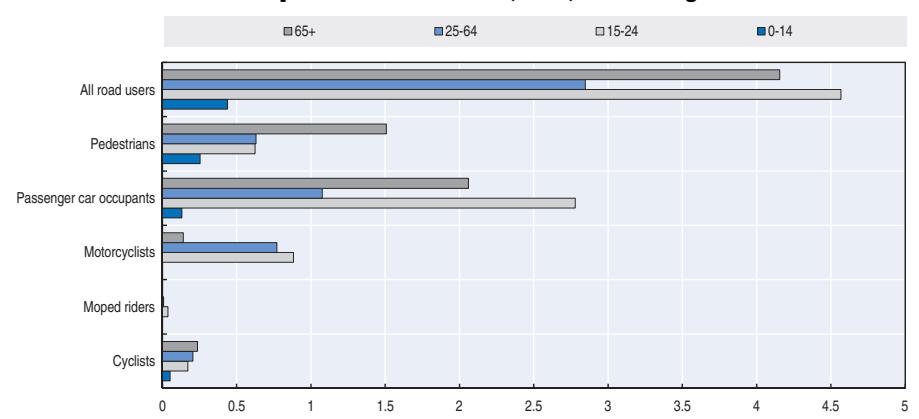
Figure 40.4. Road fatality rate by age and road user group Fatalities per 100 000 inhabitants, 2014, United Kingdom
Figure 40.5. Road fatalities by road type, United Kingdom
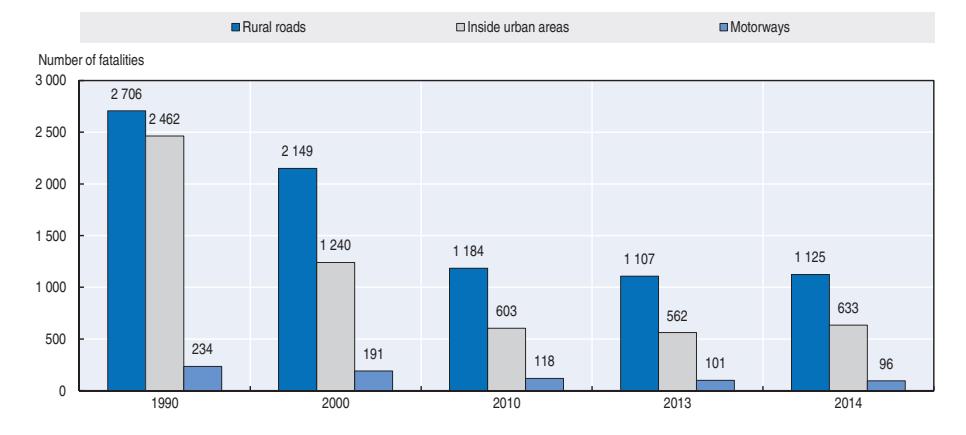
Economic costs of traffic crashes
The total value of reported road crashes in 2014 for Great Britain was estimated to be GBP 16.3 billion (EUR 20.5 billion) – this includes an estimate of the cost of damage-only crashes but does not allow for unreported injury crashes. This represents an increase of GBP 1.4 billion (EUR 1.7 billion) compared with the same estimate made in 2013 using market prices for 2014.
The total figure rises to around GBP 37.7 billion (EUR 47.5 billion) once injury crashes that have not been reported to the police are taken into account.
Table 40.4. Costs of road crashes, 2014 in Great Britain
| Unit cost | Total | |
|---|---|---|
| Fatalities | GBP 2.067 million | GPB 3 427 million |
| Hospitalised persons | GBP 0.236 million | GBP 4 875 million |
| Slight injuries | GBP 0.025 million | GPB 3 086 million |
| Damage-only crashes (including property damage, police costs, and insurance/administration costs) |
GBP 0.002 million | GBP 4 920 million |
| Total | GBP 16 307 million | |
| Total as % of GDP | 0.9% |
Recent trends in road user behaviour
Speed
Exceeding the speed limit was reported as a factor in 5% of all crashes in Great Britain in 2014. These crashes accounted for 17% of fatalities.
The table below summarises the main speed limits in the United Kingdom.
Table 40.5. Passenger car speed limits by road type, 2016
| General speed limit | Comments | |
|---|---|---|
| Urban roads | 30 mph | |
| Rural roads | Single carriageway: 60 mph | Dual carriageway : 70 mph |
| Motorways | 70 mph |
Drink driving
In England and Wales the maximum authorised blood alcohol content (BAC) is 0.8 g/l. In Scotland the maximum limit was reduced to 0.5 g/l in December 2014. Northern Ireland will lower the limit to 0.5 g/l from 2018.
For statistical purposes, a drink drive crash is defined as an incident on a public road in which someone is killed or injured and where at least one of the motor vehicle drivers or riders involved either refused to give a breath test specimen or one of the following:
- failed a roadside breath test by registering over 35 micrograms of alcohol per 100 millilitres of breath in England and Wales (or 22 micrograms of alcohol per 100 millilitres of breath in Scotland).
- died and was subsequently found to have more than the authorised BAC.
Drink drive casualties are defined as all road users killed or injured in a drink drive crash. In 2014, about 14% of all road deaths involved a driver with an illegal alcohol level.
Between 210 and 270 people were killed in accidents in Great Britain where at least 1 driver was over the drink drive limit, with a central estimate of 240 deaths. This is unchanged from 2013.
The number of seriously injured casualties in drink drive accidents in Great Britain decreased by 2% from 1 100 in 2013 to 1 080.The total number of casualties of all types in drink drive accidents is 8 220, down 1% on the 2013 figure. These will be the lowest totals on record if confirmed in the final estimates. The total number of drink drive accidents of all severities fell by 1% to 5 620 (DfT, 2015c).
In a survey on drink driving in England and Wales undertaken in 2014-15, around 6% of drivers said that they had driven at least once or twice within the previous 12 months when they thought they were over the legal alcohol limit (DfT, 2015). This proportion has remained broadly unchanged since 2012/13.
Drugs and driving
In 2014-15 in England and Wales, 0.9% of drivers said they had driven under the influence of illegal drugs at least once in the previous year. This is not significantly different from earlier years. Both drink and drug driving are more prevalent amongst males and younger drivers. More detailed results on self-reported drink and drug drinking are published at: www.gov.uk/government/statistics/reported-road-casualties-in-great-britainestimates-involving-illegal-alcohol-levels-2014 (accessed 30 April 2016).
The UK introduced new legislation on 2 March 2015 on driving with a specified controlled drug in the body above a specified limit. The previous legislation required the police to demonstrate that driving was impaired by drugs in order to prosecute.
For more information see: www.gov.uk/government/news/drug-drive-legislation-am-i-fitto-drive (accessed 30 April 2016).
This new legislation was supported by a campaign to inform the public of this change, with three key objectives:
- raise awareness of the new drug driving legislation and build knowledge and understanding of what it means for drivers
- increase awareness and salience of the consequences of a drug driving conviction
- increase the belief that drivers are likely to be caught and convicted if they drug drive.
The evaluation of this campaign is available at: www.gov.uk/government/publications/ think-drug-driving-evaluation-2015 (accessed 30 April 2016).
Distraction
Research demonstrates that reaction times for drivers using a hand-held phone are 30% worse than driving under the influence of alcohol at the legal limit. It is illegal to use a hand-held mobile phone or similar device while driving. There is an automatic fixed penalty if caught using a hand-held phone while driving or riding. Three penalty points on the licence and a fine of GBP 100 can be imposed. If the case goes to court, the maximum fine can be GBP 1 000 for a car and GBP 2 500 for a bus, coach or heavy goods vehicle.
A driver can also be prosecuted for using a hands-free phone or similar device if distracted and not in proper control of the vehicle. The same penalties apply. Employers can be prosecuted if employees are distracted because they are required to use mobile phones while driving.
In January 2016, the government held a consultation on increasing the penalties for using a hand-held mobile phone while driving. They will announce their decision later in 2016.
An observational survey held in 2014 in England and Scotland showed the proportion of drivers using hand-held mobile phones while driving was 1.6% overall: 1.4% for car drivers, 2.7% for van drivers, and 1.2% for truck drivers. Results are available at: www.gov.uk/ government/statistics/seatbelt-and-mobile-phone-use-surveys-2014 (accessed 30 April 2016). A follow-up survey will probably be undertaken in 2017 if the penalties are increased.
Sleepiness and fatigue
Research suggests that almost 20% of crashes on major roads are sleep-related. Sleeprelated crashes are more likely than others to result in a fatality or serious injury. Peak times for crashes are in the early hours and after lunch. About 40% of sleep-related crashes involve commercial vehicles. Men under 30 have the highest risk of falling asleep at the wheel. In Great Britain "fatigue" was assigned as a contributory factor in 3% of fatal injury crashes in 2014.
Seat belts and helmets
Seat belt use is compulsory for all seats:
- Front seat belt wearing regulations for drivers and passengers (both adult and children) came into force on 31 January 1983.
- Seat belt wearing regulations for children in rear seats came into force on 1 September 1989.
- Seat belt wearing regulations for adults in rear seats came into force on 1 July 1991.
The most recent survey of seat belt use, carried out in 2014, provided estimates that 98% of car drivers, 96% of front-seat passengers and 87% of rear-seat car occupants in England wore seat belts (Dft, 2015d). These rates are slightly higher than earlier in the decade. The Department for Transport is likely to repeat this survey in 2017.
Children are required to be restrained by a suitable combination of car seats and belts, depending on age. The level of children in restraints in the rear seat of cars fell from 96% in 2009 to 91% in 2014.
| % | ||
|---|---|---|
| 2009 | 2014 | |
| Driver | 95 | 97.9 |
| Front seat passenger | 95 | 96 |
| Rear seat passenger | 89 | 87.1 |
| Child rear seat passenger (aged < 14) | 96 | 90.7 |
| Adult rear seat passenger (aged 14 and over) | 79 | 81.1 |
Table 40.6. Seat belt wearing rate by car occupants: England
Results are available at: www.gov.uk/government/statistics/seatbelt-and-mobile-phone-usesurveys-2014 (accessed 30 April 2016)
Helmet wearing has been compulsory on motorcycles since 1973 and on mopeds (up to 50 cc, maximum speed 45 km/h) since 1977. A helmet is not compulsory on bicycles.
National road safety strategies and targets
Organisation of road safety
The Department for Transport sets overall road safety strategy in Great Britain. This includes decisions about road safety targets and legislating on key safety issues. Transport Scotland has certain powers in respect of road safety in Scotland, for example it can vary the drink driving limit; and the Welsh Assembly has set a Welsh road safety target. Local highway authorities are responsible for safety on their roads and can use engineering measures as well as local education campaigns to improve safety. Road safety in Northern Ireland is the responsibility of the Department of the Environment in Northern Ireland.
For latest information see: www.gov.uk/government/policies/road-safety (accessed 30 April 2016)
Road safety strategy 2015
The Department published a Road Safety Statement in December 2015. It provides a road safety strategy for the immediate future. The strategy sets out the context of road safety in Britain today and the overarching scope of road safety activity for the government. It will be followed by consultations on specific issues as options are developed. The statement covers road safety policy within Britain as governed by the Department for Transport (DfT). The governments and administrations of Scotland, Wales and Northern Ireland will seek to produce their own policies and strategic documents on devolved matters (DfT, 2015e).
For more information see: www.gov.uk/government/publications/road-safety-statementworking-together-to-build-a-safer-road-system (accessed 30 April 2016).
The key priorities for road safety include:
- Adopting the Safe System approach. This is clear in the framework set with Highways England and which it is now implementing. It is also a theme that runs throughout this statement.
- Protecting vulnerable road users, including pedestrians, cyclists, motor cyclists and horse riders, through infrastructure and vehicle improvements, promotion of safer behaviour and equipment and ensuring other road users are aware of the risks posed to these groups and adapt accordingly.
- Taking tough action against those who speed, exceed the drink-driving limit, take drugs or use their mobile phone while on the road.
- Ensuring that the driver testing and training regime prepares new drivers for a wide range of real life driving conditions and situations.
- Working with the insurance industry to incentivise safer behaviour and to reward the uptake of new technologies and opportunities to improve skills that are proven to reduce collisions.
- Helping employers to reduce road related collisions at work, including through improved heavy goods vehicle (HGV) safety.
- Encouraging the faster uptake of safer vehicles via the promotion of clear consumer information and the procurement of safer vehicles.
- Promoting the development and adoption of connected and autonomous vehicle technologies in a way that maximises safety benefits.
- Continuing the THINK! campaign to provide road user education and influence behaviour in a targeted and engaging way.
- Enabling the police to use modern enforcement technologies, while protecting the privacy of law-abiding people.
- Supporting Highways England and local authorities in improving the safety standards of the UK roads.
- Reviewing the nation's road safety management capacity, to identify opportunities for strengthening joint working, local innovation and efficiency.
Supporting further devolution of road safety policy, in a way that meets the needs of the nation as a whole.
Underpinning policy decisions with robust evidence, research and evaluation.
Working in partnership with public and private sector bodies and civil society organisations to save lives.
Recent safety measures (2014)
Protective equipment for motorcyclists
- Motorcyclist safety has been a longstanding priority for the Government's THINK! road safety campaign. Previous campaigns have included "THINK! BIKER", which encourages drivers to look out for bikes at junctions. THINK! also manage a THINK! BIKER Facebook channel, offering safety tips and extra training advice. This now has a following of over 77 000 motorcyclists.
- This year, THINK! are running a social media led motorcycle safety campaign encouraging riders to undertake further training, wear protective clothing and reduce their speed on rural roads. This is being complemented by wider social media activity, encouraging drivers to look out for bikes.
Education and awareness
- A new section offence of driving over specified limits for specified drugs came into force on 2 March 2015. See link for more information: www.gov.uk/government/news/drug-drivelegislation-am-i-fit-to-drive (accessed 30 April 2016).
- The Scottish Government reduced the drink driving blood alcohol content limit from 0.8 g/l to 0.5 g/l. The change came into force in December 2014. The limit in Northern Ireland will also be lowered to 0.5 g/l from 2018.
- DfT conducted a drug drive campaign in 2015. An evaluation study is available at: www.gov.uk/government/publications/think-drug-driving-evaluation-2015 (accessed 30 April 2016; see also section on drugs and driving).
Vehicles
● The car tax disc was abolished in 2014 after 93 years. This was a paper disc issued by the licensing authorities to show that vehicle excise duty had been paid for the vehicle. This has now been replaced by a purely electronic system.
Recent and ongoing research
Some research projects are presented below.
● "Modelling the impact of the weather on road casualty statistics". The study analyses the relationship between casualties and weather events such as rain or sub-zero temperatures. Further details see article in: www.gov.uk/government/statistics/reported-road-casualtiesgreat-britain-annual-report-2014 (accessed 30 April 2016).
References
Dft (2013), Strategic framework for road safety, www.gov.uk/government/publications/strategic-framework-forroad-safety.
Dft (2015a), Survey data on road accidents (RAS54), https://www.gov.uk/government/statistical-data-sets/ ras54-survey-data.
- Dft (2015b), Reported Road Casualties Great Britain 2014: Annual Report, Department for Transport, London, www.gov.uk/government/statistics/reported-road-casualties-great-britain-annual-report-2014.
- DfT (2015c), Reported road casualties in Great Britain, estimates involving illegal alcohol levels: 2014, Department for Transport, London, www.gov.uk/government/statistics/reported-road-casualties-ingreat-britain-estimates-involving-illegal-alcohol-levels-2014.
- DfT(2015d), Seatbelt and mobile phone use surveys: 2014, Department for Transport, London, www.gov.uk/ government/statistics/seatbelt-and-mobile-phone-use-surveys-2014.
- DfT (2015e), Working together to build a safer road system: British road safety statement, Department for Transport, London, www.gov.uk/government/publications/road-safety-statement-working-together-tobuild-a-safer-road-system.
- DfT (2016), Reported Road Casualties in Great Britain: quarterly provisional estimates year ending September 2015, Department for Transport, London, www.gov.uk/government/uploads/system/uploads/ attachment\_data/file/498157/quarterly-estimates-jul-to-sep-2015.pdf.
Websites
- UK Department for Transport Road Safety policy: www.gov.uk/government/policies/making-roads-safer.
- UK Department for Transport Road Safety Statistics: www.gov.uk/government/collections/road-accidentsand-safety-statistics.
- UK Road safety observatory: key facts and summaries of research on road safety topics: www.road safetyobservatory.com.
Chapter 41
United States
This chapter presents 2014 road safety data for the United States along with provisional data from 2015. It looks at trends in traffic and road safety from the years 1990 to 2014 and road user behaviour patterns. This includes data on speed, drink driving, drugs and driving, distracted driving, fatigue and seat belt usage. The chapter reviews the United States' road safety strategy and looks at recently implemented safety measures and research.*
* All data stem from the National Highway Traffic Safety Administration (NHTSA) and IRTAD unless otherwise noted. For more information please contact: terry.shelton@dot.gov.
The United States is a highly motorised country, reaching a high of 862 vehicles per 1 000 inhabitants in 2014. Vehicle miles travelled had also reached record levels by January 2016. In 2014, 32 675 people died in motor vehicle crashes in the United States, a 0.7% decrease over 2013. This equals a rate of 10.2 road fatalities per 100 000 inhabitants. All road user groups have benefitted from reductions in deaths, except pedestrians, who saw a 2.2% increase over 2013, continuing the increasing trend reported since 2009.
Road safety data collection
Definitions applied in the United States
- Road fatality: A fatality that occurs within 30 days of a crash involving a motor vehicle travelling on a traffic way customarily open to the public.
- Serious injuries: Incapacitating injuries, defined as severe lacerations, broken or distorted extremities, crush injuries, internal skull/chest/abdominal injuries, significant burns, unconsciousness and paralysis.
For general crash-related injury figures, the National Highway Traffic Safety Administration (NHTSA) does not differentiate between seriously and slightly-injured people. A crash is considered an injury crash if there were no fatalities, but someone involved in the crash – occupant or non-occupant – was reported as injured.
Data collection
State Police collect data on motor vehicle traffic crashes on specific roadways in each of the 50 states. Each state also has local police jurisdictions within counties, cities and towns that collect data on motor vehicle traffic crashes on the roadways not covered by the State Police.
The National Automotive Sampling System (NASS) consists of two sub-systems: the General Estimates System (GES) and the Crashworthiness Data System (CDS). Both subsystems are probabilistic surveys designed to produce national estimates on motor vehicle traffic crashes annually.
The CDS is a nationally representative sample of police-reported motor vehicle traffic crashes in which at least one light motor vehicle (automobile, automobile derivative, minivan, van, pickup truck, or sport utility vehicle) was towed from the crash scene as a result of the crash.
The GES is a nationally representative sample of all police-reported motor vehicle traffic crashes occurring across the United States, designed to produce national estimates on general characteristics of motor vehicle traffic crashes.
In particular, GES data are obtained through a sample selected from all police-reported motor vehicle crashes. Although various sources suggest that about half the motor vehicle crashes in the country are not reported to police, the majority of these unreported crashes involve only minor property damage and no significant personal injury. By restricting attention to police-reported crashes, the GES concentrates on crashes of the greatest concern to the highway safety community and the general public.
Approximately 90 data elements are coded into a common format. To protect individual privacy, no personal information (name, address, specific crash location) is coded.
Strengths of the system:
- Information is available on all types of motor vehicle traffic crashes and can aid policy makers in enhancing safety standards in motor vehicles.
- It is possible to produce national estimates on crash characteristics. Weaknesses:
- A police accident report may not be complete when it is obtained by the GES, therefore some of the information may not be available.
- Access to police accident reports is dependent on the co-operation of the police jurisdictions.
A challenge of collecting data at the federal level is obtaining and maintaining co-operation with state and local police jurisdictions.
Injuries coded in the Maximum Abbreviated Injury Scale at three or more (MAIS3+) are coded in the CDS, not the GES, and are defined as serious injuries.
Data Modernization Project
In 2012, United States Congress appropriated USD 25 million to NHTSA to modernise NASS. The project "DataMod" was launched in January 2012 for implementation in January 2016. The goal of DataMod is to affirm NHTSA's position as the leader in motor vehicle crash data collection and analysis, by collecting quality data to keep pace with emerging technologies and policy needs.
NASS was designed in the 1970s, and this 30-year old system needs to be updated to meet the data needs of the transport community that have increased and significantly changed over the last three decades. Congress was specific in their request and NHTSA is looking into the following items:
- expanding the current sample size
- expanding the scope of its data collection to possibly include large trucks, motorcycles, and pedestrians
- assessing the need for more data from the pre-crash, crash, and post-crash phases
- reviewing the crash data elements to be collected
- soliciting input from interested parties, including suppliers, automakers, safety advocates, the medical community and research organisations.
More information on the Data Modernization project can be obtained at: www.nhtsa.gov/Data/DataMod/DataMod.
Most recent safety data
Road crashes in 2015 – provisional data
A statistical projection of traffic fatalities for the first nine months of 2015 shows that an estimated 26 000 people died in motor vehicle traffic crashes. This represents an increase of about 9.3% as compared to the 23 796 fatalities that were reported to have occurred in the first nine months of 2014. The fatality rate for the first nine months of 2015 increased to 1.10 fatalities per 100 million vehicle miles travelled (VMT), up from 1.05 fatalities per 100 million VMT in the first nine months of 2014. The third quarter of 2015 represents the fourth consecutive quarter with year-to-year increases in fatalities as well as in the fatality rate.
Road crashes in 2014
In 2014, 32 675 people died in motor vehicle traffic crashes in the United States, a 0.7 percent decrease from the 32 894 fatalities in 2013. This decline shows a continuation in the general decline in fatalities that started in 2006, except for the slight increase in 2012. The estimated number of injured people, which has seen subtle fluctuation in recent years, experienced a slight (and not statistically significant) increase. In 2014, an estimated 2.34 million people were injured in motor vehicle traffic crashes.
Fatalities declined from 2013 to 2014 in almost all segments of the population, passenger vehicle occupants, large goods vehicle occupants, cyclists, young drivers, and in alcohol-impaired driving fatalities; only pedestrian fatalities increased by 2.2%.
To respond to the increase in motor vehicle crash fatalities, a Summit was held in March 2016 as a call to action for highway safety practitioners and all those who are interested in saving livings and stopping injuries and crashes. NHTSA is leading the charge with a new strategy on human choices: "Driving Behavioral Change in Traffic Safety." For more information see: www.nhtsa.gov/nhtsa/symposiums/march2016/index.html (accessed 10 May 2016).
Trends in traffic and road safety (1990-2014)
Traffic
Since 1990, the number of registered vehicles grew steadily reaching over 259 million in 2008. Even though the number of registered vehicles declined for the years 2009 and 2010, the number began rising again and the 275 million registered vehicles in 2014 has well surpassed the 2008 high. Vehicle ownership exceeds 860 vehicles per 1 000 inhabitants.
Between 1990 and 2007, VMT had grown at an annual average compound growth rate of about 1%. VMT declined in 2008 and reached in 2011, its lowest level since 2003. According to latest estimates from January 2016, VMT 2015 reached 3 131 billion miles, the highest level on record.
Road safety
Crashes and casualties
In the first decade of the 21st century, the United States averaged more than 40 000 deaths and more than 2 500 000 injuries on the roads each year. Road crashes generally are the leading cause of death for Americans aged 3 to 34. However, there has been some change with certain age groups from year to year more recently.
Between 1990 and 2014, the number of fatalities decreased by 27%, and most of the progress was achieved between 2006 and 2014. During the 1990s, there was little progress. Traffic fatalities have been declining steadily since reaching a near-term peak in 2005, and the reduction accelerated in 2008 and 2009. The magnitude of decline decreased in 2010 and 2011. In 2012, the US experienced the first increase in fatalities since 2005. In 2013 and 2014, the number of road deaths declined again, but was still above the low record achieved in 2011.
The reduction in fatalities in 2008-11 may be partly explained by a reduction in distance travelled as a consequence of the economic recession; but the overall decline in fatalities has been much greater than the reduction in traffic volume, indicating that recent safety measures promoted by the US Department of Transportation (DOT) have been effective.
Rates
The fatality rate per 100 million VMT fell to 1.08, the lowest since NHTSA began collecting fatality data through the Fatality Analysis Reporting System in 1975. In terms of population, the death rate in 2014 was 10.2 road fatalities per 100 000 inhabitants, a 1.4% decrease from 2013. Between 1990 and 2014, the death rate expressed in terms of deaths per 100 000 inhabitants, decreased by 43%, and the risk in terms of deaths per billion vehicle-kilometres declined by 48%.
| 2000 | 2014 | 2014 % change from | |||||||
|---|---|---|---|---|---|---|---|---|---|
| 1990 | 2010 2013 |
2013 | 2010 | 2000 | 1990 | ||||
| Reported safety data | |||||||||
| Fatalities | 44 599 | 41 945 | 32 999 | 32 894 | 32 675 | -0.7 | -1.0 | -22.1 | -26.7 |
| Injury crashes | 2 161 757 | 2 107 431 | 1 572 400 | 1 621 219 | 1 677 715 | 3.5 | 6.7 | -20.4 | -22.4 |
| Deaths per 100 000 inhabitants | 17.9 | 14.9 | 10.7 | 10.4 | 10.2 | -1.4 | -3.9 | -31.1 | -42.7 |
| Deaths per 10 000 registered vehicles | 2.4 | 1.9 | 1.3 | 1.2 | 1.2 | -2.7 | -7.3 | -38.5 | -50.9 |
| Deaths per billion vehicle kilometres | 12.9 | 9.5 | 6.9 | 6.8 | 6.7 | -1.9 | -2.9 | -29.3 | -48.1 |
| Traffic data | |||||||||
| Registered vehicles (thousands) | 184 275 | 217 028 | 257 312 | 269 294 | 274 805 | 2.0 | 6.8 | 26.6 | 49.1 |
| Vehicle kilometres (millions) | 3 451 016 | 4 420 747 | 4 775 352 | 4 809 170 | 4 869 321 | 1.3 | 2.0 | 10.1 | 41.1 |
| Registered vehicles per 1 000 inhabitants | 739 | 769 | 832 | 851 | 862 | 1.3 | 3.6 | 12.1 | 16.7 |
Table 41.1. Road safety and traffic data
1 2 http://dx.doi.org/10.1787/888933385717
Road safety by user group
Since 1990, all road users except motorcycle riders have benefited from the improvement in road safety. Motorcycle rider fatalities (including mopeds) increased by 41% between 1990 and 2014. However, in 2014 one notable decrease was the 2.3% decrease in the number of motorcyclists who lost their lives on the roads, 106 fewer motorcyclists. This was the second consecutive year with a decrease in motorcyclist fatalities and the first consecutive decrease since the mid-1990s.
The number of passenger vehicle (car and light truck) occupants who died in 2014 is the lowest on record. Deaths among passenger vehicle occupants had shown a slight increase in 2012, the first since 2002, but in 2014, the 1.0 percent decrease from 2013 continued the general downward trend in this category.
Pedestrian fatalities increased by 2.2% from 2013 to 2014. It is the highest number of deaths since 2005 and continues a general increase in pedestrian fatalities starting in 2009.
In 2015, NHTSA released a report that estimates that vehicle safety technologies have saved over 613 000 lives from 1960 to 2012. These technologies include seat belts, air bags and electronic stability control, along with numerous other advances (NHTSA, 2015).
20 40 80 100 120 140 160 180 200 1990 1991 1992 1993 1994 1995 1996 1997 1998 1999 2000 2001 2002 2003 2004 2005 2006 2007 2008 2009 2010 2011 2012 2013 2014 Fatalities Injury crashes Motor vehicles Veh-km GDP
Figure 41.1. Road safety, traffic and GDP trends index 1990 = 100
Source: World Bank for Gross Domestic Product (GDP; constant prices).
In 2014, passenger car occupants represented 36% of all fatalities, and motorcyclists 14%.
1990 2000 2010 2013 2014 2014 % change from 2013 2010 2000 1990 Cyclists 859 693 623 749 726 -3.1 16.5 4.8 -15.5 Moped users 76 29 113 176 172 -2.3 52.2 493.1 126.3 Motorcyclists 3 168 2 868 4 405 4 516 4 414 -2.3 0.2 53.9 39.3 Passenger car occupants 24 092 20 699 12 491 12 037 11 926 -0.9 -4.5 -42.4 -50.5 Pedestrians 6 482 4 763 4 302 4 779 4 884 2.2 13.5 2.5 -24.7 Others including SUVs 9 922 12 893 11 065 10 637 10 553 -0.8 -4.6 -18.1 6.4 Total 44 599 41 945 32 999 32 894 32 675 -0.7 -1.0 -22.1 -26.7
Table 41.2. Road fatalities by road user group
Figure 41.2. Road fatalities by road user group in percentage of total 2014
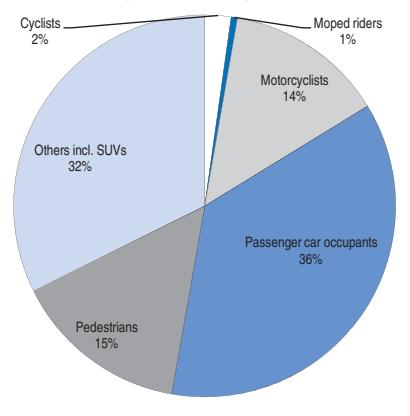
Road safety by age group
Since 1990, safety improvements have benefited all age groups, but the improvement was more marked for young people up to the age 20 than for older age groups. The Department of Transportation has been working diligently to address the safety risk of young drivers. This group, lacking experience that is acquired only over time, often poses a greater safety risk on the road. However, over the years, with the attention to young drivers and the introduction of graduated driver licensing, fatalities associated with young drivers have decreased. In 2005, there were 8 053 fatalities associated with young driver (16-20 years old) crashes as compared to 4 179 fatalities in young driver crashes in 2014.
| 2010 2013 2014 |
2014 % change from | ||||||||
|---|---|---|---|---|---|---|---|---|---|
| Age | 1990 | 2000 | 2013 | 2010 | 2000 | 1990 | |||
| 0-5 | 1 101 | 858 | 471 | 468 | 427 | -8.8 | -9.3 | -50.2 | -61.2 |
| 6-9 | 752 | 579 | 285 | 269 | 263 | -2.2 | -7.7 | -54.6 | -65.0 |
| 10-14 | 1 025 | 926 | 455 | 415 | 380 | -8.4 | -16.5 | -59.0 | -62.9 |
| 15-17 | 2 744 | 2 467 | 1 216 | 931 | 983 | 5.6 | -19.2 | -60.2 | -64.2 |
| 18-20 | 4 564 | 3 967 | 2 449 | 2 220 | 2 197 | -1.0 | -10.3 | -44.6 | -51.9 |
| 21-24 | 5 049 | 4 061 | 3 340 | 3 331 | 3 292 | -1.2 | -1.4 | -18.9 | -34.8 |
| 25-64 | 22 812 | 22 267 | 19 213 | 19 489 | 19 337 | -0.8 | 0.6 | -13.2 | -15.2 |
| 65 | 6 427 | 6 701 | 5 524 | 5 716 | 5 709 | -0.1 | 3.3 | -14.8 | -11.2 |
| Total | 44 599 | 41 945 | 32 999 | 32 894 | 32 675 | -0.7 | -1.0 | -22.1 | -26.7 |
Table 41.3. Road fatalities by age group

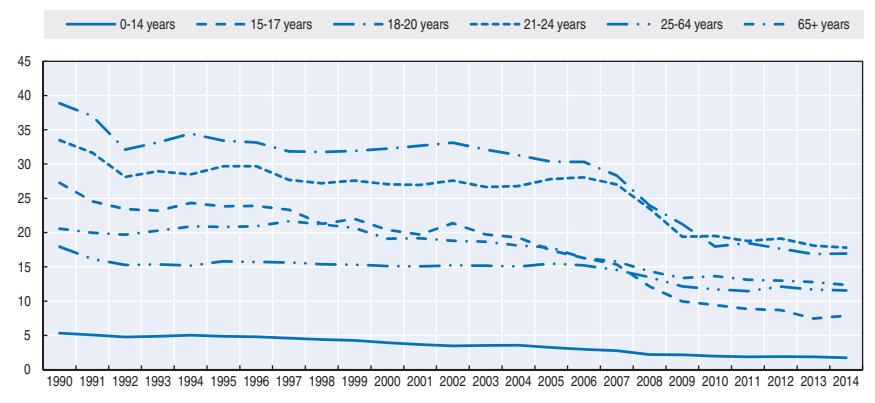
Road safety by road type
In 2014, less than half of fatalities occurred on rural roads. The number of fatalities on rural roads decreased from 15 642 in 2013 to 14 781 in 2014. There were 4 084 fatalities on motorways in the United States in 2014. This percentage has not changed from 2013 (12%).
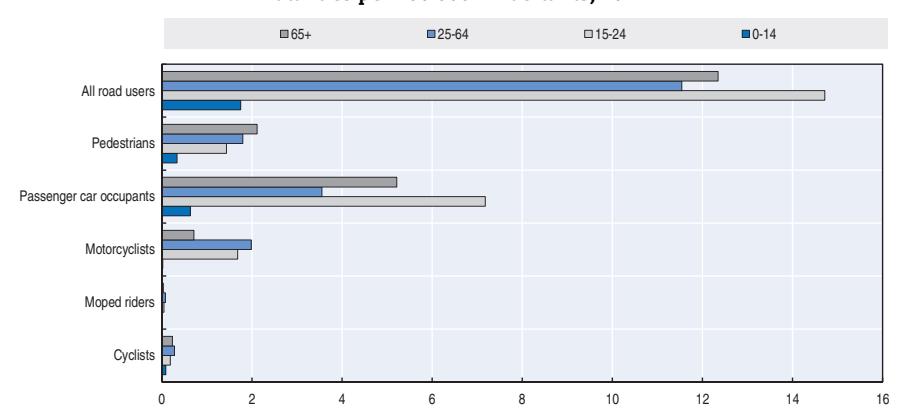
Figure 41.4. Road fatality rate by age and road user group Fatalities per 100 000 inhabitants, 2014
Figure 41.5. Road fatalities by road type
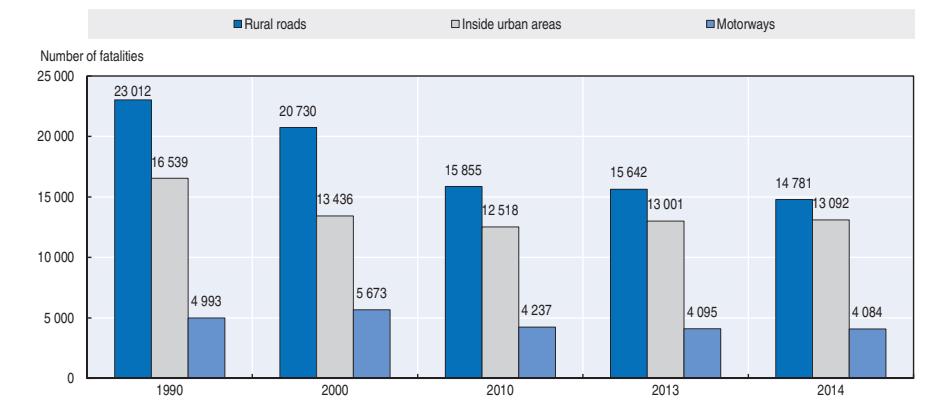
Economic costs of traffic crashes
Based on a recent study published in 2014 (NHTSA, 2014), the economic costs of traffic crashes totalled USD 242 billion in 2010, representing 1.6% of the GDP of the United States. This represents the value of lifetime economic costs for 32 999 fatalities, 3.9 million non-fatal injuries, and 24 million damaged vehicles. This figure includes both police-reported and unreported crashes. When quality of life valuations are considered, the total value of societal harm from motor vehicle crashes in 2010 was USD 836 billion, nearly 6% of GDP.
Cost components include productivity losses, property damage, medical costs, rehabilitation costs, congestion costs, legal and court costs, emergency services such as medical, police, and fire services, insurance administration costs, and costs to employers.
Type of crashes Economic cost Comprehensive cost Total USD 242.0 billion USD 835.8 billion Alcohol impaired USD 44.0 billion USD 201.1 billion Speeding USD 52.0 billion USD203.2 billion Motorcycle crashes USD12.9 billion USD 65.7 billion Helmet non-use USD 1.2 billion USD \$7.6 billion Seat belt non-use USD 10.4 billion USD 68.6 billion Pedestrian crashes USD 11.5 billion USD 65.0 billion
Cyclist crashes USD 4.4 billion USD 21.7 billion
Table 41.4. Costs of road crashes, 2010
Recent trends in road user behaviour
Speed
NHTSA considers a crash to be speeding-related if the driver was charged with a speeding-related offense, or if an officer indicated that racing, driving too fast for conditions, or exceeding the posted speed limit was a contributing factor in the crash.
Speeding is one of the most prevalent factors contributing to traffic crashes. In 2014, speed was a contributing factor in 28% of all fatal crashes, and 9 262 lives were lost in speeding-related crashes. Speeding-related fatalities decreased by 4% from 9 613 in 2013.
Speed limits in the United States are set by each state. The table below summarises speed limit ranges in the United States.
| | General speed limit | Comments | | |
|-------------|---------------------|-----------------------------------------------------------------------------------------------------|--|--|
| Urban roads | 25 mph | Speed limits depend on the use of the road and
the size of the road as well as state discretion. | | |
| Rural roads | 25-55 mph | | | |
| Motorways | 55-80 mph | | | |
Table 41.5. Passenger car speed limits by road type, 2016
Drink driving
All 50 states, the District of Columbia and Puerto Rico have enacted 0.8 g/l BAC laws that make it a criminal offence to drive with that level of alcohol. All 50 states have enacted zero tolerance laws (primarily laws at 0.2 g/l or lower) that make it illegal for drivers under age 21 to have any detectable alcohol in their bodies.
Alcohol-impaired driving fatalities decreased by 1.4% from 2013 to 2014, accounting for 31% of 2014 overall fatalities. Alcohol-impaired driving fatalities have accounted for 30-32% of all crash fatalities since 1995. An alcohol-impaired driving fatality is defined as a fatality in a crash involving a driver or motorcycle rider (operator) with a BAC of .08 g/dl or greater. Heavy goods vehicle drivers showed the greatest decrease in the percent of alcohol-impaired drivers involved in fatal crashes from 2013 to 2014. Alcohol-impaired drivers of light commercial vehicles and motorcycles also increased. There were 24% of alcohol-impaired drivers involved in fatal crashes in 2014 who had had a previous license suspension or revocation (within just the last 3 years, for both alcohol-related and nonalcohol-related offenses).
Drugs and driving
There is no federal law regarding driving under the influence of drugs. Drug laws are generally written to forbid driving with certain drugs in the system. However, not all states have drug laws. Given the differences in state collection and reporting of drug data, and the large amounts of missing data, NHTSA's data on drugs and crashes should be considered with care. Of those drivers involved in fatal crashes in 2014 (44 583 drivers), 39% were tested for drugs and of those, 36% were reported as having drugs in their system at the time of the fatal crash.
Distraction
Distracted driving laws focus on the use of mobile electronic devices while driving. Each state sets its own laws regarding distracted driving. As of April 2015, 14 states and the District of Columbia prohibit drivers from using hand-held mobile phones while driving. In 38 states and the District of Columbia, all mobile phone use is banned for novice drivers, and 45 states and the District of Columbia ban text messaging for all drivers.
In 2014, 3 179 people were killed on US roadways and an estimated 431 000 were injured in motor vehicle crashes that were reported to have involved distracted driving, amounting to 10% of all crash fatalities and 18% of injury crashes. The distraction involved in fatal cases was a mobile phone 13% of the time (404 deaths), and for injuries the mobile phone was the distraction 8% of the time (33 000 injured).
Sleepiness and fatigue
For NHTSA, drowsy driving crashes are those in which the driver was reported, on official crash documents, as drowsy, sleepy, asleep or fatigued. NHTSA recognises the difficulty in collecting data regarding fatigue in crashes and offers these figures as the only known crash data regarding fatigue.
In 2014, 846 people lost their lives in crashes in which a driver was reported as drowsy at the time of the crash. This represents 2.6% of the fatalities in the year. This proportion has remained relatively consistent over time. In addition to those killed, an estimated 45 000 people were injured in crashes involving a drowsy driver in 2014. A total of 87 000 police-reported crashes throughout the year were estimated to be considered drowsy driving crashes.
Seat belts and helmets
Seat belt laws are divided into two categories: primary and secondary. Primary seat belt laws allow law enforcement officers to ticket a driver or passenger for not wearing a seat belt, without any other traffic offense taking place. Secondary seat belt laws state that law enforcement officers may issue a ticket for not wearing a seat belt only when there is another citable traffic infraction. As of April 2016, the seat belt law situation was as follow:
- 34 states, the District of Columbia, American Samoa, Guam, the Northern Mariana Islands, Puerto Rico and the Virgin Islands have primary seat belt laws for front seat occupants.
- 15 states have secondary laws. In many of these states, the law is primary for younger drivers and/or passengers.
- New Hampshire has enacted neither a primary nor a secondary seat belt law for adults, although the state does have a primary child passenger safety law that covers all drivers and passengers under 18.
● Rear seats: 28 states, D.C., Guam and the Northern Mariana Islands, have laws requiring belt use for all rear seat passengers. In 17 of these states, D.C., Guam and the Northern Mariana Islands, the law is primary.
Child passenger restraint laws vary based on age, weight and height. Most laws use restrictions in stages, starting with infants in rear facing seats, moving to toddlers in forward facing child seats, and then older children using booster seats until they reach a size or age for using an adult belt. All 50 states and the District of Columbia require child safety seats for infants and children fitting specific criteria, and all but two states require booster seats or other appropriate devices for children who have outgrown a child safety seat but are still too small to use an adult seat belt safely.
In 2015 seat belt use reached 88.5%. Seat belt use has been increasing since 1995, accompanied by a steady decline in the percentage of unrestrained fatalities during daytime. Seat belt use continued to be higher in the states in which vehicle occupants can be pulled over solely for not using seat belts (NHTSA, 2016b).
| % | ||||
|---|---|---|---|---|
| 2000 | 2010 | 2014 | 2015 | |
| Front seat | ||||
| General (driver + passengers) | 71 | 85 | 87 | 88.5 |
| Driver | 72 | 86 | 87 | 89.0 |
| Passenger | 68 | 83 | 85 | 86.8 |
| Urban roads (driver + passengers) | 72 | 81 | 86 | 89.4 |
| Rural roads (driver + passengers) | 68 | 83 | 83 | 86.8 |
| Motorways (driver + passengers) | n/a | 91 | 90 | 91.4 |
| Rear seats | ||||
| eneral | n/a | 74 | 73 | n/a |
| Children (use of child restraint < 8 years old) | n/a | 89 | 91 | n/a |
Table 41.6. Seat belt wearing rate by car occupancy and road type
Currently, about half the states require helmets for all motorcyclists. Most other states require helmets for certain riders, and a few have no helmet law. The Global Health Security Agenda (GHSA) urges all states to adopt a universal motorcycle helmet law and vigorously enforce existing laws. As of April 2016, the situation regarding motorcycle helmet law was as follow:
- 47 states, the District of Columbia, Guam, the Northern Mariana Islands, Puerto Rico and the U.S. Virgin Islands have a helmet law for motorcyclists.
- ❖ 19 states, the District of Columbia, the Northern Mariana Islands, Puerto Rico and the U.S. Virgin Islands have a universal helmet law, requiring helmets for all riders.
- ❖ The remaining 28 states and Guam require helmets for specific riders.
- 3 states (Illinois, Iowa and New Hampshire) do not have a motorcycle helmet law.
In 2014, the average wearing rate of a DOT-compliant motorcycle helmet meeting DOT safety standard FMVSS218 was 64%. Use of non-compliant helmets was 5% and 31% had no helmet. Among states with universal helmet laws, 89% were wearing DOT-compliant helmets with an additional 7% wearing non-DOT-compliant helmets. In states without universal helmet laws, 48% were wearing DOT-compliant helmets and an additional 3% were wearing non-compliant helmets.
National road safety strategies and targets
Organisation of road safety
The United States uses a "federalism" approach that divides the powers of government between the national (federal) government and state and local governments. Under federalism, each level of government has sovereignty in some areas and shares powers in others. At the national level, Congress passes the laws and assigns the funding that provides the overall structure for the DOT to carry out its safety mission. However, most traffic safety laws and policies are enacted and developed at the state level. For example, each of the 50 states has the authority to set its own speed limits, distracted driving rules, or seat belt use law.
Congress can influence the states by providing incentive grants if they enact certain laws that have been proven effective or penalties if they do not. It can also use performance results as eligibility criteria for grants in some cases. The DOT implements the grant programmes and provides guidance to the states on developing effective strategies that address their particular traffic safety challenges.
Within DOT, NHTSA has the lead role in reducing traffic crashes and fatalities.
In 2010, the DOT designated reducing roadway fatalities as one of its high-priority performance goals. Three agencies, the NHTSA, the Federal Highway Administration (FHWA), and the Federal Motor Carrier Safety Administration (FMCSA), work together to address multiple dimensions of roadway safety.
Road safety strategy for 2011-20
The number one priority of the DOT remains safety.
To align the programme and policy actions, the DOT has established four fatality sub measures: passenger vehicles, non-occupants, motorcycle riders, and heavy goods vehicle or bus related fatalities. The purpose of this approach is to more closely examine fatality rates of the different segments of highway users, focus the energy and resources involved and develop new strategies to reduce fatalities in each of the four areas.
Road safety targets
The DOT currently has performance targets to 2016 for the overall fatality rate and NHTSA and FMCSA have performance targets for each of the four sub measures. For 2016, DOT's overall motor vehicle crash fatality rate target is 1.02 fatalities per 100 million VMT. The sub measure targets for 2016 are 0.15 fatalities per 100 million VMT for the non-occupant fatality rate, 62 fatalities per 100 000 registrations for the motorcyclist fatality rate, 0.82 fatalities per 100 million VMT for the passenger vehicle fatality rate, and the large vehicle and bus fatality rate for 2016 is 0.114 fatalities per 100 million VMT.
The fatality rates are forecast through statistical methods for a number of years into the future in order to guide a plan of action for safety countermeasures. These forecasts use historical data combined with an evaluation of the existing countermeasures, trend data, and other societal factors that may affect fatality rates in the future.
Monitoring targets
The fatality rate per 100 million VMT decreased 1.8 % from 1.10 in 2013 to 1.08 in 2014. This fatality rate is the lowest fatality rate on record, but the performance target for the year was 1.02 and thus DOT did not meet the target.
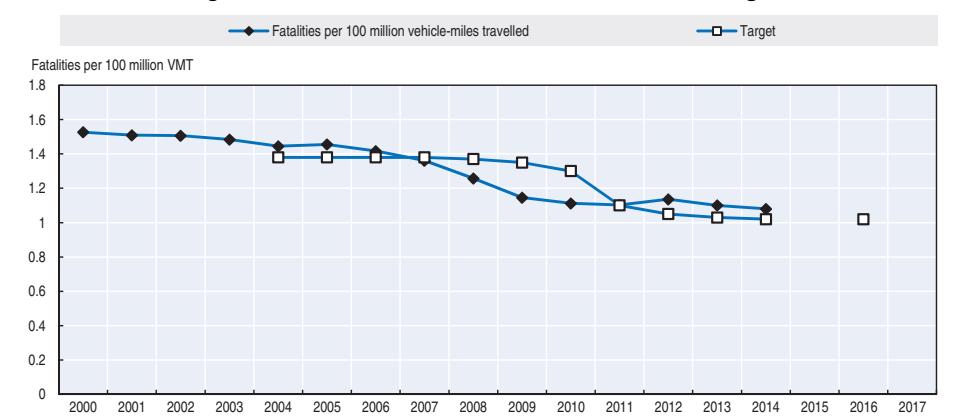
Figure 41.6. Trends in road fatalities towards national target
Recent safety measures (2013-16)
Road safety management
- The USDOT has pledged up to USD 40 million to one city to help it define what it means to be a "Smart City" and become the country's first city to fully integrate innovative technologies – self-driving cars, connected vehicles, and smart sensors – into their transportation network. See more at: www.transportation.gov/smartcity (accessed on 10 May 2016).
- The USDOT has launched the Department's Safer People, Safer Streets Initiative. Over the course of the next year and a half, the Department will be doing more to address non-motorised safety issues and help communities create safer, better connected cycling and walking networks. See more at: www.transportation.gov/safer-people-saferstreets (accessed 10 May 2016).
Road users
Driver Medical Fitness for Duty
● Commercial motor vehicle (CMV) drivers undergo a physical examination to confirm they are healthy enough to safely perform the demanding job of a CMV driver. See more at: www.fmcsa.dot.gov/medical/driver-medical-requirements/driver-medical-fitness-duty.
Vehicles
● NHTSA and the Insurance Institute for Highway Safety (IIHS) announced on 17 March 2016 a historic commitment by 20 car manufacturers representing more than 99% of the US car market to make automatic emergency braking (AEB) a standard feature on virtually all new cars no later than 2022. NHTSA estimates that the agreement will make AEB standard on new cars three years faster than could be achieved through the formal regulatory process. During those three years, according to IIHS estimates, the commitment will prevent 28 000 crashes and 12 000 injuries. For more information see: www.nhtsa.gov/ About+NHTSA/Press+Releases/nhtsa-iihs-commitment-on-aeb-03172016 (accessed 10 May 2016).
- The focus of NHTSA's research on advanced technologies is to evaluate potential benefits of new and existing in-vehicle technologies. This research supports Federal Motor Vehicle Safety Standards and safety defects investigations, advances knowledge about driver behaviour, and assists in the development of new vehicle technologies. The advanced technologies that are the subject of NHTSA's research programme can be grouped into two categories: vehicle-based systems, such as radar-based collision warning systems; and cooperative vehicle safety systems that use vehicle-to-vehicle communication systems.
- Increased use of electronic controls and connectivity is enhancing transportation safety and efficiency. These new technologies may result in new failure mechanisms and cyber vulnerability that are emerging challenges for auto safety. NHTSA recognised these new challenges by adding electronic systems safety as a new area of vehicle safety research."
Roadway and Infrastructure
USDOT's Federal Highway Administration has several programmes to address safety on different road types as well as intersection, pedestrian and cyclist safety. Some of the programmes are:
- Highway Safety Improvement Program: http://safety.fhwa.dot.gov/hsip/.
- Intersection Safety: http://safety.fhwa.dot.gov/intersection/.
- Roadway Departure Safety: http://safety.fhwa.dot.gov/roadway\_dept/.
- Pedestrian and Bicycle Safety: http://safety.fhwa.dot.gov/ped\_bike/.
- Local and Rural Road Safety Program: http://safety.fhwa.dot.gov/local\_rural/.
References
NHTSA (2016a), 2014 Motor Vehicle Crashes: Overview, NHTSA, Washington, DC, www-nrd.nhtsa.dot.gov/ Pubs/812246.pdf.
NHTSA (2016b), Seat Belt Use in 2015 – Overall Results, NHTSA, Washington, DC, www-nrd.nhtsa.dot.gov/ Pubs/812243.pdf.
NHTSA (2014), The Economic and Societal Impact of Motor Vehicle Crashes, 2010, NHTSA, Washington, DC, .
NHTSA (2015), Lives saved by vehicle safety and associated Federal Motor Vehicle Safety Standards, 1960 to 2012, Department of Transportation, Washington, DC, www-nrd.nhtsa.dot.gov/Pubs/ 812069.pdf.
Websites
- National Highway Traffic Safety Administration: www.nhtsa.gov.
- NHTSA Office of Vehicle Safety Research: www.nhtsa.gov/Research.
List of members and observers
Chair: Mr Fred Wegman (Netherlands)
| Argentina | National Road Safety Agency (ANSV) | Ms Veronica HELER Ms Eugenia KELLER |
|---|---|---|
| Australia | Department of Infrastructure and Regional Development | Mr Tim RISBEY Ms Katrina CRISTOFANI |
| ARRB | Mr Blair TURNER | |
| Austria | Kuratorium für Verkehrssicherheit (KFV) | Mr Robert BAUER Mr Klaus MACHATA |
| Austrian Institute of Technology (AIT) | Mr Peter SALEH | |
| Belgium | Belgian Road Safety Institute (BIVV – IBSR) | Ms Nathalie FOCANT Mr Jean Francois GAILLET Ms Heike MARTENSEN Mr Wouter VAN DEN BERGHE |
| Cambodia | National Road Safety Committee | Mr Sattya BORAN Mr Voun CHHOUN Mr Davann YUN |
| Canada | Transport Canada | Ms Kim BENJAMIN Ms Marie-Josée GOULET Mr Michael MARTH |
| Chile | Comisión Nacional de Seguridad de Tránsito (CONASET) | Ms Andrea DIAZ Ms Carla MEDINA ARAOS |
| Czech Republic | CDV – Transport Research Centre | Mr Jan TECL |
| Denmark | Road Directorate Danish National Police University of Alborg Danish Technical University (DTU) |
Mr Stig HEMDORFF Ms Tove HELS Ms Camilla SLOTH ANDERSEN Ms Mette MOLLER |
| Finland | Finnish Transport Safety Agency (TraFi) | Ms Riikka RAJAMÄKI |
| France | Observatoire National Interministériel pour la Sécurité Routière | Ms Camille PAINBLANC Ms Manuelle SALATHE |
| IFSTTAR | Ms Ruth BERGEL-HAYAT Mr Sylvain LASSARRE Mr Jean-Louis MARTIN |
|
| Germany | Bundesanstalt für Straßenwesen (BASt) | Mr Andreas SCHEPERS Ms Susanne SCHOENEBECK |
| German Road Safety Council | Ms Jacqueline LACROIX | |
| Gesamtverband der Deutschen Versicherungswirtschaft e.V. (GDV) ADAC |
Mr Jean Emmanuel BAKABA Mr Wolfgang STEICHELE |
|
| Greece | National Technical University of Athens (NTUA) | Mr George YANNIS |
| Hungary | KTI – Institute for Transport Science | Mr Peter HOLLO Ms Viktoria TOTH |
| Iceland | Icelandic Road and Coastal Administration | Ms Audur Thora ARNADOTTIR |
| Ireland | Road Safety Authority | Ms Velma BURNS Ms Sharon HEFFERNAN |
| Israel | National Road Safety Authority | Ms Rachel GOLDWAG |
| Italy | University La Sapienza | Mr Luca PERSIA Mr Davide Shingo USAMI |
| Automobile Club d'Italia (ACI) | Ms Lucia PENNISI |
| Jamaica | Ministry of Transport, Works and Housing | Mr Kenute HARE |
|---|---|---|
| Japan | National Police Agency | Mr Kazunori FUJIMAKI Ms Misaki TOKIO |
| National Research Institute of Police Science (NRIPS) | Mr Goro FUJITA Mr Kenji HAGITA Ms Kazuko OKAMURA |
|
| Institute for Traffic Accident Research and Data Analysis (ITARDA) | Ms Satoko ITO | |
| Kansai University | Mr Mitsuhiro YAMAMOTO | |
| Korea | Korean Road Traffic Authority (KoROAD) | Ms Hyoung Eun CHO Mr Sung Cheul JANG Mr Daegon HWANG |
| Korean Transportation Safety Authority (TS) | Mr Byongho CHOE Mr Yoon Seok JEE Mr Sungjin JO |
|
| Korea Expressway Corporation | Mr Sun Woong MIN | |
| Lithuania | Transport and Road Research Institute | Mr Mindaugas KATKUS |
| Luxembourg | STATEC | Ms Marie Jo AIROLDI |
| Malaysia | Malaysian Institute of Road Safety Research (MIROS) | Ms Sharifah Allyana SYED RAHIM Mr Shaw Voon WONG |
| Mexico | Mexican Transportation Institute | Mr Alberto MENDOZA |
| Morocco | Comité National de Prévention des Accidents de la Circulation (CNPAC) | Mr Ahmed BARDAN Mr Benacer BOULAAJOUL |
| Netherlands | Ministry of Infrastructure and the Environment | Mr Peter MAK |
| SWOV Institute for Road Safety Research | Mr Niels BOS Mr Fred WEGMAN |
|
| New Zealand | Ministry of Transport | Mr Wayne JONES |
| Nigeria | Federal Road Safety Corps | Ms Ojeme Igbireh EWHRUDJAKAPOR Mr Kayode OLAGUNJU Mr Boboye OYEYEMI |
| Norway | Norwegian Public Roads Administration | Ms Guro RANES Ms Marianne Stølan ROSTOFT |
| Poland | Motor Transport Institute2 National Road Safety Council |
Ms Justyna WACOWSKA-SLEZAK Mr Konrad ROMIK |
| Portugal | Autoridade Nacional SegurancaRodoviara APEC Associação portuguesa escolas condução |
Mr Helder BATISTA Mr. Silva ILIDIO |
| Serbia | Road Traffic Safety Agency | Mr Dragoslav KUKIC Ms Andrijana PEŠI? Mr Jovica VASILJEVI? |
| Slovenia | Slovenian Traffic Safety Agency | Mr Andraz MURKOVIC |
| South Africa | Road Traffic Management Corporation | Ms Magadi GAINEWE Ms Juma MOTSELISI |
| Spain | Dirección General de Tráfico (DGT) | Mr Gerard AZOR MARTINEZ Ms Rosa RAMÍREZ FERNÁ;NDEZ |
| RACC Automóvil Club | Mr Miquel NADAL | |
| Sweden | Swedish Transport Agency | Ms Karin BENGTSSON Mr Hans-Yngve BERG |
| Swedish Transport Administration VTI |
Ms Ylva BERG Ms Anna VADEBY |
|
| Chalmers University of Technology | Ms Helen FAGERLIND | |
| Switzerland | Federal Roads Office (ASTRA) | Mr Philippe BAPST |
| Swiss Council for Accident Prevention (bfu) | Mr Steffen NIEMANN | |
| United Kingdom | Department for Transport | Mr Anil BHAGAT Mr Daryl LLOYD |
| Transport Research Laboratory (TRL) | Mr John FLETCHER | |
| United States | National Highway Traffic Safety Administration (NHTSA) | Ms Terry SHELTON Mr Umesh SHANKAR |
| University of Michigan | Ms Carol FLANNAGAN | |
| Harvard University | Ms Lidia UZIEL |
| European Commission | DG MOVE | Ms Maria Teresa SANZ VILLEGAS |
|---|---|---|
| OISEVI | The Ibero American Road Safety Observatory | Ms Corina PUPPO |
| The World Bank | Global Road Safety Facility | Ms Véronica RAFFO |
| Mr Marc SHOTTEN |
Industry and international non-governmental organisations
| ACEA - European Automobile Manufacturers Association | Mr Gianfranco BURZIO |
|---|---|
| ACEM – European Motorcycle Manufacturers Association | Ms Veneta VASSILEVA |
| Daimler AG | Mr Jorg BAKKER |
| DEKRA Automobile | Mr Walter NIEWOEHNER |
| European Transport Safety Council (ETSC) | Ms Graziella JOST Ms Dovile ADMINAITE |
| FIA | Mr Luca PASCOTTO |
| FIA Foundation for the automobile and society | Ms Rita CUYPERS |
| Ford | Mr Roland SCHAEFER |
| IMMA - International Motorcycle Manufacturer's Association | Mr Edwin BASTIAENSEN |
| Global NCAP | Mr David WARD |
| Nissan Motor Manufacturing | Mr Andrzej CHMURA |
| LAB PSA-Renault | Mr Yves PAGE Mr Nicolas BERTHELON |
| Robert Bosch Gmbh | Mr Thomas LICH |
| Together for Safer Roads Coalition | Ms Laura VALLIS |
| Volkswagen AG | Ms Stefanie ACHMUS Mr Jörn Marten WILLE |
The following national institutes also provide information and data to IRTAD:
| Israel | Central Bureau of Statistics | Ms Tehila KLEIN Mrs. Orit YALON-SHUQRUN |
|---|---|---|
| Finland | Statistics Finland | Ms Marie NIEMI |
| France | CEREMA | Mr Gilles DUCHAMP Ms Rose-Marie SIBEL |
| Greece | EL.STAT. | Ms Effrosyni CHANTSOULI |
| Iceland | Icelandic Transport Authority (ICETRA) | Mr Gunnar Geir GUNNARSSON |
| Italy | ISTAT | Ms Silvia BRUZZONE |
ITFOECD/IRTAD Secretariat
Ms Véronique FEYPELL-DE LA BEAUMELLE Mr Stephen PERKINS
Ms Rachele POGGI
Ms Susanne REICHWEIN
Ms Elene SHATBERASHVILI
Ms Lorna WILSON
ORGANISATION FOR ECONOMIC CO-OPERATION AND DEVELOPMENT
The OECD is a unique forum where governments work together to address the economic, social and environmental challenges of globalisation. The OECD is also at the forefront of efforts to understand and to help governments respond to new developments and concerns, such as corporate governance, the information economy and the challenges of an ageing population. The Organisation provides a setting where governments can compare policy experiences, seek answers to common problems, identify good practice and work to co-ordinate domestic and international policies.
The OECD member countries are: Australia, Austria, Belgium, Canada, Chile, the Czech Republic, Denmark, Estonia, Finland, France, Germany, Greece, Hungary, Iceland, Ireland, Israel, Italy, Japan, Korea, Luxembourg, Mexico, the Netherlands, New Zealand, Norway, Poland, Portugal, the Slovak Republic, Slovenia, Spain, Sweden, Switzerland, Turkey, the United Kingdom and the United States. The European Union takes part in the work of the OECD.
OECD Publishing disseminates widely the results of the Organisation's statistics gathering and research on economic, social and environmental issues, as well as the conventions, guidelines and standards agreed by its members.
Road Safety Annual Report 2016
The IRTAD Road Safety Annual Report 2016 provides an overview of road safety performance for 2014 in 40 countries, with preliminary data for 2015, and detailed reports for each country. It includes tables with cross country comparisons on key safety indicators.
The report outlines the most recent safety data in IRTAD countries, including detailed analysis by road user, age group and type of road. It describes the crash data collection process in IRTAD countries, the road safety strategies and targets in place and information on recent trends in speeding, drink-driving and other aspects of road user behaviour.
Contents
Chapter 1. Road safety performance in 2014 and 2015 Chapter 2. Argentina Chapter 3. Australia Chapter 4. Austria Chapter 5. Belgium Chapter 6. Cambodia Chapter 7. Canada Chapter 8. Chile Chapter 9. Czech Republic Chapter 10. Denmark Chapter 11. Finland Chapter 12. France Chapter 13. Germany Chapter 14. Greece Chapter 15. Hungary Chapter 16. Iceland Chapter 17. Ireland Chapter 18. Israel
Chapter 21. Japan Chapter 22. Korea Chapter 23. Lithuania Chapter 24. Luxembourg Chapter 25. Malaysia Chapter 26. Morocco Chapter 27. Mexico Chapter 28. Netherlands Chapter 29. New Zealand Chapter 30. Nigeria Chapter 31. Norway Chapter 32. Poland Chapter 33. Portugal Chapter 34. Serbia Chapter 35. Slovenia Chapter 36. South Africa Chapter 37. Spain Chapter 38. Sweden Chapter 39. Switzerland Chapter 40. United Kingdom Chapter 41. United States
Consult this publication on line at http://dx.doi.org/10.1787/irtad-2016-en.
This work is published on the OECD iLibrary, which gathers all OECD books, periodicals and statistical databases. Visit www.oecd-ilibrary.org for more information.

Chapter 19. Italy Chapter 20. Jamaica

isbn 978-92-82-10797-3 75 2016 01 1 P