
rodriguegeographytransportsystems2007.md 878 KB
category: literaturenote citekey: rodriguegeographytransportsystems2007 title: The geography of transport systems authors: "Rodrigue, Jean-Paul; Comtois, Claude; Slack, Brian" year: 2007 date: 2007-00-00 2007 zotero_key: KUUD8CGX zotero_storage: SR98T8XY collections: doktoritöö folder: Liiklussageduse kaudne hindamine/05_Artiklid firstAuthor: "Rodrigue, Jean-Paul"
status: converted
The Geography of Transport Systems
Mobility is fundamental to economic and social activities, including commuting, manufacturing or supplying energy. Transport systems composed of infrastructures, modes and terminals are so embedded in the socio-economic life of individuals, institutions and corporations that they are often invisible to the consumer. Understanding how mobility is linked with geography is the main purpose of this valuable and accessible book.
The Geography of Transport Systems, concerned with movements of freight, people and information, tries to link spatial constraints and attributes with the origin, the destination, the extent, the nature and the purpose of movements. It is divided into nine chapters, each covering a specifi c conceptual dimension, including:
- Networks
- Modes and terminals
- International transportation
- Urban transportation
- Environmental impacts
Each chapter also covers methodologies linked with transport geography such as accessibility, spatial interactions, graph theory and geographic information systems for transportation.
This student-friendly book provides a comprehensive introduction to the fi eld, with a broad overview of its concepts, methods and areas of application. It is highly illustrated with over 100 fi gures and tables and includes an extensive glossary.
Jean-Paul Rodrigue is an Associate Professor of Geography in the Department of Economics and Geography at Hofstra University, USA.
Claude Comtois is Professor of Geography at the University of Montreal, Canada. Brian Slack is Professor of Geography at Concordia University, Canada.
The Geography of Transport Systems
Jean-Paul Rodrigue, Claude Comtois and Brian Slack

First published 2006 by Routledge
2 Park Square, Milton Park, Abingdon, Oxon OX14 4RN
Simultaneously published in the USA and Canada by Routledge
270 Madison Ave, New York, NY 10016
This edition published in the Taylor & Francis e-Library, 2006.
"To purchase your own copy of this or any of Taylor & Francis or Routledge's collection of thousands of eBooks please go to www.eBookstore.tandf.co.uk."
Routledge is an imprint of the Taylor & Francis Group, an informa business
© 2006 Jean-Paul Rodrigue, Claude Comtois and Brian Slack
All rights reserved. No part of this book may be reprinted or reproduced or utilised in any form or by any electronic, mechanical, or other means, now known or hereafter invented, including photocopying and recording, or in any information storage or retrieval system, without permission in writing from the publishers.
British Library Cataloguing in Publication Data
A catalogue record for this book is available from the British Library
Library of Congress Cataloging-in-Publication Data Rodrigue, Jean-Paul, 1967–
The geography of transport systems / Jean-Paul Rodrigue, Claude Comtois, and Brian Slack.
p. cm.
Includes bibliographical references and index.
- Transportation geography. I. Comtois, Claude, 1954– II. Slack, Brian, 1939–
III. Title.
HE323.R63 2006
388.01–dc22 2005029803
ISBN10: 0–415–35440–4 (hbk)
ISBN10: 0–415–35441–2 (pbk) ISBN10: 0–203–00111–7 (ebk)
ISBN13: 978–0–415–35440–0 (hbk)
ISBN13: 978–0–415–35441–7 (pbk)
ISBN13: 978–0–203–00111–0 (ebk)

Contents
| Preface | viii | |
|---|---|---|
| Chapter 1 | Transportation and geography | 1 |
| Chapter 2 |
Transportation systems and networks | 38 |
| Chapter 3 |
Economic and spatial structure of transport systems | 74 |
| Chapter 4 |
Transportation modes | 101 |
| Chapter 5 |
Transport terminals | 126 |
| Chapter 6 |
International and regional transportation | 144 |
| Chapter 7 |
Urban transportation | 171 |
| Chapter 8 |
Transport and environment | 204 |
| Chapter 9 |
Transport planning and policy | 227 |
| Chapter | 10 Conclusion: Issues and challenges in transport geography | 246 |
| Glossary | 252 | |
| Index | 276 |
Preface
Transportation is concerned with mobility, particularly how this mobility is taking place in the context of a wide variety of conditions. Mobility is a geographical endeavor since it trades space for a cost. Technological and economic forces have changed this balance many times in the past, but in recent decades a growing amount of space has been made accessible at a similar cost. It is thus not surprising to realize that at the same time that technology permitted improvements in transport speed, capacity and effi ciency, individuals and corporations have been able to take advantage of this improved mobility. A driving force of the global economy resides in the capacity of transport systems to ship large quantities of freight and to accommodate vast numbers of passengers. The world has become interconnected at several scales. This new geographical dimension transcends a more traditional perspective of transportation mainly focused on the city or the nation. At the beginning of the twenty-fi rst century, the geography of transportation is thus fundamentally being redefi ned by global, regional and local issues.
Presenting these issues to students or the public remains a challenging task. This book has specifi cally been designed with this in mind. Its origins are rather unusual since it began in 1997 as an online initiative to provide material about transport geography and was simply titled 'Transport Geography on the Web'. The material was considerably revised and expanded over the years, often thanks to comments and queries we received, as the site gained a wider audience. It has already endured the test of being exposed to the scrutiny of a global audience including practitioners, policy makers, educators and, most importantly, students. For many years and as these words were written, the site ranked fi rst in Google under the topic of transport geography, implying its popularity as a trusted source of information. Its contents are appearing in a growing number of transport-related curriculums underlining the relevance of the material covered and that a demand was being fulfi lled. The step of moving to a textbook was a natural one, especially after receiving many requests in this direction.
The textbook is articulated along two core approaches to transport geography, one conceptual and the other methodological. The conceptual parts present what we think are some of the most relevant issues explaining contemporary transport geography. In addition to the more conventional topics related to transport modes, terminals, as well as urban transportation, the book also substantially focuses on emerging issues such as globalization, logistics and the environment. Many, if not all, of these issues have been superfi cially covered in the past, but their importance cannot be underestimated in a transport geography that involves an increasingly integrated world.
The methodological parts address how transportation information is used to assist transport operators allocate their resources (investments, vehicles) or to infl uence public policy. This includes a wide array of methods ranging from qualitative to quantitative. Since transport is a fi eld of application, the use of methodologies is particularly relevant as they relate to real world issues. The merging between methodologies and information technologies has led to many new opportunities, notably with the emergence of transportation geographic information systems (GIS-T). It has become a very active fi eld of investigation and application.
It is our hope that the reader will have a better understanding of the nature, function and challenges of contemporary transportation systems. The online companion site will ensure that this book will not be a static endeavor and will be revised and updated as changes take place in this fascinating fi eld which is transport geography.
New York, January 2006
Transportation and geography 1
Movements of people, goods and information have always been fundamental components of human societies. Contemporary economic processes have been accompanied by a signifi cant increase in mobility and higher levels of accessibility. Although this trend can be traced back to the industrial revolution, it signifi cantly accelerated in the second half of the twentieth century as trade was liberalized, economic blocs emerged and the comparative advantages of global labor and resources were used more effi ciently. However, these conditions are interdependent with the capacity to manage, support and expand movements of passengers and freight as well as their underlying information fl ows. Societies have become increasingly dependent on their transport systems to support a wide variety of activities ranging, among others, from commuting, supplying energy needs, to distributing parts between factories. Developing transport systems has been a continuous challenge to satisfy mobility needs, to support economic development and to participate in the global economy. The goal of this introductory chapter is to provide a defi nition of the nature, role and function of transport geography and where the discipline stands in regard to other disciplines. It also underlines the importance of specifi c dimensions such as nodes, locations, networks and interactions. A historical perspective on the evolution of transport systems underlines the consequences of technical innovations and how improvements in transportation were interdependent with contemporary economic and social changes.
Concept 1 – What is transport geography?
The purpose of transportation
The ideal transport mode would be instantaneous, free, have an unlimited capacity and always be available. It would render space obsolete. This is obviously not the case. Space is a constraint for the construction of transport networks. Transportation appears to be an economic activity different from the others. It trades space with time and thus money.
(translated from Merlin, 1992)
As the above quotation underlines, the purpose of transportation is to overcome space, which is shaped by a variety of human and physical constraints such as distance, time, administrative divisions and topography. Jointly, they confer a friction to any movement, commonly known as the friction of distance . However, these constraints and the friction they create can only be partially circumscribed. The extent to which this is done has a cost that varies greatly according to factors such as the distance involved and the nature of what is being transported. There would be no transportation without geography and there would be no geography without transportation. The goal of transportation is thus to transform the geographical attributes of freight, people or information, from an origin
to a destination, conferring them an added value in the process. The convenience at which this can be done varies considerably.
Transportability. Refers to the ease of movement of passengers, freight or information. It is related to transport costs as well as to the attributes of what is being transported (fragility, perishability, price). Political factors can also infl uence transportability such as laws, regulations, borders and tariffs. When transportability is high, activities are less constrained by distance.
The specifi c purpose of transportation is to fulfi ll a demand for mobility, since transportation can only exist if it moves people, freight and information around. Otherwise it has no purpose. This is because transportation is the outcome of a derived demand (Figure 1.1).
What takes place in one sector has impacts on another; demand for a good or service in one sector is derived from another. For instance, a consumer buying a good in a store will likely trigger the replacement of this product, which will generate demands for activities such as manufacturing, resource extraction and, of course, transport. What is different about transport is that it cannot exist alone and a movement cannot be stored. An unsold product can remain on the shelf of a store until a customer buys it (often with discount incentives), but an unsold seat on a fl ight or unused cargo capacity in the same fl ight remains unsold and cannot be brought back as additional capacity later. In this case an opportunity has been missed since transport supply is higher than transport demand. The derived demand of transportation is often very diffi cult to reconcile with an equivalent supply. There are two major types of derived transport demand:
Direct derived demand . Refers to movements that are directly the outcome of economic activities, without which they would not take place. For instance, workrelated activities commonly involve commuting between the place of residence and the workplace. There is a supply of work in one location (residence) and a demand of labor in another (workplace). For freight transportation, all the components of a supply chain require movements of raw materials, parts and fi nished products on modes such as trucks, rail or containerships.
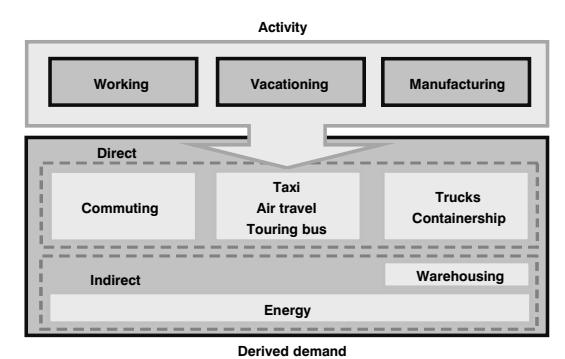
Figure 1.1 Transport as derived demand
Indirect derived demand . Considers movements created by the requirements of other movements. The most obvious example is energy where fuel consumption from transportation activities must be supplied by an energy production system requiring movements from zones of extraction to refi neries and storage facilities and, fi nally, to places of consumption. Warehousing can also be labeled as an indirect derived demand since it is a "non-movement" of a freight element. Warehousing exists because it is virtually impossible to move commodities instantly from where they are produced to where they are consumed.
Consequently, the fundamental purpose of transport is geographic in nature, because it facilitates movements between different locations. Transport thus plays a role in the structure and organization of space and territories, which may vary according to the level of development. In the nineteenth century, the purpose of the emerging modern forms of transportation, mainly railways and maritime shipping, was to expand coverage, and create and consolidate national markets. In the twentieth century, the objective shifted to selecting itineraries, prioritizing transport modes, increasing the capacity of existing networks and responding to the mobility needs and this at a scale which was increasingly global. In the twenty-fi rst century, transportation must cope with a globally oriented economic system in a timely and cost-effective way, but also with several local problems such as congestion.
The importance of transportation
Transport represents one of the most important human activities worldwide. It is an indispensable component of the economy and plays a major role in spatial relations between locations. Transport creates valuable links between regions and economic activities, between people and the rest of the world. Transport is a multidimensional activity whose importance is:
- Historical. Transport modes have played several different historical roles in the rise of civilizations (Egypt, Rome and China ), in the development of societies (creation of social structures) and also in national defense (Roman Empire, American road network).
- Social. Transport modes facilitate access to healthcare, welfare, and cultural or artistic events, thus performing a social service. They shape social interactions by favoring or inhibiting the mobility of people. Transportation thus supports and may even shape social structures.
- Political. Governments play a critical role in transport as sources of investment and as regulators. The political role of transportation is undeniable as governments often subsidize the mobility of their populations (highways, public transit, etc.). While most transport demand relates to economic imperatives, many communication corridors have been constructed for political reasons such as national accessibility or job creation. Transport thus has an impact on nation building and national unity, but it is also a political tool.
- Environmental. Despite the manifest advantages of transport, its environmental consequences are also signifi cant. They include air and water quality, noise level and public health. All decisions relating to transport need to be evaluated taking into account the corresponding environmental costs. Transport is a dominant factor in contemporary environmental issues.
• Economic. The evolution of transport has always been linked to economic development. The construction of transport infrastructures also permitted the development of a corresponding transport industry (car manufacturing, air transport companies, etc.). The transport sector is also an economic factor in the production of goods and services. It contributes to the value-added of economic activities, facilitates economies of scale, infl uences land (real estate) value and the geographic specialization of regions. Transport is a factor shaping economic activities, but is also shaped by them.
Substantial empirical evidence indicates that the importance of transportation is growing. The following contemporary trends can be identifi ed regarding this issue:
- Growth of the demand. The twentieth century, more than any other, has seen a considerable growth of the transport demand related to individual (passengers) as well as freight mobility. This growth is jointly the result of larger quantities of passengers and freight being moved, but also the longer distances over which they are carried. Recent trends underline an ongoing process of mobility growth, which has led to the multiplication of the number of journeys involving a wide variety of modes that service transport demands.
- Reduction of costs. Even if several transportation modes are very expensive to own and operate (ships and planes for instance), costs per unit transported have dropped signifi cantly over recent decades. This has made it possible to overcome larger distances and further exploit the comparative advantages of space. As a result, despite the lower costs, the share of transport activities in the economy has remained relatively constant in time.
- Expansion of infrastructures. The above two trends have obviously extended the requirements for transport infrastructures both quantitatively and qualitatively. Roads, harbors, airports, telecommunication facilities and pipelines have expanded considerably to service new areas and add capacity to existing networks. Transportation infrastructures are thus a major component of land use, notably in developed countries.
Facing these contemporary trends, an important part of the spatial differentiation of the economy is related to where resources (raw materials, capital, people, information, etc.) are located and how well they can be distributed. Transport routes are established to distribute resources between places where they are abundant and places where they are scarce, but only if the costs are lower than the benefi ts.
Consequently, transportation has an important role to play in the conditions that affect global, national and regional economic entities. It is a strategic infrastructure that is so embedded in the socio-economic life of individuals, institutions and corporations that it is often invisible to the consumer, but always part of all economic and social functions. This is paradoxical, since the perceived invisibility of transportation is derived from its effi ciency. If transport is disrupted or ceases to operate, the consequences can be dramatic. The paradox gives rise to several fallacies about transportation; two major ones shown on Figure 1.2 are:
• Access is not accessibility . Many transport systems have universal access; no specifi c user can have a competitive advantage over others since access is the same for anyone. For instance, a public highway system can in theory be accessed by anyone, for example by a major trucking company having a large fl eet, its competitors, or
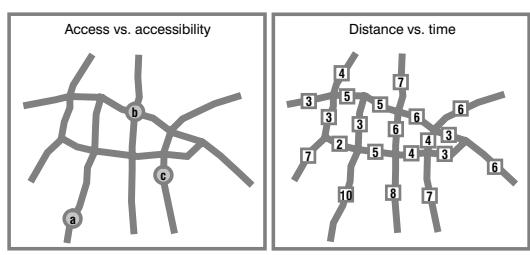
Figure 1.2 Two common fallacies in transport geography
by an individual driving an automobile. Thus, access is uniform wherever one is located in regard to the transport system as long as there is a possibility to enter or to exit. On the other hand, accessibility varies according to one's location within the transport system. Access is thus uniform while accessibility is not; the latter is a relative concept. On the transport network shown in Figure 1.2 , locations a, b and c all have access to the system. However, location b appears to be more accessible than the other two due to its central location in relation to the network.
• Distance is not time. Distance often tends to be interchanged with time when measuring the performance of transport systems, which is a conceptual error. While distance remains constant, time can vary due to improvements in transport technology or because of congestion . Driving one kilometer through Manhattan is not the same as driving one kilometer through an Interstate in Iowa even if in both cases the same unit of distance has been traveled. Distance is thus a uniform attribute of the geography, while time is relative. On the above transport network shown in Figure 1.2, while distance is a uniform attribute, each segment has a travel time, which due to congestion, varies differently from distance.
Concepts and dimensions of transport geography
Transportation interests geographers for two main reasons. First transport infrastructures, terminals, equipment and networks occupy an important place in space and constitute the basis of a complex spatial system. Second, since geography seeks to explain spatial relationships, networks are of specifi c interest because they are the main support of these interactions.
Transport geography is a sub-discipline of geography concerned about movements of freight, people and information. It seeks to link spatial constraints and attributes with the origin, the destination, the extent, the nature and the purpose of movements.
Transport geography, as a discipline, emerged from economic geography in the second half of the twentieth century. Traditionally, transportation has been an important factor over the economic representations of geographic space, namely in terms of the location of economic activities and the monetary costs of distance. The growing mobility of passengers and freight justifi ed the emergence of transport geographyas a specialized fi eld of investigation. In the 1960s, transport costs were recognized as key factors in location theories. However, from the 1970s globalization challenged the centrality of
transportation in many geographical and regional development investigations. As a result, transportation became under-represented in economic geography in the 1970s and 1980s, even if mobility of people and freight and low transport costs were considered as important factors behind the globalization of trade and production.
There are twelve key concepts related to transport geography among which transportation network s, transportation nodes and transportation demand are at its core (Figure 1.3). They are closely linked to economic, political, regional, historical and population geography, among others. Several other concepts, such as regional planning, information systems, operations research and location theory are commonly used in transport geography, notably as tools and methods for the spatial analysis of transportation. At a wider level, links exist with several major fi elds of science including natural sciences, mathematics and economics. Indeed, like geography, transport geography is at the intersection of several concepts and methods initially developed outside the discipline that have been adapted to its particular interests and concerns.
Since the 1990s, transport geographyhas received renewed attention, especially because the issues of mobility, production and distribution are interrelated in a complex geographical setting. It is now recognized that transportation is a system that considers the complex relationships between its core elements: networks, nodes and demand (Figure 1.4). Demand for the movement of people, freight and information is a derived function of a variety of socio-economic activities. Nodes are the locations where movements are originating, ending and being transferred. The concept of nodes varies according to the geographical scale being considered, ranging from local to global (poles of the global economy ). Networks are composed of a set of linkages derived from transport infrastructures. The three core relationships and the impedance (friction) they are subject to are:
- Locations. The level of spatial accumulation of socio-economic activities jointly defi nes demand and where this demand is taking place. Impedance is mostly a function of the accessibility of nodes to the demand they service.
- Flows. The amount of traffi c over the network, which is jointly a function of the demand and the capacity of the linkages to support them. Flows are mainly subject to the friction of space with distance being the most signifi cant impedance factor.
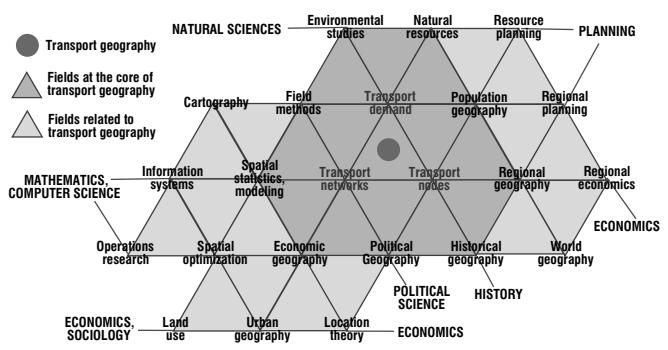
Figure 1.3 Fields of transport geography (Source: Haggett 2001)
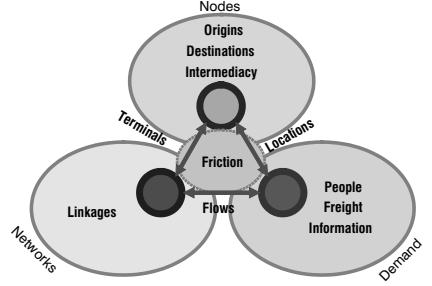
Figure 1.4 The transport system
• Terminals. The facilities enabling access to the network as terminals are jointly characterized by their nodality and the linkages that are radiated from them. The capacity of transport terminals to handle fl ows is the main impedance factor.
The analysis of these concepts relies on methodologies often developed by other disciplines such as economics, mathematics, planning and demography. For instance, the spatial structure of transportation network s can be analyzed with graph theory , which was initially developed for mathematics. Further, many models developed for the analysis of movements, such as the gravity model , were borrowed from physical sciences. Multidisciplinarity is consequently an important attribute of transport geography, as in geography in general.
The role of transport geographyis to understand the spatial relations that are produced by transport systems. A better understanding of spatial relations is essential to assist private and public actors involved in transportation mitigate transport problems, such as capacity, transfer, reliability and integration of transport systems. There are three basic geographical considerations relevant to transport geography:
- Location. As all activities are located somewhere, each location has its own characteristics conferring a potential supply and/or a demand for resources, products, services or labor. A location will determine the nature, the origin, the destination, the distance and even the possibility of a movement to be realized. For instance, a city provides employment in various sectors of activity in addition to consuming resources.
- Complementarity. Locations must require exchanging goods, people or information. This implies that some locations have a surplus while others have a defi cit. The only way an equilibrium can be reached is by movements between locations having surpluses and locations having demands. For instance, a complementarity is created between a store (surplus of goods) and its customers (demand of goods).
- Scale. Movements generated by complementarity are occurring at different scales, pending the nature of the activity. Scale illustrates how transportation systems are established over local, regional and global geographies. For instance, home-to-work journeys generally have a local or regional scale, while the distribution network of a multinational corporation is most likely to cover several regions of the world.
Consequently, transport systems, by their nature, consume land and support the relationships between locations.
Concept 2 – Transportation and space
Physical constraints
Transport geography is concerned with movements that take place over space. The physical features of this space impose major constraints on transportation systems, in terms of what mode can be used, the extent of the service, its costs and capacity. Three basic spatial constraints of the terrestrial space can be identifi ed:
- Topography. Features such as mountains and valleys have strongly infl uenced the structure of networks, the cost and feasibility of transportation projects. The main land transport infrastructures are built usually where there are the least physical impediments, such as on plains, along valleys, or through mountain passes. Water transport is infl uenced by water depths and the location of obstacles such as reefs. Coastlines exert an infl uence on the location of port infrastructure. Aircraft require airfi elds of considerable size for takeoff and landing. Topography can impose a natural convergence of routes that will create a certain degree of centrality and may assist a location in becoming a trade center as a collector and distributor of goods. Topography can complicate, postpone or prevent the activities of the transport industry. Land transportation networks are notably infl uenced by the topography, as highways and railways tend to be impeded by grades higher than 3 percent and 1 percent respectively. Under such circumstances, land transportation tends to be of higher density in areas of limited topography.
- Hydrography. The properties, distribution and circulation of water play an important role in the transport industry. Maritime transport is infl uenced greatly by the availability of navigable channels through rivers, lakes and shallow seas. Several rivers such as the Mississippi, the St. Lawrence, the Rhine, the Mekong or the Yangtze are important navigable routeways into the heart of continents and historically have been the focus of human activities that have taken advantage of the transport opportunities. Port sites are also highly infl uenced by the physical attributes of the site where natural features (bays, sand dunes, and fjords) protect port installations. Since it is at these installations that traffi c is transshipped, the location of ports is a dominant element in the structure of maritime networks. Where barriers exist, such as narrows, rapids, or land breaks, water transport can only overcome these obstacles with heavy investments in canals or dredging . Conversely, waterways serve as barriers to land transportation necessitating the construction of bridges, tunnels and detours, etc.
- Climate. Its major components include temperature, wind and precipitation. Their impacts on transportation modes and infrastructure range from negligible to severe. Freight and passenger movement can be seriously curtailed by hazardous conditions such as snow, heavy rainfall, ice or fog. Jet streams are also a major physical component that international air carriers must take into consideration. For an aircraft, the speed of wind can affect travel costs. When the wind is pushing the airplane towards its destination, it can reduce fl ight time by up to several hours for intercontinental fl ights. Climate also affects transportation networks by infl uencing construction and maintenance costs.
Physical constraints fundamentally act as absolute and relative barriers to movements (Figure 1.5):
- Absolute barriers are geographical features that entirely prevent a movement. They must either be bypassed or be overcome by specifi c infrastructures. For instance, a river is considered as an absolute barrier for land transportation and can only be overcome if a tunnel or a bridge is constructed. A body of water forms a similar absolute barrier and could be overcome if ports are built and a maritime service (ferry, cargo ships, etc.) is established. Conversely, land acts as an absolute barrier for maritime transportation, with discontinuities (barriers) that can be overcome with costly infrastructures such as navigation channels and canals.
- Relative barriers are geographical features that force a degree of friction on a movement. In turn, this friction is likely to infl uence the path (route) selected to link two locations (A and B on Figure 1.5). Topography is a classic example of a relative barrier that infl uences land transportation routes along paths having the least possible friction (e.g. plains and valleys). For maritime transportation, relative barriers, such as straits, channels or ice, generally slow down circulation.
From a geometrical standpoint, the sphericity of the Earth determines the great circle distance. This feature explains the paths followed by major intercontinental maritime and air routes (Figure 1.6). Since the Earth is a sphere, the shortest path between two points is calculated by the great circle distance , which corresponds to an arc linking two points on a sphere. The circumference inferred out of these two points divides the Earth in two equal parts, thus the great circle. The great circle distance is useful to establish the shortest path to use when traveling at the intercontinental air and maritime level. The great circle route follows the sphericity of the globe; any shortest route is the one following the curve of the planet, along the parallels.
Because of the distortions caused by projections of the globe on a fl at sheet of paper, a straight line on a map is not necessarily the shortest distance. Ships and aircraft usually follow the great circle geometry to minimize distance and save time and money to customers. For instance, Figure 1.6 shows the shortest path between New York and Moscow (about 7,540 km). This path corresponds to an air transportation corridor. Air travel over the North Atlantic between North America and Europe follows a similar
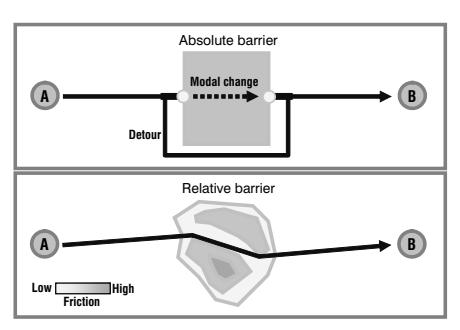
Figure 1.5 Absolute and relative barriers
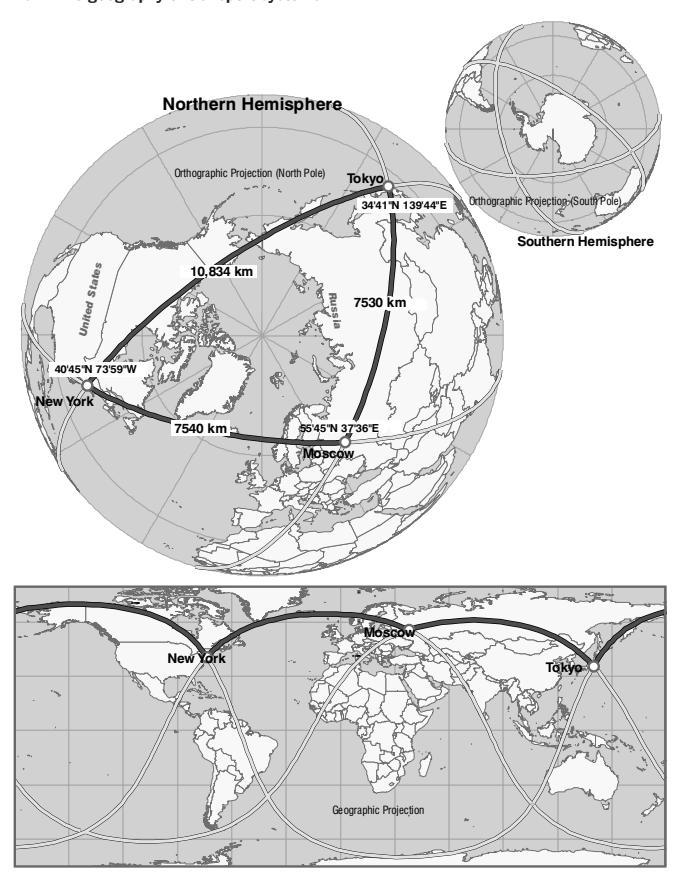
Figure 1.6 The great circle distance
path. To calculate the great circle distance (D) between two coordinates the following formula is used: cos (D) = (sin a sin b) + (cos a cos b cos |c|), where a and b are the latitudes (in degrees) of the respective coordinates and |c| is the absolute value of the difference of longitude between the respective coordinates. The results of this equation are in degrees. Each degree on the Earth's surface equals about 111.32 km, so the result must be multiplied by this number.
Transportation and the spatial structure
All locations are relative to one another. However, locations are not constant as transportation developments change levels of accessibility , and thus the relations between locations. The development of a location refl ects the cumulative relationships between transport infrastructure, economic activities and the built-environment. The following factors are particularly important in shaping the spatial structure:
- Costs. The spatial distribution of activities is related to factors of distance, namely its friction. Locational decisions are taken in an attempt to minimize costs, often related to transportation.
- Accessibility. All locations have a level of accessibility , but some are more accessible than others. Thus, because of transportation, some locations are perceived as more valuable than others.
- Agglomeration. There is a tendency for activities to agglomerate to take advantage of the value of specifi c locations. The more valuable a location, the more likely agglomeration will take place. The organization of activities is essentially hierarchical, resulting from the relationships between agglomeration and accessibilityat the local, regional and global levels.
Many contemporary transportation network s are inherited from the past, notably transport infrastructures. Even if over the last 200 years new technologies have revolutionized transportation in terms of speed, capacity and effi ciency, the spatial structure of many networks has not much changed. This inertia in the spatial structure of some transportation networks can be explained by two major factors:
- Physical attributes. Natural conditions can be modifi ed and adapted to suit human uses, but they are a very diffi cult constraint to escape, notably for land transportation. It is thus not surprising to fi nd that most networks follow the easiest (least cost) paths, which generally follow valleys and plains. Considerations that affected road construction a few hundred years ago are still in force today, although they are sometimes easier to circumscribe.
- Historical considerations. New infrastructures generally reinforce historical patterns of exchange, notably at the regional level. For instance, the current highway network of France has mainly followed the patterns set by the national roads network built early in the twentieth century. This network was established over the Royal roads network, itself mainly following roads built by the Romans. At the urban level, the pattern of streets is often inherited from an older pattern, which itself may have been infl uenced by the pre-existing rural structure (lot pattern and rural roads).
While inertia is important in transport network s, the introduction of new transport technologies or the addition of new transport infrastructures are leading to a transformation of existing networks. Recent developments in transport systems such
as container shipping, jumbo aircraft and the extensive application of information technology to transport management are creating a new transport environment and a new spatial structure. These transport infrastructures have intensifi ed global interactions and modifi ed the relative location of places. In this highly dynamic context, two processes are taking place at the same time:
- Specialization. Linked geographical entities are able to specialize in the production of commodities for which they have an advantage, and trading for what they do not produce. As a result, effi cient transportation systems are generally linked with higher levels of regional specialization. The globalizationof production clearly underlines this process as specialization occurs as long as the incurred savings in production costs are higher than the incurred additional transport costs.
- Segregation. Linked geographical entities may see the reinforcement of one at the expense of others, notably through economies of scale. This outcome often contradicts regional development policies aiming at providing uniform accessibility levels within a region.
The continuous evolution of transportation technology may not necessarily have expected effects on the spatial structure, as two forces are at play: concentration and dispersion. A common myth tends to relate transportation solely as a force of dispersion, favoring the spread of activities in space. This is not always the case. In numerous instances, transportation is a force of concentration, notably for business activities. Since transport infrastructures are generally expensive to build, they are established fi rst to service the most important locations. Even if it was a strong factor of dispersion, the automobile has also favored the concentration of several activities at specifi c places and in large volumes. Shopping centers are a relevant example of this process where central locations emerge in a dispersed setting.
Space/time relationships
One of the most basic relationships of transportation involves how much space can be overcome within a given amount of time. The faster the mode, the larger the distance that can be overcome within the same amount of time. Transportation, notably improvements in transport systems, changes the relationship between time and space. When this relationship involves easier, faster and cheaper access between places, this result is defi ned as a space/time convergence because the amount of space that can be overcome for a similar amount of time increases signifi cantly. Signifi cant regional and continental gains were achieved during the eighteenth and nineteenth centuries with the establishment of national and continental railway systems as well as with the growth of maritime shipping, a process which continued into the twentieth century with air and road transport systems. The outcome has been signifi cant differences in space/time relationships, mainly between developed and developing countries, refl ecting differences in the effi ciency of transport systems.
At the international level, globalization processes have been supported by improvements in transport technology. The result of more than 200 years of technological improvements has been a space/time collapse of global proportions in addition to the regional and continental processes previously mentioned. This enabled the extended exploitation of the advantages of the global market, notably in terms of resources and labor. Signifi cant reductions in transport and communication costs occurred concomitantly. There is thus a relationship between the rate of a space/time collapse on the integration of a region in global trade. Four major factors are of particular relevance in this process:
- Speed. The most straightforward factor relates to the increasing speed of many transport modes, a condition that particularly prevailed in the fi rst half of the twentieth century. More recently, speed has played a less signifi cant role as many modes are not going much faster. For instance, an automobile has a similar operating speed today than it had 60 years ago and a commercial jet plane operates at a similar speed than one 30 years ago.
- Economies of scale. Being able to transport larger amounts of freight and passengers at lower costs has improved considerably the capacity and effi ciency of transport systems.
- Expansion of transport infrastructures. Transport infrastructures have expanded considerably to service areas that were not previously serviced or were insuffi ciently serviced. A paradox of this feature is that although the expansion of transport infrastructures may have enabled distribution systems to expand, it has also increased the average distance over which passengers and freight are being carried.
- Effi ciency of transport terminals. Terminals, such as ports and airports, have shown a growing capacity to handle large quantities of traffi c over a short time period in a timely manner. Thus, even if the speed of many transport modes has not increased, more effi cient transport terminals may have helped reduce transport time.
The space/time convergence process investigates the changing relationship between space and time, and notably the impacts of transportation improvements on such a relationship. It is closely related to the concept of speed, which indicates how much space can be traveled over a specifi c amount of time (Figure 1.7). To measure space/time convergence (STC), travel time information is required for at least two locations and two time periods. Variation in travel time (∆TT) is simply divided by the time period (∆T) over which the process took place. Figure 1.7 provides an example of space/ time convergence between two locations, A and B. In 1950, it took 6.2 hours to travel between A and B. By 2000, this travel time was reduced to 2.6 hours. Consequently, STC is –0.072 hours per year, or –4.32 minutes per year. The value is negative because the time value is being reduced; if the value was positive, a space/time divergence would be observed.
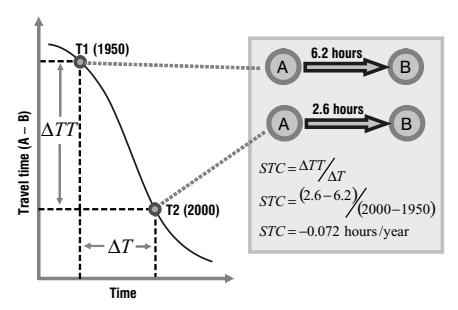
Figure 1.7 Space/time convergence
However, space/time convergence can also be inverted under specifi c circumstances. For instance, congestionis increasing in many metropolitan areas, implying additional delays for activities such as commuting . Traffi c in congested urban areas is moving at the same speed that it did 100 years ago on horse carriages. Air transportation, despite having dramatically contributed to the space/time collapse convergence is also experiencing growing delays. Flight times are getting longer between many destinations, mainly because of takeoff, landing and gate access delays. Airlines are simply posting longer fl ight times to factor in congestion. An express mail package fl own from Washington to Boston in about an hour (excluding delays at takeoff and landing due to airportcongestion) can have an extra one hour delay as it is carried from Logan Airport to downtown Boston, a distance of only two miles. The "last mile" can be the longest in many transport segments.
Concept 3 – Historical evolution of transportation
Transportation in the pre-industrial era (pre-1800s)
Effi ciently distributing freight and moving people has always been an important factor for maintaining the cohesion of economic systems from empires to modern nation states. With technological and economic developments, the means to achieve such a goal have evolved considerably. The historical evolution of transportation is very complex and is related to the spatial evolution of economic systems. It is possible to summarize this evolution, from the pre-industrial era to transportation in the early twenty-fi rst century, in fi ve major stages, each linked with specifi c technological innovations in the transport sector.
Before the major technical transformations brought forward by the industrial revolution at the end of the eighteenth century, no forms of motorized transportation existed. Transport technology was mainly limited to harnessing animal labor for land transport and to wind for maritime transport . The transported quantities were very limited and so was the speed at which people and freight were moving. The average overland speed by horse was between 8 and 15 kilometers per hour and maritime speeds were barely above these fi gures. Waterways were the most effi cient transport systems available and cities next to rivers were able to trade over longer distances and maintain political, economic and cultural cohesion over a larger territory. It is not surprising to fi nd that the fi rst civilizations emerged along river systems for agricultural but also for trading purposes (Tigris–Euphrates, Nile, Indus, Ganges, Huang He).
Because the effi ciency of the land transport system of this era was poor, the overwhelming majority of trade was local in scope. From the perspective of regional economic organization, the provision of cities in perishable agricultural commodities was limited to a radius of about 50 kilometers, at most. The size of cities also remained constant in time. Since people can walk about 5 km per hour and they are not willing to spend more than one hour per day walking, the daily space of interaction would be constrained by a 2.5 km radius, or about 20 square kilometers. Thus, most rural areas centered around a village and cities rarely exceeded a 5 km diameter. The largest cities prior to the industrial revolution , such as Rome, Beijing, Constantinople, or Venice never surpassed an area of 20 square kilometers. International trade did exist, but traded commodities were high-value (luxury) goods such as spices, silk, wine and perfume, notably along the Silk Road (see Figure 1.8).
The Silk Roadwas the most enduring trade route of human history, being used for about 1,500 years. Its name is taken from the prized Chinese textile that fl owed
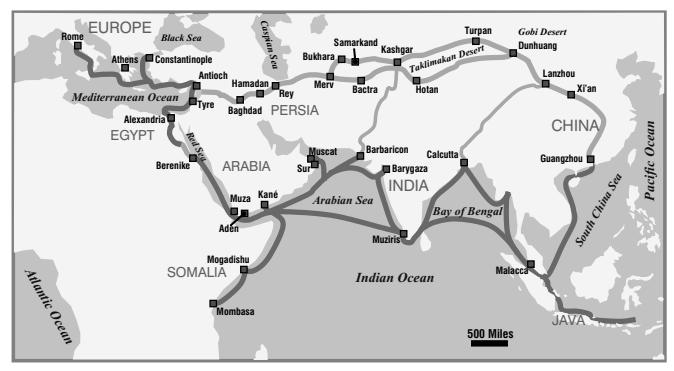
Figure 1.8 The Silk Road and the Arab sea routes
from Asia to the Middle East and Europe. The Silk Road consisted of a succession of trails followed by caravans through Central Asia, about 6,400 km in length. Travel was favored by the presence of steppes, although several arid zones had to be bypassed such as the Gobi and Takla Makan deserts. Economies of scale, harsh conditions and security considerations required the organization of trade into caravans slowly trekking from one stage (town and/or oasis) to the other.
Although it is suspected that signifi cant trade occurred for about 1,000 years beforehand, the Silk Road opened around 139 BC once China was unifi ed under the Han dynasty. It started at Changan (Xian) and ended at Antioch or Constantinople (Istanbul), passing by commercial cities such as Samarkand and Kashgar. It was very rare that caravans traveled for the whole distance since the trade system functioned as a chain. Merchants with their caravans were shippinggoods back and forth from one trade center to the other.
The initial use of the sea route linking the Mediterranean basin and Indiatook place during the Roman Era. Between the fi rst and sixth centuries, ships were sailing between the Red Sea and India, aided by summer monsoon winds. Goods were transshipped at the town of Berenike along the Red Sea and moved by camels inland to the Nile. From that point, river boats moved the goods to Alexandria, from which trade could be undertaken with the Roman Empire. From the ninth century, maritime routes controlled by the Arab traders emerged and gradually undermined the importance of the Silk Road . Since ships were much less constraining than caravans in terms of capacity, larger quantities of goods could be traded. The main maritime route started at Canton (Guangzhou), passed through Southeast Asia, the Indian Ocean, the Red Sea and then reached Alexandria. A signifi cant feeder went to the Spice Islands (Mollusks) in today's Indonesia. The diffusion of Islam was also favored through trade as many rules of ethics and commerce are embedded in the religion.
During the Middle Ages, the Venetians controlled the bulk of the Mediterranean trade which connected to the major trading centers of Constantinople, Antioch and Alexandria. As European powers developed their maritime technologies from the fi fteenth century, they successfully overthrew the Arab control of this lucrative trade route to replace it
by their own. Ships being able to transport commodities faster and cheaper marked the downfall of the Silk Road by the sixteenth century.
The transport system of the Roman Empire was a refl ection of the geographical characteristics and constraints of the Mediterranean basin (Figure 1.9). The Mediterranean Ocean provided a central role to support trade between a network of coastal cities, the most important of the Empire (Rome, Constantinople, Alexandria, Carthage, etc.). These cities were serviced by a road network permitting trade within their respective hinterlands. Little fl uvial transportation took place since the major pan-European rivers, the Rhine and the Danube, were military frontiers, not the core, of the Empire. The roads served numerous functions, such as military movements, political control, cultural and economic (trade).
Under such conditions, it was diffi cult to speak of an urban system, but rather of a set of relatively self-suffi cient economic systems with very limited trade. The preponderance of city-states during this period can a priori be explained by transportation, in particular the diffi culties of shipping goods (therefore to trade) from one place to another. Among the most notable exceptions to this were the Roman and Chinese empires, which committed extraordinary efforts to building transportation networks and consequently maintained control over an extensive territory for a long time period.
The economic importance and the geopolitics of transportation were recognized very early, notably for maritime transport ation, since before the industrial revolution it was the most convenient way to move freight and passengers around. Great commercial empires were established with maritime transportation. Initially, ships were propelled by rowers and sails were added around 2500 BC as a complementary form of propulsion. By Medieval times, an extensive maritime trade network, the highways of the time,
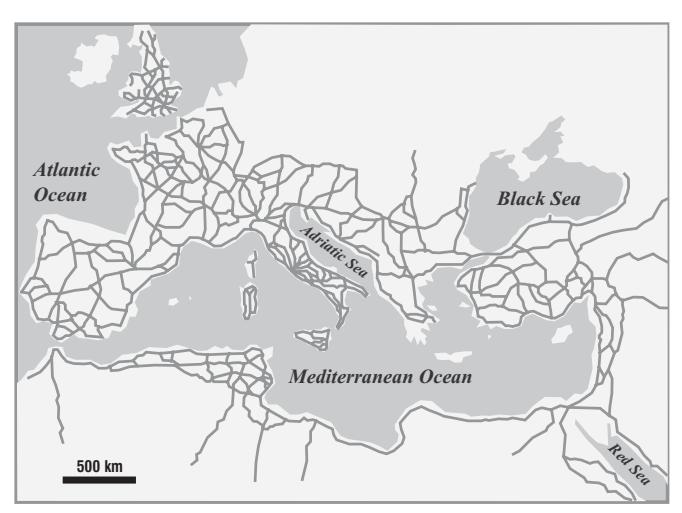
Figure 1.9 Roman road network, 200 AD
centered along the navigable rivers, canals, and coastal waters of Europe (and also China ) was established. Shipping was extensive and sophisticated using the English Channel, the North Sea, the Baltic and the Mediterranean where the most important cities were coastal or inland ports (London, Norwich, Königsberg, Hamburg, Bruges, Bordeaux, Lyon, Lisbon, Barcelona, and Venice). Trade of bulk goods, such as grain, salt, wine, wool, timber, and stone was taking place. By the fourteenth century galleys were fi nally replaced by fully fl edged sailships (the caravel and then the galleon) that were faster and required smaller crews. The year 1431 marked the beginning of European expansion with the discovery by the Portuguese of the North Atlantic circular wind pattern, better known as the trade wind s. A similar pattern was also found on the Indian and Pacifi c oceans with the monsoon winds.
The fall of Constantinople, the capital of the Byzantium Empire (Eastern Roman Empire), to the Turks in 1453 disrupted the traditional land trade route from Europe to Asia. Europe was forced to fi nd alternate maritime routes. One alternative, followed by Columbus in 1492, was to sail to the west and the other alternative, followed by Vasco daGama in 1497, was to sail to the east. Columbus stumbled upon the American continent, while Gama found a maritime route to Indiausing the Cape of Good Hope. These events were quickly followed by a wave of European exploration and colonization, initially by Spain and Portugal, the early maritime powers, then by Britain, France and the Netherlands. The traditional trade route to Asia no longer involved Italy (Venice) and Arabia, but involved direct maritime connections from ports such as Lisbon. European powers were able to master the seas with larger, better armed and more effi cient sailing ships and thus were able to control international trade and colonization. By the early eighteenth century, most of the world's territories were controlled by Europe, providing wealth and markets to their thriving metropolises through a system of colonial trade (Figure 1.10).
By the early eighteenth century, a complex network of colonial trade was established over the North Atlantic Ocean. This network was partially the result of local conditions
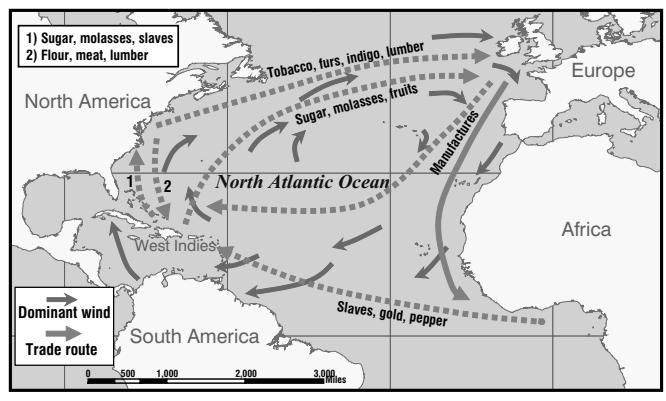
Figure 1.10 Colonial trade pattern, North Atlantic, eighteenth century
and of dominant wind patterns. It was discovered in the fi fteenth century, notably after the voyages of Columbus, that there is a circular wind pattern over the North Atlantic. The eastward wind pattern, which blows on the southern part, came to be known as the "trade wind s" since they enabled ships to cross the Atlantic. The westward wind pattern, blowing on the northern part, came to be known as the "westerlies".
Since sailing ships were highly constrained by dominant wind patterns, a trade system followed this pattern. Manufactured commodities were exported from Europe, some towards the African colonial centers, some towards the American colonies. This system also included the slave trade, mainly to Central and South American colonies (Brazil, West Indies). Tropical commodities (sugar, molasses) fl owed to the American colonies and to Europe. North America also exported tobacco, furs, indigo (a dye) and lumber (for shipbuilding) to Europe. This system of trade collapsed in the nineteenth century with the introduction of steamships, the end of slavery and the independence of many of the colonies of the Americas.
Prior to the industrial revolution, the quantity of freight transport ed between nations was negligible by contemporary standards. For instance, during the Middle Ages, French imports via the Saint-Gothard Passage (between Italy and Switzerland) would not fi ll a freight train. The total amount of freight transported by the Venetian fl eet, which dominated Mediterranean trade for centuries, would not fi ll a modern cargo ship. The volume, but not the speed, of trade improved under mercantilism (fi fteenth to eighteenth centuries), notably for maritime transport ation. In spite of all, distribution capacities were very limited and speeds slow. For example, a stagecoach going through the English countryside in the sixteenth century had an average speed of two miles per hour; moving one ton of cargo 30 miles (50 km) inland in the United States by the late eighteenth century was as costly as moving it across the Atlantic. The inland transportation system was thus very limited, both for passengers and freight. By the late eighteenth century, canalsystems started to emerge in Europe, initially in the Netherlands and England. They permitted the beginning of large movements of bulk freight inland and expanded regional trade. Maritime and fl uvial transportation were consequently the dominant modes of the pre-industrial era.
The industrial revolution and transportation (1800–70)
It was during the industrial revolutionthat massive modifi cations of transport systems occurred in two major phases, the fi rst centered along the development of canal systems and the second centered along railways . This period marked the development of the steam engine that converted thermal energy into mechanical energy, providing an important territorial expansion for maritime and railway transport systems. Much of the credit of developing the fi rst effi cient steam engine in 1765 is attributed to the British engineer Watt, although the fi rst steam engines were used to pump water out of mines. It was then only a matter of time before the adaptation of the steam engine to locomotion. In 1769, the French engineer Cugnot built the fi rst self-propelled steam vehicle, along with being responsible for the fi rst automobile accident ever recorded. The fi rst mechanically propelled maritime vehicle was tested in 1790 by the American inventor Fitch as a mode of fl uvial transportation on the Delaware River. This marked a new era in the mechanization of land and maritime transport systems alike.
From the perspective of land transportation, the early industrial revolutionfaced problems over bottlenecks, as inland distribution was unable to carry the growing quantities of raw materials and fi nished goods. Roads were commonly unpaved and could not be used to effectively carry heavy loads. The fi rst Turnpike Trust was established in 1706. Each Trust was responsible to construct and maintain a specifi c road segment, which required capital. Capital was publicly raised and revenues were generated by charging tolls on users. This came as a somewhat unwelcome change as road users were used to freely make use of any public roads. Some would even jump over toll gates to avoid paying the fare. Spikes (or pikes) were installed on top of toll gates to prevent this, thus the name turnpike. The most potentially profi table roads became Trusts, which at their peak never accounted for more than 20 percent of Britain's road network. Turnpike Trusts were a success and improved land circulation substantially. Figure 1.11 depicts this evolution in rather typical phases of introduction, fast growth, maturity and then obsolescence. Between 1750 and 1800, the average time for a journey from London to Edinburgh was reduced from 12 to 4 days. Also, the time of a journey from Manchester to London fell from 3 days in 1760 to 28 hours in 1788. Road freight transport ation also improved due to the introduction in the 1760s of "fl ywagons": a system of freight distribution involving changing horses and crews at specifi c stages and thus permitting day-long movements. By 1770, there were 25,000 km of turnpike roads in England and most of the country was within 12.5 miles of one. The turnpike system reached a peak of 32,500 km by 1836, but by then rail transportation started to emerge, which marked the downfall of turnpikes.
Although improvements were made to road transport systems in the early seventeenth century this was not suffi cient to accommodate the growing demands on freight transportation. From the 1760s a set of freight shipping canals were slowly built in emerging industrial cores such as England (e.g. Bridgewater Canal, 1761) and the United States (e.g. Erie Canal , 1825). These projects relied on a system of locks to overcome changes in elevation, thus linking different segments of fl uvial systems into a comprehensive waterway system. Barges became increasingly used to move goods at a scale and a cost that were not previously possible. Economies of scale and specialization, the foundation of modern industrial production systems, became increasingly applicable through fl uvial canals. Physical obstacles made canal construction expensive, however, and the network was constrained. In 1830 there were about 2,000 miles of canals in Britain and by the end of the canal era in 1850, there were 4,250 miles of navigable waterways. The canal era was however short-lived as a new mode which would revolutionize and transform inland transportation appeared in the second half of the nineteenth century.
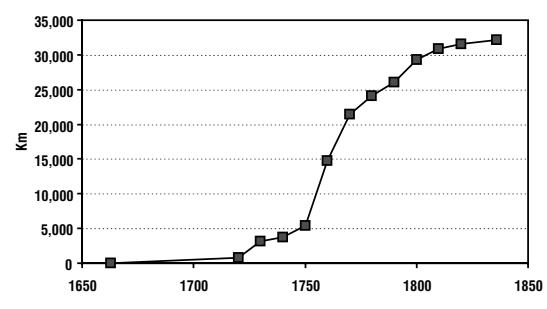
Figure 1.11 Turnpikes in Great Britain, late 18th and early 19th century (Source: adapted from D. Bogart 2004)
Steam railway technology initially appeared in 1814 to haul coal. It was found that using a steam engine on smooth rails required less power and could handle heavier loads. The fi rst commercial rail line linked Manchester to Liverpool in 1830 (a distance of 40 miles) and shortly after rail lines began to be laid throughout developed countries. By the 1850s, railroad towns were being established and the railways were giving access to resources and markets of vast territories. Six thousand miles of railways were then operating in England and railways were quickly being constructed in Western Europe and North America. Railroads represented an inland transport system that was fl exible in its spatial coverage and could carry heavy loads. As a result many canals fell into disrepair and were closed as they were no longer able to compete with rail services. In their initial phase of development, railways were a point-to-point process where major cities were linked one at a time by independent companies. Thus, the fi rst railroad companies bore the name of the city pairs or the region they were servicing (e.g. the Camden and Amboy Railroad Company, chartered in 1830). From the 1860s, integrated railway systems started to cohesively service whole nations with standard gauges and passenger and freight services. The journey between New York and Chicago was reduced from three weeks by stagecoach to 72 hours by train. Many cities thus became closely interconnected. The transcontinental line between New York and San Francisco, completed in 1869, represented a remarkable achievement in territorial integration made only possible by rail. It reduced the journey across the continent (New York to San Francisco) from six months to one week, thus opening for the Eastern part of the United Statesa vast pool of resources and new agricultural regions. This was followed by Canada in 1886 (trans-Canada railway) and Russia in 1904 (trans-Siberian railway).
In terms of international transportation, the beginning of the nineteenth century saw the establishment of the fi rst regular maritime routes linking harbors worldwide, especially over the North Atlantic between Europe and North America. These routes were navigated by fast clipper ships, which dominated ocean trade until the late 1850s. Another signifi cant improvement resided in the elaboration of accurate navigation charts where prevailing winds and sea current could be used to the advantage of navigation. Composite ships (a mixture of wood and iron armature) then took over a large portion of the trade until about 1900, but they could not compete with steamships which had been continually improved since they were fi rst introduced 100 years before. Regarding steamship technology, 1807 marks the fi rst successful use of a steamship, Fulton's North River / Clermont, on the Hudson servicing New York and Albany. The gradual improvement of steam engine technology slowly but surely permitted longer and safer voyages. In 1820, the Savannah was the fi rst steamship (used as auxiliary power) to cross the Atlantic, taking 29 days to link Liverpool to New York. The fi rst regular services for transatlantic passenger transport by steamships was inaugurated in 1838, followed closely by the usage of the helix, instead of the paddle wheel, as a more effi cient propeller (1840). Shipbuilding was also revolutionized by the usage of steel armatures (1860), enabling to escape the structural constraints of wood and iron armatures in terms of ship size. Steel armature ships were 30 to 40 percent lighter and had 15 percent more cargo capacity.
The main consequence of the industrial revolution was a specialization of transportation services and the establishment of large distribution networks of raw materials and energy.
Emergence of modern transportation systems (1870–1920)
By the end of the nineteenth century, international transportation undertook a new growth phase, especially with improvements in engine propulsion technology and a gradual shift from coal to oil in the 1870s. Although oil has been known for centuries for its combustion properties, its commercial use was only applied in the early nineteenth century. Inventors started experimenting with engines that could use the cheap new fuel. Oil increased the speed and the capacity of maritime transport . It also permitted to reduce the energy consumption of ships by a factor of 90 percent relative to coal, the main source of energy for steam engines prior to this innovation. An equal size oilpowered ship could transport more freight than a coal-powered ship, reducing operation costs considerably and extending range. Also, coal refueling stages along trade routes could be bypassed. Global maritime circulation was also dramatically improved when infrastructures to reduce intercontinental distances, such as the Suez (1869) and the Panama (1914) canals, were constructed. With the Suez Canal, the far reaches of Asia and Australia became more accessible (Figure 1.12).
The Panama Canal, completed in 1914, considerably shortens the maritime distances between the American East and West coasts by a factor of 13,000 km. Planned by the French but constructed by the British, the Suez Canal opened in 1869. It represents, along with the Panama Canal, one of the most signifi cant maritime "shortcuts" ever built. It brought a new era of European infl uence to Pacifi c Asia by reducing the journey from Asia to Europe by about 6,000 km. The region became commercially accessible and colonial trade expanded as a result of increased interactions because of a reduced friction of distance . Great Britain, the maritime power of the time, benefi ted substantially from this improved access. For instance, the Suez Canal shortened the distance of a maritime journey from London to Bombay by 41 percent and shortened the distance of the journey from London to Shanghai by 32 percent.
The increasing size of ships, the outcome of advances in shipbuilding, imposed massive investments in portinfrastructures such as piers and docks to accommodate them. Ship size grew dramatically, from the largest tonnage of 3,800 gross registered tons (revenue making cargo space) in 1871 to 47,000 tons in 1914. The harbor, while integrating production and transshipping activities, became an industrial complex around which agglomerated activities using ponderous raw materials. From the 1880s, liner services linked major ports of the world, supporting the fi rst regular international passenger transport services, until the 1950s when air transportation became the dominant mode. This period also marked the golden era of the development of the
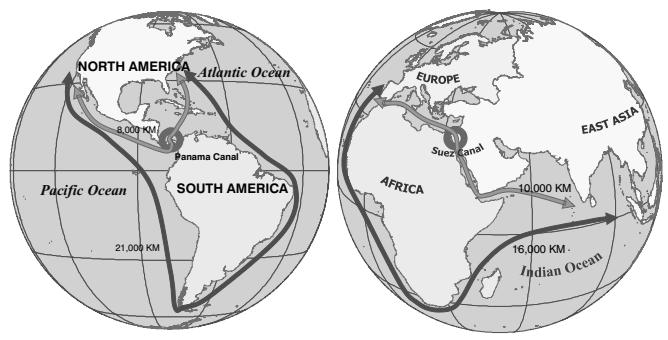
Figure 1.12 Geographical impacts of the Panama and Suez canals
railway transport system as railway networks expanded tremendously and became the dominant land transport mode for both passengers and freight. As the speed and power of locomotives improved and as the market expanded, rail services became increasingly specialized, with trains entirely devoted to passengers or freight. Rail systems reached a phase of maturity.
Another signifi cant technological change of this era involved urban transportation, which until then solely relied on walking and different types of carriages (mainly horse drawn). The signifi cant growth of the urban population favored the construction of the fi rst public urban transport systems. Electric energy became widely used in the 1880s and considerably changed urban transport systems with the introduction of tramways (streetcars), notably in Western Europe and in the United States . They enabled the fi rst forms of urban sprawl and the specialization of economic functions, notably by a wider separation between the places of work and residence. In large agglomerations, underground metro systems began to be constructed, London being the fi rst in 1863. The bicycle, fi rst shown at the Paris Exhibition of 1867, was also an important innovation which changed commuting in the late nineteenth century. Initially, the rich used it as a form of leisure, but it was rapidly adopted by the labor class as a mode of transportation to the workplace. Today, the bicycle is much less used in developed countries (outside of recreational purposes), but it is still a major mode of transportation in developing countries, especially China .
This era also marked the fi rst signifi cant developments in telecommunications. In 1844, Samuel Morse built the fi rst experimental telegraph line in the United Statesbetween Washington and Baltimore, opening a new era in the transmission of information. By 1852, more than 40,000 km of telegraph lines were in service in the United States. In 1866, the fi rst successful transatlantic telegraph line marked the inauguration of an intercontinental telegraphic network. The growth of telecommunications is thus closely associated with the growth of railways and international shipping . Managing a rail transport system, especially at the continental level, became more effi cient with telegraphic communication. In fact, continental rail and telegraphic networks were often laid concomitantly. Telecommunications were also a dominant factor behind the creation of standard times zones in 1884. From a multiplicity of local times, zones of constant time with Greenwich (England) as the reference were laid. This improved the scheduling of passenger and freight transport ation at national levels. By 1895, every continent was linked by telegraphic lines, a precursor of the global information network that would emerge in the late twentieth century. Business transactions became more effi cient as production, management and consumption centers could interact with delays that were in hours instead of weeks and even months.
Transportation in the Fordist era (1920–70)
The Fordist era was epitomized by the adoption of the assembly line as the dominant form of industrial production, an innovation that benefi ted transportation substantially. The internal combustion engine, or four-stroke engine by Daimler (1889), which was a modifi ed version of the Diesel engine (1885), and the pneumatic tire (1885) by Dunlop made road vehicle operations faster and more comfortable. Compared with steam engines, internal combustion engines have a much higher effi ciency and use a lighter fuel: petrol. Petrol, previously perceived as an unwanted by-product of the oil refi ning process, which was seeking kerosene for illumination, became a convenient fuel. Initially, diesel engines were bulky, limiting their use to industrial and maritime propulsion, a purpose which they still fulfi ll today. The internal combustion engine permitted an extended fl exibility of movements with fast, inexpensive and ubiquitous (door to door) transport modes such as automobiles, buses and trucks. Mass producing these vehicles changed considerably the industrial production system, notably by 1913 when Ford began the production of the Model T car using an assembly line. From 1913 to 1927, about 14 million Ford Model T cars were built, making it the second most important production car, behind the Volkswagen Beetle. The rapid diffusion of the automobile marked an increased demand for oil products and other raw materials such as steel and rubber.
Economies of scale also improved transportation in terms of capacity, which enabled to move low-cost bulk commodities such as minerals and grain over long distances. Oil tankers are a good example of the application of this principle to transport larger quantities of oilat a lower cost, especially after World War II when global demand surged. Maritime routes were thus expanded to include tanker routes, notably from the Middle East, the dominant global producer of oil. The very long distances concerned in the oil trade favored the construction of larger tankers. In the 1960s, tanker ships of 100,000 tons became available, to be supplanted by VLCCs (Very Large Crude Carriers) of 250,000 tons in the 1970s and by ULCCs (Ultra Large Crude Carriers) of 550,000 tons at the end of the 1970s. A ship of 550,000 tons is able to transport 3.5 million tons of oil annually between the Persian Gulf and Western Europe.
Although the fi rst balloon fl ight took place in 1783, due to the lack of propulsion no practical applications for air travel were realized until the twentieth century. The fi rst propelled fl ight was made in 1903 by the Wright brothers and inaugurated the era of air transportation . The initial air transport services were targeted at mail since it was a type of freight that could be easily transported and initially proved to be more profi table than transporting passengers. The year 1919 marked the fi rst commercial air transport service between England and France, but air transport suffered from limitations in terms of capacity and range. Several attempts were made at developing dirigible services, as the Atlantic was crossed by a Zeppelin dirigible in 1924. However, such technology was abandoned in 1937 after the Hindenburg accident, in which the hydrogenfi lled reservoirs burned. The 1920s and 1930s saw the expansion of regional and national air transport services in Europe and the United States with successful propeller aircrafts such as the Douglas DC-3. The post-World War II period was however the turning point for air transportation as the range, capacity and speed of aircraft increased as well as the average income of the passengers. A growing number of people were thus able to afford the speed and convenience of air transportation. In 1958, the fi rst commercial jet plane, the Boeing 707, entered service and revolutionized international movements of passengers, marking the end of passenger transoceanic ships.
Basic telecommunication infrastructures, such as the telephone and the radio, were mass marketed during the Fordist era. However, the major change was the large diffusion of the automobile, especially from the 1950s as it became a truly mass consumption product. No other mode of transportation has so drastically changed lifestyles and the structure of cities, notably for developed countries. It created suburbanization and expanded cities to areas larger than 100 km in diameter in some instances. In dense and productive regions, such as the Northeast of the United States, the urban system became structured and interconnected by transport network s to the point that it could be considered as one vast urban region: the Megalopolis.
A new context for transportation: the post-Fordist era (1970–)
Among the major changes in international transportation since the 1970s are the massive development of telecommunications, the globalization of trade, more effi cient distribution systems, and the considerable development of air transportation .
Telecommunications enabled growing information exchanges, especially for the fi nancial and service sectors. After 1970, telecommunications successfully merged with information technologies. As such, telecommunication also became a medium of doing business in its own right, in addition to supporting and enhancing other transportation modes. The information highway became a reality as fi ber optic cables gradually replaced copper wires, multiplying the capacity to transmit information between computers. This growth was however dwarfed by the tremendous growth in processing power of computers, which are now fundamental components of economic and social activities in developed countries. A network of satellite communication was also created to support the growing exchanges of information, especially for television images. Out of this wireless technology emerged local cellular networks which expanded and merged to cover whole cities, countries, regions and then continents. Telecommunications have reached the era of individual access, portability and global coverage.
In a post-Fordist system, the fragmentation of production, organizing an international division of work, as well as the principle of "just-in-time" increased the quantity of freight moving at the local, regional and international levels. This in turn required increasing efforts to manage freight and reinforced the development of logistics , the science of physical distribution systems. Containers, the main agents of the modern international transport system, enabled an increased fl exibility of freight transport , mainly by reducing transshipment costs and delays. Handling a container requires 25 times less labor than its equivalent in bulk freight. They were introduced by the American entrepreneur, Malcolm McLean who initially applied containerization to land transport. However, the true potential of containerization became clear when interfacing with other modes became possible, mainly between maritime, rail and road transportation.
The fi rst containership(the Ideal-X, a converted T2 oil tanker) set sail in 1956 from New York to Houston and marked the beginning of the era of containerization. The Sea-Land Company established the fi rst regular maritime container line in 1965 over the Atlantic between North America and Western Europe. In 1960, the Port Authority of New York/New Jersey, foreseeing the potential in container trade, constructed the fi rst specialized container terminal next to Port Newark: the Port Elizabeth Marine Terminal. The fi rst international container shipping services began in 1966 between the East Coast of the United States and Western Europe. By the early 1980s, container services with specialized ships (cellular containerships, fi rst introduced in 1967) became a dominant aspect of international and regional transport systems. However, the size of those ships remained for 20 years constrained by the size of the Panama Canal, which de facto became the panamax standard. In 1988, the fi rst post-panamax containership was introduced, an indication of the will to further expand economies of scale in maritime container shipping.
Air and railtransportation experienced remarkable improvements in the late 1960s and early 1970s. The fi rst commercial fl ight of a Boeing 747 between New York and London in 1969 marked an important landmark for international transportation (mainly for passengers, but freight became a signifi cant function in the 1980s). This giant plane can transport around 400 passengers, depending on the confi guration. It permitted a considerable reduction of air fares through economies of scale and opened intercontinental air transportationto the mass market. Attempts were also undertaken to establish faster-than-sound commercial services with the Concorde (1976; fl ying at 2,200 km/hr). However, such services proved to be fi nancially unsound and no new supersonic commercial planes have been built since the 1970s. The Concorde was fi nally retired in 2003. At the regional level, the emergence of high-speed train networks provided fast and effi cient inter-urban services, notably in France (1981; TGV ; speeds up to 300 km/hr) and in Japan (1964; Shinkansen; speeds up to 275 km/hr).
Major industrial corporations making transportation equipment, such as car manufacturers, have become dominant players in the global economy . Even if the car is not an international transport mode, its diffusion has expanded global trade of vehicles, parts, raw materials and fuel (mainly oil ). Car production, which used to be mainly concentrated in the United States , Japan and Germany, has become a global industry with a few key players part of well integrated groups such as Ford, General Motors, Daimler Chrysler, Toyota and Mitsubishi. Along with oil conglomerates, they have pursued strategies aimed at the diffusion of the automobile as the main mode of individual transportation. This has led to growing mobility but also to congestion and waste of energy. As of the twenty-fi rst century begins, the automobile accounts for about 80 percent of the total oil consumption in developed countries.
The second half of the twentieth century has seen a major shift in car production (Figure 1.13). In 1950, the United Statesaccounted for more than 80 percent of global car production. However, this share declined to about 9.6 percent in 2004, refl ecting the loss of competitiveness of the American car manufacturing system. The United States, even if it represents the largest car market in the world, has been thoroughly motorized, which means that its market is mainly one of replacement with acute competition between manufacturers for market share. Roughly the same number of cars was produced in the United States during the 1990s than during the 1950s. In the 1960s, two major players in the car industry emerged, Japan and Germany. They respectively accounted for 19.7 percent and 11.7 percent of global car production in 2004. A growing proportion of cars are being manufactured in newly industrialized countries, but the main consumption market still remains the developed world, under the control of American, Japanese and German car manufacturers.
The current period is also one of transport crises, mainly because of a dual dependency. First, transportation modes have a heavy dependence on fossil fuels and second, road transportation has assumed dominance. The oil crisis of the early 1970s, which saw a signifi cant increase in fuel prices, induced innovations in transport modes, the reduction of energy consumption and the search for alternative sources of energy (electric car, adding ethanol to gasoline and fuel cells). However, from the mid-1980s to the end of the 1990s, oil prices declined and attenuated the importance of these initiatives.
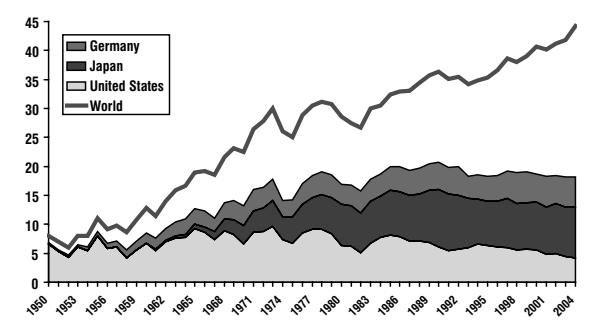
Figure 1.13 Automobile production, United States, Japan and Germany, 1950–2004 (in millions) Source: Worldwatch Institute; International Organization of Motor Vehicle Manufacturers, http://www. oica.net
The reliance on fossil fuels continued unabated with a particularly strong growth of motorization in developing countries.
Future transportation
In the 200 years since the beginning of mechanized transportation, the capacity, speed, effi ciency and geographical coverage of transport systems has improved dramatically. These processes can be summarized as follows:
- Each mode, due to its geographical and technical specifi cities, was characterized by different technologies and different rates of innovation and diffusion. A transport innovation can thus be an additive/competitive force where a new technology expands or makes an existing mode more effi cient and competitive. It can also be a destructive force when a new technology marks the obsolescence and the demise of an existing mode, often through a paradigm shift.
- Technological innovation is linked with faster and more effi cient transport systems. This process implies a space–time convergence where a greater amount of space can be exchanged with lesser amount of time. The comparative advantages of space can thus be more effi ciently used.
- Technological evolution in the transport sector is linked with the phases of economic development of the world economy. Transportation and economic development are consequently interlinked as one cannot occur without the other.
Technological developments have two signifi cant consequences over transportation modes. The fi rst involves the emergence of new modes and the second concerns an improvement of their operational speeds (Figure 1.14). Many modes follow a similar pattern where a signifi cant growth of their operational speed takes place in their introduction phase. Once technical constraints are solved and modal networks expand, the operational speeds reach a threshold which remains until the mode becomes obsolete and is abandoned (stagecoaches, clipper ship s and liners) or a new technology is introduced and a new wave of technical improvements occurs (jet planes, high-speed train s).
Since the introduction of commercial jet planes, high-speed train networks and containers in the late 1960s, no signifi cant technological changes have impacted on passenger and freight transportsystems. The early twenty-fi rst century is an era of car and truck dependency, which tends to constrain the development of alternative modes of transportation, as most of the technical improvements aim at insuring the dominance of oilas a source of energy. However, with dwindling oil reserves, the end of the dominance of the internal combustion engine is approaching. As oil production is expected to peak by 2008–10 and then decline, energy prices are expected to soar, triggering the most important technological transition in transportation since the automobile. Among the most promising technologies are:
• Maglev. Short for magnetic levitation, a maglev system has the advantage of having no friction with its support and no moving parts, enabling to reach operational speeds of 500–600 km per hour (higher speeds are possible if the train circulates in a low pressure tube). This represents an alternative for passenger and freight land movements in the range of 75 to 1,000 km. Maglev improves from the existing technology of high-speed train networks which are limited to speeds of 300 km per hour. In fact, maglev is the fi rst fundamental innovation in railway transportation since the industrial revolution. The fi rst commercial maglev system opened in Shanghai in 2003 and has an operational speed of about 440 km per hour.
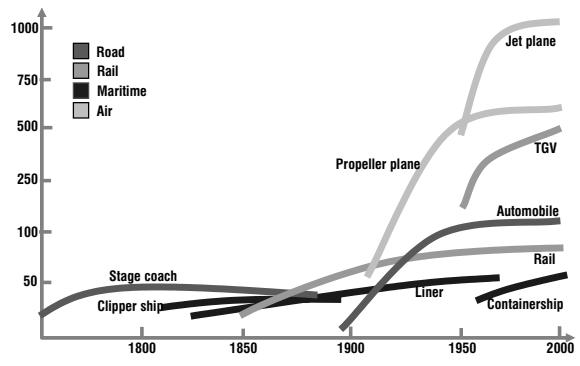
Figure 1.14 Development of operational speed for major transport modes, 1750–2000 (km per hour)
- Automated transport systems. Refers to a set of alternatives to improve the speed, effi ciency, safety and reliability of movements, by relying upon complete or partial automation of the vehicle, transshipment and control. These systems could involve the improvement of existing modes such as automated highway systems, of the creation of new modes and new transshipment systems such as for public transit and freight transportation. The goal of this initiative is mainly to use existing infrastructures effi ciently.
- Fuel cells. An electric generator using the catalytic conversion of hydrogenand oxygen. The electricity generated can be used for many purposes, such as supplying an electric motor. Current technological prospects do not foresee high output fuel cells, indicating they are applicable only to light vehicles, notably cars, or to small power systems. Nevertheless, fuel cells represent a low environmental impact alternative to generate energyand fuel cell cars are expected to reach mass production by 2010. Additional challenges in the use of fuel cells involve hydrogen storage (especially in a vehicle), as well as establishing a distribution system to supply the consumers.
A fundamental component of future transport systems, freight and passengers alike, is that they must provide increased fl exibility and adaptability.
Method 1 – The notion of accessibility
Defi nition
Accessibility is a key element to transport geography, and to geography in general, since it is a direct expression of mobility either in terms of people, freight or information. Well-developed and effi cient transportation systems offer high levels of accessibility (if the impacts of congestion are excluded), while less-developed ones have lower levels of accessibility. Thus accessibility is linked with an array of opportunities, economic and social.
Accessibility is defi ned as the measure of the capacity of a location to be reached by, or to reach different locations. Therefore, the capacity and the structure of transport infrastructure are key elements in the determination of accessibility .
All places are not equal because some are more accessible than others, which implies inequalities. The notion of accessibility consequently relies on two core concepts:
- The fi rst is location where the relativity of places is estimated in relation to transport infrastructures, since they offer the mean to support movements.
- The second is distance, which is derived from the connectivity between locations. Connectivity can only exist when there is a possibility to link two locations through transportation. It expresses the friction of space (or deterrence) and the location which has the least friction relative to others is likely to be the most accessible. Commonly, distance is expressed in units such as in kilometers or in time, but variables such as cost or energy spent can also be used.
There are two spatial categories applicable to accessibilityproblems, which are interdependent:
- The fi rst type is known as topological accessibility and is related to measuring accessibility in a system of nodes and paths (a transportation network ). It is assumed that accessibility is a measurable attribute signifi cant only to specifi c elements of a transportation system, such as terminals (airports, ports or subway stations).
- The second type is know as contiguous accessibility and involves measuring accessibility over a surface. Under such conditions, accessibility is a measurable attribute of every location, as space is considered in a contiguous manner.
Last, accessibility is a good indicator of the underlying spatial structure since it takes into consideration location as well as the inequality conferred by distance. Due to different spatial structures, two different locations of the same importance will have different accessibilities. On example A of Figure 1.15, representing a spatial structure where locations are uniformly distributed, locations 1 and 2 have different accessibilities, with location 1 being the most accessible. As distance (Euclidean) increases, location 1 has access to a larger number of locations than location 2. To access all locations, location 2 would require a longer traveled distance (roughly twice) than location 1. This is particularly the case when the spatial structure is one concentrated around location 1 (Example B). In this case, the number of locations that can be reached by location 1 climbs rapidly and then eventually peaks. The third example (C) has a spatial structure with roughly two foci. Although the number of locations that can be reached from location 2 initially climbs faster than for location 1, location 1 catches up and is actually the most accessible, but by a smaller margin.
Connectivity
The most basic measure of accessibilityinvolves network connectivity where a network is represented as a connectivity matrix (*C*1), which expresses the connectivity of each node with its adjacent nodes. The number of columns and rows in this matrix is equal to the number of nodes in the network and a value of 1 is given for each cell where this is a connected pair and a value of 0 for each cell where there is an unconnected pair. The
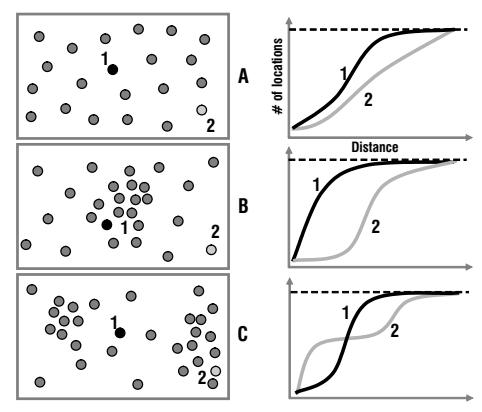
Figure 1.15 Accessibility and spatial structure
summation of this matrix provides a very basic measure of accessibility, also known as the degree of a node:
$$C1 = \sum{j}^{n} c{ij}$$
- *C*1 = degree of a node.
- cij = connectivity between node i and node j (either 1 or 0).
- n = number of nodes.
The network on Figure 1.16 can be represented as a connectivity matrix, which is rather simple to construct. The size of the connectivity matrix involves a number of rows and cells equivalent to the number of nodes in the network. Since the network on Figure 1.16 has fi ve nodes, its connectivity matrix is a 5 × 5 grid. Each cell representing a connection between two nodes receives a value of 1 (e.g. cell B–A). Each cell that does not represent a connection gets a value of 0 (e.g. cell D–E). If all connections in the network are bi-directiona, the connectivity matrix is transposable. Adding up a row or a column gives the degree of a node. Node C is obviously the most connected since it has the highest summation of connectivity compared to all other nodes. However, this assumption may not hold true on a more complex network because of a larger number of indirect paths which are not considered in the connectivity matrix. The connectivity matrix does not take into account all the possible indirect paths between nodes. Under such circumstances, two nodes could have the same degree, but may have different accessibilities.
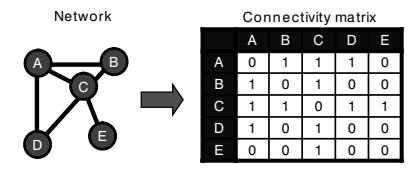
Figure 1.16 Connectivity matrix
Geographic and potential accessibility
From the accessibilitymeasure developed so far, it is possible to derive two simple and highly practical measures, defi ned as geographic and potential accessibility. Geographic accessibility considers that the accessibility of a location is the summation of all distances between other locations divided by the number of locations.
$$A(G) = \sum{i}^{n} \left( \sum{j}^{n} d_{ij} \right) / n$$
- A(G) = geographical accessibility matrix.
- dij = shortest path distance between location i and j.
- n = number of locations.
In this measure of accessibility , the most accessible place has the lowest summation of distances. As shown on Figure 1.17, the construction of a geographic accessibility matrix, A(G), is a rather simple undertaking. First, build a matrix containing the shortest distance between the nodes (node A to node E), here labeled as the L matrix. Second, build the geographic accessibility matrix A(G) with the summation of rows and columns divided by the number of locations in the network. The summation values are the same for columns and rows since this is a transposable matrix. The most accessible place is node C, since it has the lowest summation of distances.
Although geographic accessibility can be solved using a spreadsheet (or manually for simpler problems), Geographic Information Systems have proven to be a very useful and fl exible tool to measure accessibility, notably over a surface simplifi ed as a matrix (raster representation). This can be done by generating a distance grid for each place and then summing all the grids to form the total summation of distances (Shimbel) grid. The cell having the lowest value is thus the most accessible place.
Potential accessibility is a more complex measure than geographic accessibility, since it includes the concept of distance weighted by the attributes of a location. All locations are not equal and thus some are more important than others. Potential accessibility can be measured as follows:
$$A(P) = \sum_{i}^{\infty} Pi + \sum{j}^{\infty} Pj / d{ij}$$
- A(P) = potential accessibility matrix.
- dij = distance between place i and j (derived from valued graph matrix).
- Pj = attributes of place j, such as its population, retailing surface, parking space, etc.
- n = number of locations.
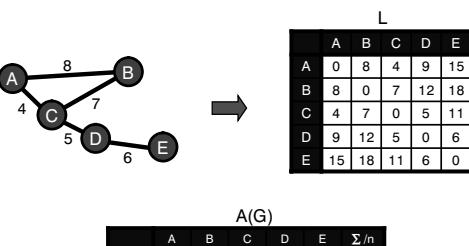
| A | B | C | D | E | ∑ /n | |
|---|---|---|---|---|---|---|
| A | 0 | 8 | 4 | 9 | 15 | 7.2 |
| B | 8 | 0 | 7 | 12 | 18 | 9.0 |
| C | 4 | 7 | 0 | 5 | 11 | 5.4 |
| D | 9 | 12 | 5 | 0 | 6 | 6.4 |
| E | 15 | 18 | 11 | 6 | 0 | 10.0 |
| ∑ /n | 7.2 | 9.0 | 5.4 | 6.4 | 10.0 | 38.0 |
Figure 1.17 Geographic accessibility
The potential accessibility matrix is not transposable since locations do not have the same attributes, which brings the underlying notions of emissiveness and attractiveness:
- Emissiveness is the capacity to leave a location, the sum of the values of a row in the A(P) matrix.
- Attractiveness is the capacity to reach a location, the sum of the values of a column in the A(P) matrix.
By considering the same shortest distance matrix (L) as on Figure 1.17 and the population matrix P, the potential accessibilitymatrix, P(G), can be calculated (Figure 1.18). The value of all corresponding cells (A–A, B–B, etc.) equals the value of their respective attributes (P). The value of all non-corresponding cells equals their attribute divided by the corresponding cell in the L matrix. The higher the value, the more a location is accessible, node C being the most accessible. The matrix being non-transposable, the summation of rows is different from the summation of columns, bringing forward the issue of implying different levels of attractiveness and emissiveness. Node C has more attractiveness than emissiveness (2525.7 versus 2121.3), while Node B has more emissiveness than attractiveness (1358.7 versus 1266.1). Likewise, a Geographic Information System can be used to measure potential accessibility, notably over a surface.
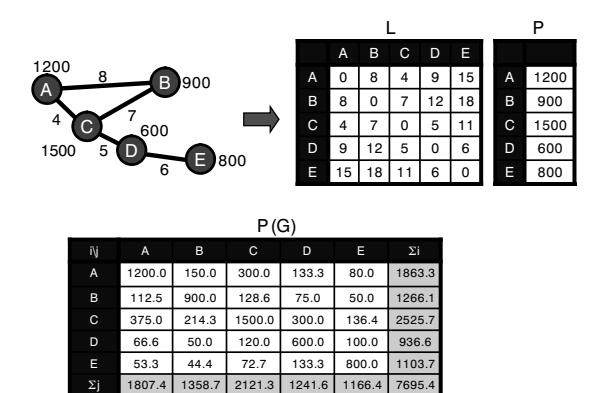
Figure 1.18 Potential accessibility
Method 2 – Geographic information systems for transportation (GIS-T )
Introduction
In a broad sense a geographic information system (GIS) is an information system specializing in the input, storage, manipulation, analysis and reporting of geographical (spatially related) information. Among the wide range of potential applications GIS can be used for, transportation issues have received a lot of attention. A specifi c branch of GIS applied to transportation issues, commonly labeled as GIS-T , has emerged.
Geographic information systems for transportation (GIS-T) refers to the principles and applications of applying geographic information technologies to transportation problems.
The four major components of a GIS, encoding, management, analysis and reporting, have specifi c considerations for transportation (Figure 1.19):
- Encoding. Deals with issues concerning the representation of a transport system and its spatial components. To be of use in a GIS, a transport networkmust be correctly encoded, implying a functional topology composed of nodes and links. Other elements relevant to transportation, namely qualitative and quantitative data, must also be encoded and associated with their respective spatial elements. For instance, an encoded road segment can have data related to its width, number of lanes, direction, peak hour traffi c, etc.
- Management. The encoded information is stored in a fi le structure and can be organized along spatial (by region, country, census bloc, etc.), thematic (for road,
1 Dr Shih-Lung Shaw (University of Tennessee) is the major contributor of this section.
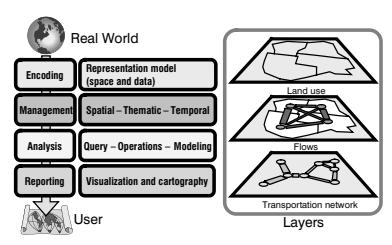
Figure 1.19 Geographic information systems and transportation
transit, terminals, etc.) or temporal (by year, month, week, etc.) considerations. This process is commonly automatic and has established conventions. For instance, many government agencies use specifi c fi le formats and deploy their information along predetermined spatial (their jurisdiction), thematic (their fi eld of interest) and temporal (their frequency of data collection) considerations.
- Analysis. Considers the wide array of tools and methodologies available for transport issues. They can range from a simple query over an element of a transport system (what is the peak hour traffi c of a road segment?) to a complex model investigating the relationships between its elements (if a new road segment was added, what would be the impacts on traffi c and future land use developments?).
- Reporting. A GIS would not be complete without all its visualization and cartographic capabilities. This component is particularly important as it gives the possibility to convey complex information in a symbolic format. A GIS-Tthus becomes a tool to inform and convince actors who otherwise may not have the time or the capability for non-symbolic data interpretation.
Information in a GIS is often stored and represented as layers, which are a set of geographical features linked with their attributes. On Figure 1.19 a transport system is represented as three layers related to land use , fl ows (spatial interaction s) and the network. Each has its own features and related data.
GIS-T research can be approached from two different, but complementary, directions. While some GIS-T research focuses on issues of how GIS can be further developed and enhanced in order to meet the needs of transportation applications, other GIS-T research investigates the questions of how GIS can be used to facilitate and improve transportation studies. In general, topics related to GIS-T studies can be grouped into three categories:
- Data representations. How can various components of transport systems be represented in a GIS-T ?
- Analysis and modeling. How can transport methodologies be used in a GIS-T ?
- Applications. What types of applications are particularly suitable for GIS-T ?
GIS-Tdata representations
Data representation is a core research topic of GIS. Before a GIS can be used to tackle real world problems, data must be properly represented in a digital computing environment.
One unique characteristic of GIS is the capability of integrating spatial and nonspatial data in order to support both display and analysis needs. There have been various data models developed for GIS. The two basic approaches are object-based data models and fi eld-based data models.
- An object-based data model treats geographic space as populated by discrete and identifi able objects. Features are often represented as points, lines, and/or polygons.
- On the other hand, a fi eld-based data model treats geographic space as populated by real-world features that vary continuously over space. Features can be represented as regular tessellations (e.g. a raster grid) or irregular tessellations (e.g. a triangulated irregular network – TIN).
Representing the "real world" in a data model has been a challenge for GIS since their inception in the 1960s. A GIS data model enables a computer to represent real geographical elements as graphical elements. As shown on Figure 1.20, two representational models are possible: raster (grid-based) and vector (line-based):
- Raster. Based on a cellular organization that divides space into a series of units. Each unit is generally similar in size to another. Grid cells are the most common raster representation. Features are divided into cellular arrays and a coordinate (X,Y) is assigned to each cell, as well as a value. This allows for registration with a geographic reference system. A raster representation also relies on tessellation: geometric shapes that can completely cover an area. Although many shapes are possible (triangles and hexagons), the square is the most commonly used. The problem of resolution is common to raster representations. For a small grid, the resolution is coarse but the required storage space is limited. For a large grid the resolution is fi ne, but at the expense of a much larger storage space. On Figure 1.20, the real world (shown as an aerial photograph) is simplifi ed as a grid where each cell color relates to an entity such as road, highway and river.
- Vector. The concept assumes that space is continuous, rather than discrete, which gives an infi nite (in theory) set of coordinates. A vector representation is composed of three main elements: points, lines and polygons. Points are spatial objects with no area but can have attached attributes since they are a single set of coordinates (X and Y) in a coordinate space. Lines are spatial objects made up of connected points (nodes) that have no width. Polygons are closed areas that can be made up of a circuit of line segments. On Figure 1.20, the real world is represented by a series of lines (roads and highway) and one polygon (the river).
GIS-T studies have employed both object-based and fi eld-based data models to represent the relevant geographic data. Some transportation problems tend to fi t better with one type of GIS data model than the other. For example, network analysis based on the graph theorytypically represents a network as a set of nodes interconnected with a set of links. The object-based GIS data model therefore is a better candidate for such transportation networkrepresentations. Other types of transportation data exist which require extensions to the general GIS data models. One well-known example is linear referencing data (e.g. highway mileposts). Transportation agencies often measure locations of features or events along transportation network links (e.g. a traffi c accident occurred at the 52.3 milepost on a specifi c highway). Such a one-dimensional linear referencing system (i.e. linear measurements along a highway segment with respect to a pre-specifi ed starting point of the highway segment) cannot be properly handled
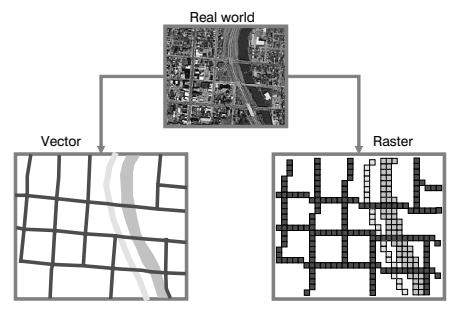
Figure 1.20 GIS data models
by the two-dimensional Cartesian coordinate system used in most GIS data models. Consequently, the dynamic segmentation data model was developed to address this specifi c need of the GIS-T community. Origin-destination (O-D) fl ow data are another type of data that are frequently used in transportation studies. Such data have been traditionally represented in matrix forms (i.e. as a two-dimensional array in a digital computer) for analysis. Unfortunately, the relational data model widely adopted in most commercial GIS software does not provide adequate support for handling matrix data. Some GIS-T software vendors therefore have developed additional functions for users to work with matrix data within an integrated GIS environment. The above examples illustrate how the conventional GIS approaches can be further extended and enhanced to meet the needs of transportation applications.
In recent years, the development of enterprise and multidimensional GIS-T data models has occurred. Successful GIS deployments at the enterprise level (e.g. within a state department of transportation) demand additional considerations to embrace the diversity of application and data requirements. An enterprise GIS-T data model is designed to allow "each application group to meet the established needs while enabling the enterprise to integrate and share data". The needs of integrating 1-D, 2-D, 3-D, and time for various transportation applications also have called for the implementation of multidimensional transportation location referencing systems.
In short, one critical component of GIS-T is how transportation-related data in a GIS environment can be best represented in order to facilitate and integrate the needs of various transportation applications. Existing GIS data models provide a good foundation of supporting many GIS-T applications. However, due to some unique characteristics of transportation data, many challenges still exist of developing better GIS data models that will improve rather than limit what we can do with different types of transportation studies.
GIS-Tanalysis and modeling
GIS-T applications have benefi ted from many of the standard GIS functions (query, geocoding, buffer, overlay, etc.) to support data management, analysis, and visualization needs. Like many other fi elds, transportation has developed its own unique analysis methods and models. Examples include shortest path and routing algorithms (e.g. traveling salesman problem, vehicle routing problem), spatial interaction models (e.g.
gravity model ), network fl ow problems (e.g. user optimal equilibrium, system optimal equilibrium, dynamic equilibrium), facility location problems (e.g. p-median problem, set covering problem, maximal covering problem, p-centers problem), travel demand models (e.g. the four-step trip generation, trip distribution, modal split , and traffi c assignment models), and land use –transportation interaction models.
While the basic transportation analysis procedures (e.g. shortest path fi nding) can be found in most commercial GIS software, other transportation analysis procedures and models (e.g. facility location problems) are available only selectively in some commercial software packages. Fortunately, the recent trend of moving towards component GIS design in the software industry provides a better environment for experienced GIS-T users to develop their own custom analysis procedures and models.
It is essential for both GIS-T practitioners and researchers to have a thorough understanding of transportation analysis methods and models. For GIS-T practitioners, such knowledge can help them evaluate different GIS software products and choose the one that best meets their needs. It also can help them select appropriate analysis functions available in a GIS package and properly interpret the analysis results. GIS-T researchers, on the other hand, can apply their knowledge to help improve the design and analysis capabilities of GIS-T.
GIS-Tapplications
GIS-T is one of the leading GIS application fi elds. Many GIS-T applications have been implemented at various transportation agencies over the last two decades. They cover much of the broad scope of transportation, such as infrastructure planning, design and management, transportation safety analysis, travel demand analysis, traffi c monitoring and control, public transit planning and operations, environmental impacts assessment, hazards mitigation, and intelligent transportation systems (ITS). Each of these applications tends to have its specifi c data and analysis requirements. For example, representing a street network as centerlines and major intersections may be suffi cient for a transportation planning application. A traffi c engineering application, however, may require a detailed representation of individual traffi c lanes. Turn movements at intersections also could be critical to a traffi c engineering study, but not to a regionwide travel demand study. These different application needs are directly relevant to the GIS-T data representation and the GIS-T analysis and modeling issues discussed above. When a need arises to represent transportation network s of a study area at different scales, what would be an appropriate GIS-T design that could support the analysis and modeling needs of various applications? In this case, it may be preferable to have a GIS-T data model that allows multiple geometric representations of the same transportation network. Research on enterprise GIS-T data model and multidimensional, multimodal GIS-T data model discussed above aims at addressing these important issues of better integrating various GIS-T applications.
With the rapid growth of the Internet and wireless communications in recent years, a growing number of Internet-based and wireless GIS-T applications can be found. Such applications are especially common for ITS and for location-based services (LBS). Another trend observed in recent years is the growing number of GIS-T applications in the private sector, particularly for logistics applications. Since many businesses involve operations at geographically dispersed locations (e.g. supplier sites, distribution centers/ warehouses, retail stores, and customer sites), GIS-T can be useful tools for a variety of logistics applications. Again, many of these logistics applications are based on GIS-T analysis and modeling procedures such as the routing and the facility location problems.
GIS-Tis interdisciplinary in nature and has many possible applications. Transportation geographers, who have appropriate backgrounds in both geography and transportation, are well positioned to pursue GIS-T studies.
Bibliography
Adams, T.M., N.A. Koncz and A.P. Vonderohe (2001) Guidelines for the Implementation of Multimodal Transportation Location Referencing Systems, NCHRP Report 460, Transportation Research Board, National Research Council. Washington, DC: National Academy Press.
Ausubel, J.H. and C. Marchetti (2001) "The Evolution of Transportation", The Industrial Physicist, April/May, pp. 20–24. http://www.aip.org/tip/INPHFA/vol–7/iss–2/p20.pdf.
Banister, D. (2002) Transport Planning, 2nd edn, London: Spon.
Black, W. (2003) Transportation: A Geographical Analysis, New York: Guilford.
Bogart, D. (2004) "Turnpike Trusts and the Transportation Revolution in Eighteenth Century England", http://orion.oac.uci.edu/~dbogart/transportrev_oct13.pdf.
Butler, J.A. and K.J. Dueker (2001) "Implementing the Enterprise GIS in Transportation Database Design", Urban and Regional Information Systems Association (URISA) Journal, 13(1), 17–28.
Haggett, P. (2001) Geography: A Modern Synthesis, 4th edn, New York: Prentice Hall.
Harrington, R. (1999) "Transport: Then, Now, and Tomorrow", Royal Society of Arts Journal, vol. CXLVI, no. 5488. http://www.york.ac.uk/inst/irs/irshome/papers/carmen.htm.
Hoover, E.M. (1948) The Location of Economic Activity, New York: McGraw-Hill.
Hoyle, B. and R. Knowles (1998) "Transport Geography: An Introduction", in B. Hoyle and R. Knowles (eds) Modern Transport Geography, 2nd edn, London: Wiley, pp.1–12.
Hoyle, B. and J. Smith (1998) "Transport and Development: Conceptual Frameworks", in B. Hoyle and R. Knowles (eds) Modern Transport Geography, 2nd edn, London: Wiley, pp. 13–40.
Hugill, P.J. (1992) World Trade since 1431, Baltimore, MD: Johns Hopkins University Press.
Lo, C.P. and A.K.W. Yeung (2002) Concepts and Techniques of Geographic Information Systems, Upper Saddle River, NJ: Prentice Hall.
Merlin, P. (1992) Géographie des Transports, Que sais-je?, Paris: Presses Universitaires de France.
Miller, H.J. and S.L. Shaw (2001) Geographic Information Systems for Transportation: Principles and Applications, New York: Oxford University Press.
Rimmer, P. (1985) "Transport Geography", Progress in Human Geography, 10, 271–7.
Rioux, J.-P. (1989) La révolution industrielle, 1780–1880, Paris: Éditions du Seuil.
Shaw, S.L. (2002) Book Review: Geographic Information Systems in Transportation Research, Journal of Regional Science, 42(2), 418–21.
Taaffe, E.J., H.L. Gauthier and M.E. O'Kelly (1996) Geography of Transportation, 2nd edn, Upper Saddle River, NJ: Prentice Hall.
Thill, J.C. (ed.) (2000) Geographic Information Systems in Transportation Research, Oxford: Elsevier Science.
Tolley, R. and B. Turton (1995) Transport Systems, Policy and Planning: A Geographical Approach, Harlow: Longman.
Victoria Transport Policy Institute (2005) "Defi ning, Evaluating and Improving Accessibility", Transport Demand Management Encyclopedia, http://www.vtpi.org/tdm/tdm84.htm.
Williams, A. (1992) "Transport and the Future", in B.S. Hoyle and R.D. Knowles (eds) Modern Transport Geography, London: Belhaven Press, pp. 257–70.
2 Transportation systems and networks
Transportation systems are composed of a complex set of relationships between the demand, the locations they service and the networks that support movements. They are mainly dependent on the commercial environment from which are derived operational attributes such as transportation costs, capacity, effi ciency, reliability and speed. Such conditions are closely related to the development of transportation network s, both in capacity and in spatial extent. Transportation systems are also evolving within a complex set of relationships between transport supply, mainly the operational capacity of the network, and transport demand, the mobility requirements of a territory. This chapter consequently investigates the relationships between transportation networks and their spatial structure.
Concept 1 – Transportation and commercial geography
Trade and commercial geography
Economic systems are based on trade and transactions since specialization and effi ciency require interdependency. People trade their labor for a wage while corporations trade their output for capital. Trade is the transmission of a possession in return for a counterpart, generally money. The exchange involves a transaction and its associated fl ows of capital, information, commodities, parts, or fi nished products. All this necessitates the understanding of commercial geography .
Commercial geography investigates the spatial characteristics of trade and transactions in terms of their cause, nature, origin and destination. It leans on the analysis of contracts and transactions. From a simple commercial transaction involving an individual purchasing a product at a store, to the complex network of transactions maintained between a multinational corporation and its suppliers, the scale and scope of commercial geography varies signifi cantly.
Commercial geography is concerned with transactions (Figure 2.1). As each transaction involves movements of people, freight and information, there is a close relationship between the sphere of transactions (the geographical setting of transactions) and the sphere of circulation (the geographical setting of movements). This implies transaction costs and transportation costs. The main transaction costs are: 1) Search and information costs: costs related to fi nding the appropriate goods on the market, who has them and at what price. 2) Negotiation costs: costs involved in reaching an agreement with the other party to the transaction, the contract being the outcome. 3) Policing and enforcement costs: costs related to ensuring that both parties respect the terms of the contract and, if this is not the case, taking legal actions to correct the situation.

Figure 2.1 Commercial and transport geography
Trade, in terms of its origins and destinations, has a spatial logic. It refl ects the economic, social and industrial structure of the concerned markets, but also implies other factors such as transport costs, distance, political ties, exchange rates and the reciprocal economic advantages proponents get from trade. For trade to occur several conditions must be met:
- Availability. Commodities, from coal to computer chips, must be available for trade and there must be a demand for these commodities. In other terms, a surplus must exist at one location and a demand in another. A surplus can often be a simple matter of investment in production capabilities, such as building an assembly plant, or can be constrained by complex environmental factors like the availability of resources such as fossil fuels, minerals and agricultural products.
- Transferability. There are three major impediments to transferability, namely policy barriers (tariffs, custom inspections, quotas), geographical barriers (time, distance) and transportation barriers (the simple capacity to move the outcome of a transaction). Transport infrastructures, in allowing commodities to be moved from their origins to their destinations, favor the transferability of goods. Distance often plays an important role in trade, as does the capacity of infrastructures to route and to transship goods.
- Transactional capacity. It must be legally possible to make a transaction. This implies the recognition of a currency for trading and legislations that defi ne the environment in which transactions are taking place, such as taxation. In the context of a global economy , the transactional environment is very complex but is important in facilitating trade at the regional, national and international levels.
Once these conditions are met, trade is possible and the outcome of a transaction results in a fl ow. Three particular issues relate to the concept of fl ow:
- Value. Flows have a negotiated value and are settled in a common currency. The American dollar, which has become the major global currency, is used to settle and/ or measure many international transactions. Further, nations must maintain reserves of foreign currencies to settle their transactions and the relationship between the inbound and outbound fl ows of capital is known as the balance of payments. Although nations try to maintain a stable balance of payments, this is rarely the case.
- Volume. Flows have a physical characteristic, mainly involving a mass. The weight of fl ows is a signifi cant variable when trade involves raw materials such as petroleum
or minerals. However, in the case of consumption goods, weight has little signifi cance relative to the value of the commodities being traded. With containerization, a new unit of volume has been introduced: the TEU (Twenty-foot Equivalent Unit), which can be used to assess trade fl ows.
• Scale. Flows have a range which varies signifi cantly based on the nature of a transaction. While retailing transactions tend to occur at a local scale, transactions related to the operations of a multinational corporation are global in scale.
Tendencies in commercial geography
The contemporary commercial setting is marked by increasing free trade and profound technological, industrial and geopolitical changes. The liberalization of trade, as confi rmed by the implementation of the World Trade Organization, has given a strong impetus and a positive trend in the growth rate of world trade and industrial production. However, in a true free trade environment, regulatory agencies would not be required. In spite of attempts at deregulation, transactions and trade are prone to disputes, litigations and perceived imbalances concerning who benefi ts the most. Although these issues mainly apply to international trade , there are also situations where trade is constrained between the provinces/states of a nation.
In spite of globalization , much trade is still dominantly regional. An overview of world trade fl ows indicates that trade within regions is more signifi cant than trade between regions, but long distance trade is steadily growing. Figures indicate the increasing share of East Asia, especially China , in world trade, in terms of both exports and imports. Flows of merchandise have also been accompanied by a substantial growth in foreign direct investments. There is thus a remarkable reallocation of production capacities following changes in comparative advantages around the world. This trend goes in tandem with mergers and acquisitions of enterprises that are increasingly global in scope. The analysis of international trade thus reveals the need to adopt different strategies to adapt to this new trading environment. As production is being relocated, there is a continuous shift in emphasis in the structure of export and import of world economies.
Recent decades have seen important modifi cations in international trading fl ows (Figure 2.2). The bulk of international tradeoccurs within economic blocs, especially the European Union and NAFTA. Other signifi cant fl ows are between Asia/Pacifi c and
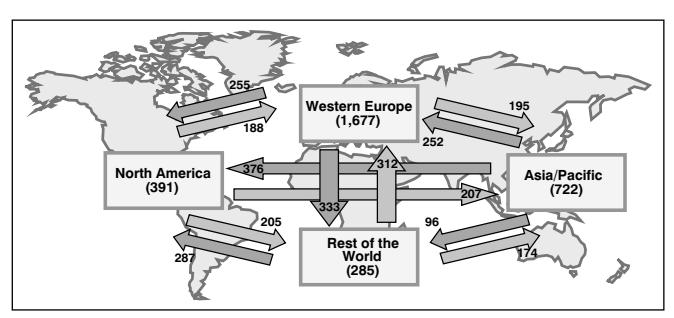
Figure 2.2 World trade fl ows, 2001 (billion \$US) (Source: WTO)
North America (especially the United States ), between Europe and North America and between Europe and Asia/Pacifi c. For several reasons, such as geographical proximity (Eastern Europe), energy (Middle East) and colonial legacy (Africa), the European Union has signifi cant trading linkages with the rest of the world. North America also maintains important trade linkages with Latin America. Another important characteristic of the contemporary commercial setting concerns imbalances in trade fl ows. For instance, it is clear on Figure 2.2 that the Asia/Pacifi c region exports more than it imports and that North America imports more than it exports.
Major changes have occurred in the organization of production. There is a noticeable increase in the division of labor concerning the design, planning and assembly in the manufacturing process of the global economy . Interlocking partnerships in the structure of manufacturing have increased the trade of parts and the supply of production equipment around the world. One-third of all trade takes place among parent companies and their foreign affi liates. Part of this dynamism resides in the adoption of standards, a process which began in the late nineteenth century to promote mass production. It permitted the rapid development of many sectors of activity, including railways, electricity, the automobile and the telecommunication industry more recently (Internet, Electronic Data Interchange). In the realm of globalization of economic activities, the International Standards Organization developed the ISO norms that serve as comparison between various enterprises around the world. These norms are applicable to the manufacturing and services industries and are a necessary tool for growth.
Another signifi cant force of change in commercial geographyimplies the growth of personal consumption, although this is not taking place uniformly. The bulk of consumption remains concentrated in a limited number of countries, with the G7 countries alone accounting for two-thirds of the global Gross Domestic Product. As a result, the commercial geography is infl uenced by the market size, the consumption level of an economy (often measured in GDP per capita), but also by the growth potential of different regions of the world. Economic growth taking place in East and Southeast Asia has been one of the most signifi cant forces shaping changes in the contemporary commercial environment. The commodifi cation of the economy has led to signifi cant growth in retail and wholesale and the associated movements of freight.
Commercialization of the transport industry
The liberalization of trade was accompanied by a growth of transportation since transactions involve movements of freight, capital, people and information. Developments in the transport sector are matched by global and regional interdependence and competition. Transportation, like commodities, products and services, is traded, sometimes openly and subject to full market forces, but more often subject to a form of public control or ownership. The core component of a transport-related transaction involves costs that either have to be negotiated between the provider of the service and the user or are subject to some arbitrary decree (price fi xing such as public transit). Since transportation can be perceived as a service to people, freight or information, its commercialization, how it is brought to the market, is an important dimension of its dynamics (Figure 2.3).
The extension of the operational scale of freight distribution insures that a production system reaches its optimal market potential, namely by a combination of strategies related to the exploitation of comparative advantages and a wider market base. Although an optimal market size can never be attained due to regulations preventing monopolies and differences in consumer preferences, the trend to insure maximal market exposure is unmistakable. The emergence of global brands and global production networks clearly
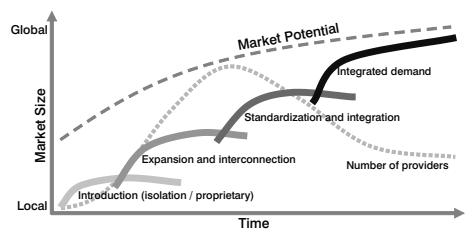
Figure 2.3 Commercialization of transportation
underlines this. Within freight distribution, four distinct cyclic phases of extension and functional integration can be identifi ed:
- Introduction. Initially, a transport system is introduced to service a specifi c opportunity in an isolated context. The technology is often "proprietary" and incompatible with other transport systems. Since they are not interconnected, this does not represent much of an issue.
- Expansion and interconnection. As the marketability and the development potential of a transport system becomes apparent, a phase of expansion and interconnection occurs. The size of the market serviced by these transport systems consequently increases as they become adopted in new locations. At some point, independently developed transport systems connect. This connection is however often subject to a function of transshipment between two incompatible transport systems.
- Standardization and integration. This phase often involves the emergence of a fully developed distribution system servicing vast national markets. The major challenge to be addressed involves a standardization of modes and processes, further expanding the commercial potential of the concerned supply chains. Modal fl ows are moving more effi ciently over the entire network and are able to move from one mode to another through intermodal integration. A process of mergers and acquisitions often accompanies this phase for the purpose of rationalization and market expansion.
- Integrated demand. The most advanced stage of extension of a distribution system involves a system that is fully able to answer freight mobility needs under a variety of circumstances, either predicted or unpredicted demand. As this system tends to be global, it commonly operates close to market potential. In such a setting, a distribution system expresses an integrated demand where the distribution capabilities are tuned to the demand in an interdependent system.
Each of these phases tends to be sequential and related to a historical process of transport development. For instance, up to the mid-nineteenth century, most distribution systems were isolated and developed independently from one another. Even global maritime transportwas fragmented by national fl ags and trading systems. As regional transport systems grew in the second half of the nineteenth century, they gradually interconnected, but moving from one system to another required a form of transshipment. By the early twentieth century, most national transport systems were integrated, but interconnection between modes was diffi cult. The next challenge resided in the development of intermodaltransportation, accelerated by containerization and information technologies.
One important component of the commercialization of transportation concerns investments in infrastructure, modes and terminals, as well as marketing. This task is performed either to expand the geographical extent and/or the capacity of a transport system or to maintain its operating conditions. The public and private sectors have contributed to the funding of transport investments depending on economic, social and strategic interests. For obvious reasons, the private sector seeks transport investments that promise economic returns while the public sector often invests for social and strategic reasons. In many cases private transport providers have diffi culty in acting independently to formulate and implement their transport investments. Various levels of government are often lobbied by transport fi rms for fi nancial and/or regulatory assistance in projects that are presented as of public interest and benefi t. The consolidation of regional markets and the resulting increase in transborder traffi c has led transport fi rms to seek global alliances and greater market liberalization in the transport and communication sector as a means to attract investments and to improve their productivity.
Deregulation and divestiture policy in the transport industry has led governments to withdraw from the management, operation and ownership of national carriers, ports and airports. This has given rise to a major reorganization of the international and national transport sectors with the emergence of transnational transport corporations that govern the global fl ow of air, maritime and land trade and the management of airports, ports and railyards (see Chapter 9).
Concept 2 – Transport costs
Transport costs and rates
Transport systems face requirements to increase their capacity and to reduce the costs of movements. All users (e.g. individuals, enterprises, institutions, governments, etc.) have to negotiate or bid for the transfer of goods, people, information and capital because supplies, distribution systems, tariffs, salaries, locations, marketing techniques as well as fuel costs are changing constantly. There are also costs involved in gathering information, negotiating, and enforcing contracts and transactions, which are often referred as the cost of doing business. Trade involves transaction costs that all agents attempt to reduce since transaction costs account for a growing share of the resources consumed by the economy.
Frequently, enterprises and individuals must take decisions about how to route passengers or freight through the transport system. This choice has been considerably expanded in the context of the production of lighter and high value consumer goods, such as electronics, and less bulky production techniques. It is not uncommon for transport costs to account for 20 percent of the total cost of a product. Thus, the choice of a transportation mode to route people and freight within origins and destinations becomes important and depends on a number of factors such as the nature of the goods, the available infrastructures, origins and destinations, technology, and particularly their respective distances. Jointly, they defi ne transportation costs.
Transport costs are a monetary measure of what the transport provider must pay to produce transportation services. They come as fi xed (infrastructure) and variable (operating) costs, depending on a variety of conditions related to geography, infrastructure, administrative barriers, energy, and on how passengers and freight are carried. Three major components, related to transactions, shipments and the friction of distance , impact on transport costs.
As shown on Figure 2.4, a movement between locations A and B involves three cost components in the assessment of its transport cost. The friction of distance represents how many units of space can be traded per unit of cost. Distance is a common attribute used to measure it. Shipment implies the mode used, the frequency as well as economies of scale.
Transport costs have signifi cant impacts on the structure of economic activities as well as on international trade . Empirical evidence underlines that raising transport costs by 10 percent reduces trade volumes by more than 20 percent. In a competitive environment where transportation is a service that can be bidded on, transport costs are infl uenced by the respective rates of transport companies, the portion of the transport costs charged to users.
Rates are the price of transportation services paid by their users. They are the negotiated monetary cost of moving a passenger or a unit of freight between a specifi c origin and destination. Rates are often visible to the consumers since transport providers must provide this information to secure transactions. They may not necessarily express the real transport costs.
The difference between costs and rates results in either a loss or a defi cit from the service provider. Considering the components of transport costs previously discussed, rate setting is a complex undertaking subject to constant change. For public transit, rates are often fi xed and the result of a political decision where a share of the total costs is subsidized by the society. The goal is to provide an affordable mobility to the largest possible segment of the population even if this implies a recurring defi cit (public transit systems rarely make any profi t). For freight transport ation and many forms of passenger transportation (e.g. air transportation ) rates are subject to a competitive pressure. This means that the rate will be adjusted according to the demand and the supply. They either refl ect costs directly involved with shipping (cost-of-service) or are determined by the value of the commodity (value-of-service).
Among the most signifi cant conditions affecting transport costs and thus transport rates are:
- Geography. Its impacts mainly involve distance and accessibility . Distance is commonly the most basic condition affecting transport costs. The more diffi cult it is to trade space for a cost, the more important is the friction of distance . The friction of distance can be expressed in terms of length, time, economic costs or the amount of energy used. It varies greatly according to the type of transportation mode involved and the effi ciency of specifi c transport routes. Landlocked countries tend to have higher transport costs, often twice as much, as they do not have direct access to maritime transport ation.
- Type of product. Many products require packaging, special handling, are bulky or perishable. Coal is obviously a commodity that is easier to transport than fresh
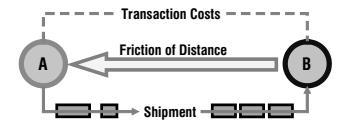
Figure 2.4 Components of transport costs
fl owers as it requires rudimentary storage facilities and can be transshipped using rudimentary equipment. Insurance costs are also to be considered and are commonly a function of the value to weight ratio and the risk associated with the movement. As such, different economic sectors incur different transport costs as they each have their own transport intensity. For passengers, comfort and amenities must be provided, especially if long distance travel is involved.
- Economies of scale. Another condition affecting transport costs is related to economies of scale or the possibilities to apply them as the larger the quantities transported, the lower the unit cost. Bulk commodities such as energy (coal, oil ), minerals and grains are highly suitable to obtain lower unit transport costs if they are transported in large quantities. A similar trend also applies to container shipping with larger containerships involving lower unit costs.
- Energy. Transport activities are large consumers of energy , especially oil . About 60 percent of all the global oil consumption is attributed to transport activities. Transport typically accounts for about 25 percent of all the energy consumption of an economy. The costs of several energy intensive transport modes, such as air transport, are particularly susceptible to fl uctuations in energy prices.
- Trade imbalances. Imbalances between imports and exports have impacts on transport costs. This is especially the case for container transportation since trade imbalances imply the repositioning of empty containers that have to be taken into account in the total transport costs. Consequently, if a trade balance is strongly negative (more imports than exports), transport costs for imports tend to be higher than for exports. The same condition applies at the national and local levels where freight fl ows are often unidirectional, implying empty movements.
- Infrastructures. The effi ciency and capacity of transport modes and terminals has a direct impact on transport costs. Poor infrastructures imply higher transport costs, delays and negative economic consequences. More developed transport systems tend to have lower transport costs since they are more reliable and can handle more movements.
- Mode. Different modes are characterized by different transport costs, since each has its own capacity limitations and operational conditions. When two or more modes are directly competing for the same market, the outcome often results in lower transport costs.
- Competition and regulation. This concerns the complex competitive and regulatory environment in which transportation takes place. Transport services taking place over highly competitive segments tend to be of lower cost than on segments with limited competition (oligopoly or monopoly). International competition has favored concentration in many segments of the transport industry, namely maritime and air modes. Regulations, such as tariffs, cabotage laws, labor and safety impose additional transport costs.
Types of transport costs
Mobility tends to be infl uenced by transport costs. Empirical evidence for passenger vehicle use underlines the relationship between annual vehicle mileage and fuel costs, implying the higher fuel costs are, the lower the mileage. At the international level, doubling of transport costs can reduce trade fl ows by more than 80 percent. The more affordable mobility is, the more frequent the movements and the more likely they will take place over longer distances. A wide variety of transport costs can be considered.
- Freight on board (FOB). The price of a good is the combination of the factory costs and the shippingcosts from the factory to the consumer. In the case of FOB, the consumer pays for the freight transport costs. Consequently, the price of a commodity will vary according to transportation costs and distance.
- Costs–Insurance–Freight (CIF). Considers the price of the good, insurance costs and transport costs. It implies a uniform delivered price for all customers everywhere, with no spatially variable shippingprice. The average shipping price is built into the price of a good. The CIF cost structure can be expanded to include several rate zones, such as one for local, another for the nation and another for exports.
- Terminal costs. Costs that are related to loading, transshipment and unloading. Two major terminal costs can be considered: loading and unloading at the origin and destination, which are unavoidable, and intermediate (transshipment) costs that can be avoided.
- Linehaul costs. Costs that are a function of the distance over which a unit of freight or passenger is carried. Weight is also a cost function when freight is involved. They commonly exclude transshipment costs.
- Capital costs. Costs applying to the physical assets of transportation, mainly infrastructures, terminals and vehicles. They include the purchase or major enhancement of fi xed assets, which can often be a one-time event. Since physical assets tend to depreciate over time, capital investments are required on a regular basis for maintenance.
With an FOB cost structure, customers located nearby will have a lower overall cost than customers that are further away (Figure 2.5). Under the CIF cost structure, every consumer is charged the same price, which commonly refl ects the average transport cost. Customers located close to production are "subsidizing" the costs paid by customers located further away. This price structure is common for consumer goods.
Real freight rates can be complicated to calculate for a transport company, especially when there are numerous customers. A common answer to this problem is to establish a set of geographic zones where freight rates are equal (Figure 2.6). The rate is commonly set through the CIF principle where the closest customers in a zone are partially subsidizing the furthest customers. For instance, under a zonal rate system a customer located at D1 pays the same rate as a customer located at D2. Under a distance-based system, the customer at D1 would have paid a lower rate than a customer located at D2. Many transit systems also use a zonal rate structure.
Transport providers make a variety of decisions based on their cost structure, a function of all the above types of transport costs. The role of transport companies has
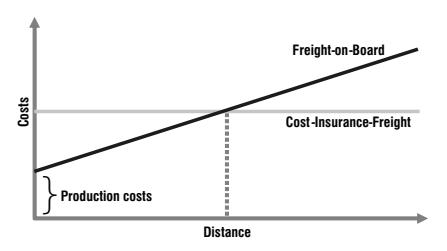
Figure 2.5 FOB and CIF transport costs
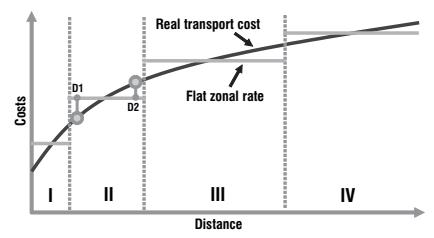
Figure 2.6 Zonal freight rates
sensibly increased in the general context of the global commercial geography . However, the nature of this role is changing as a result of reduction of transport costs but growing infrastructure costs, mainly due to greater fl ows and competition for land. Each transport sector must consider variations in the importance of different transport costs. While operating costs are high for air transport , terminal costs are signifi cant for maritime transport .
Technological changes and their associated decline in transport costs have weakened the links between transport modes and their terminals. There is less emphasis on heavy industries and more importance given to manufacturing and transport services (e.g. warehousing and distribution). Indeed, new functions are being grafted on to transport activities that are henceforward facilitating logistics and manufacturing processes. Relations between terminal operators and carriers have thus become crucial, notably in containerized traffi c. They are needed to overcome the physical and time constraints of transshipment, notably at ports.
The requirements of international tradegave rise to the development of specialized and intermediary fi rms providing transport services. These are fi rms that do not physically transport the goods, but are required to facilitate the grouping, storage and handling of freight as well as the complex paperwork and fi nancial and legal transactions involved in international trade. Examples included freight forwarders, customs brokers, warehousing, insurance agents and banking, etc. Recently, there has been a trend to consolidate these different intermediate functions, and a growing proportion of global trade is now being organized by multi-national corporations that are offering door-todoor logistics services.
Concept 3 – The geography of transportation networks
Transport networks
Transportation systems are commonly represented using networks as an analogy for their structure and fl ows.
The term network refers to the framework of routes within a system of locations, identifi ed as nodes. A route is a single link between two nodes that are part of a larger network that can refer to tangible routes such as roads and rails, or less tangible routes such as air and sea corridors.
The territorial structure of any region corresponds to a network of all its economic interactions. The implementation of networks, however, is rarely premeditated but the consequence of continuous improvements as opportunities arise and as conditions change. They result from the infl uence of various strategies, such as providing access and mobility to a region, and technological developments. A transport networkdenotes either a permanent track (e.g. roads, rails and canals) or a scheduled service (e.g. airline, transit, train). It can be extended to cover various types of links between points along which movements can take place.
In transport geography , it is common to identify several types of transport structures that are linked with transportation network s. Network structure ranges from centripetal to centrifugal in terms of the accessibilitythey provide to locations. A centripetal network favors a limited number of locations while a centrifugal network does not convey any specifi c locational advantages. Recent decades have seen the emergence of transport hubs, a strongly centripetal form, as a privileged network structure for many types of transport services, notably for air transportation . Although hub-and-spoke networks often result in improved network effi ciency, they have drawbacks linked with their vulnerability to disruptions and delays at hubs, an outcome of the lack of direct connections.
Hubs, as a network structure, allow a greater fl exibility within the transport system, through a concentration of fl ows. For instance, on Figure 2.7, a point-to-point network involves 16 independent connections, each to be serviced by vehicles and infrastructures. By using a hub-and-spoke structure, only 8 connections are required. The main advantages of hubs are:
- Economies of scale on connections by offering a high frequency of services. For instance, instead of one service per day between any two pairs in a point-to-point network, four services per day could be possible.
- Economies of scale at the hubs, enabling the potential development of an effi cient distribution system since the hubs handle larger quantities of traffi c.
- Economies of scope in the use of shared transshipment facilities. This can take several dimensions such as lower costs for the users as well as higher quality infrastructures.
Many transportation services have adapted to include a hub-and-spoke structure. The most common examples involve air passenger and freight services which have developed such a structure at the global, national and regional levels, such as those used by UPS, FedEx and DHL. However, potential disadvantages may also occur such
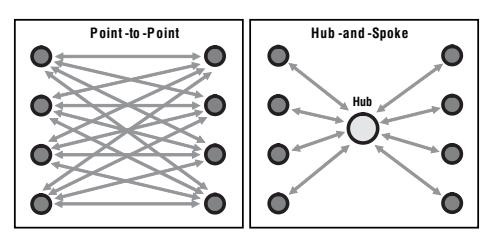
Figure 2.7 Transport networks
as additional transshipment as less point-to-point services are offered, which for some connections may involve delays and potential congestionas the hub becomes the major point of transshipment.
The effi ciency of a network can be measured through graph theory and network analysis. These methods rest on the principle that the effi ciency of a network depends partially on the lay-out of points and links. Obviously some network structures have a higher degree of accessibility than others, but careful consideration must be given to the basic relationship between the revenue and costs of specifi c transport network s. Rates thus tend to be infl uenced by the structure of transportation networks. Inequalities between locations can often be measured by the quantity of links between points and the related revenues generated by traffi c fl ows. Many locations within a network have better accessibility and higher opportunities. However, economic integration processes tend to change inequalities between regions. This in turn has impacted on the structure and fl ows of transportation networks at the transnational level (Figure 2.8).
Prior to economic integration processes (such as a free trade agreement) networks tended to service their respective national economies with fl ows representing this structure. With economic integration, the structure of transportation network s is modifi ed with new transnational linkages. Flows are also modifi ed. In some cases, there could be a relative decline of national fl ows and a comparative growth of transnational fl ows.
The typology and topology of networks
Transportation networks, like many networks, are generally embodied as a set of locations and a set of links representing connections between those locations. The arrangement and connectivity of a network is known as its topology. Each transport network has consequently a specifi c topology indicating its structure. The most fundamental elements of such a structure are the network geometry and the level of connectivity. Transport networks can be classifi ed in specifi c categories depending on a set of topological attributes that describe them. It is thus possible to establish a basic typology of a transport network that relates to its geographical setting, and its modal and structural characteristics.
There are many criteria that can be used to classify transportation network s (Figure 2.9). The level of abstraction can be considered with concrete network representations

Figure 2.8 Impacts of integration processes on networks and fl ows
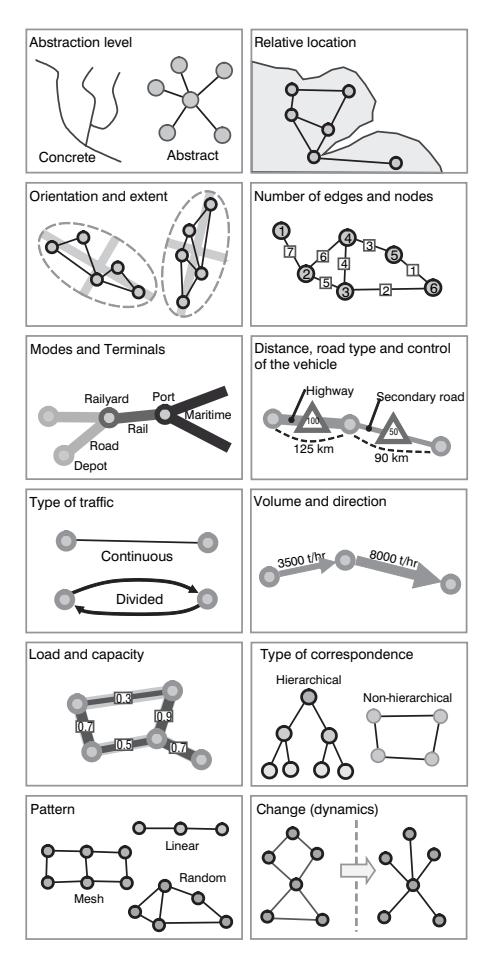
Figure 2.9 Typology of transportation networks
closely matching the reality (such as a road map) while conversely an abstract network would only be a symbolization of the nodes and fl ows (such as the network of an airline). Since transportation networks have a geographical setting, they can be defi ned according to their location relative to the main elements of a territory (such as the Rhine delta). Networks also have an orientation and an extent that approximates their geographical coverage or their market area. The numbers of nodes and edges are relevant to express the complexity and structure of transportation networks with a branch of mathematics, graph theory , developed to infer structural properties from these numbers. Since networks are the support of movements they can be considered from a modal perspective, their edges being an abstraction of routes (roads, rail links, maritime routes) and their nodes an abstraction of terminals (ports, railyards). Specifi c modes can further be classifi ed in terms of types of road (highway, road, street, etc.) and level of control (speed limits, vehicle restrictions, etc.). Flows on a network have a volume and a direction, enabling to rank links by their importance and evaluate the general direction of fl ows (e.g. centripetal or centrifugal). Each segment and network has a physical capacity related to the volume it can support under normal conditions. The load (or volume to capacity) is the relation between the existing volume and the capacity. The closer it is to a full load (a ratio of 1), the more congested it is. The structure of some networks imposes a hierarchy refl ecting the importance of each of its nodes and a pattern refl ecting their spatial arrangement. Finally, networks have a dynamic where both their nodes and links can change due to new circumstances.
Further, three types of spaces on which transport network s are evolving are found. Each of these spaces represents a specifi c mode of territorial occupation:
- Clearly defi ned and delimited. In this case the space occupied by the transport network is strictly reserved for its usage and can be identifi ed on a map. Ownership can also be clearly established. Major examples include road, canal and railway networks.
- Vaguely defi ned and delimited. The space of these networks may be shared with other modes and it is not the object of any particular ownership, only rights of way. Examples include air and maritime transportation networks.
- Without defi nition. The space has no tangible meaning, except for the distance it imposes. Little control and ownership are possible, but agreements must be reached for common usage. Examples are radio, television and cellular networks, which rely on specifi c frequencies granted by governing agencies.
Networks provide a level of transport service which is related to its costs. An optimal network would be a network servicing all possible locations but would have high capital and operational costs. Transport infrastructures are established over discontinuous networks. Therefore, operational networks are not servicing every part of the territory directly. Some compromise must often be found among a set of alternatives, considering a variety of route combinations and level of service.
Networks and space
Transportation networks illustrate the territorial organization of economic activities and the efforts incurred to overcome distance. These efforts can be measured in absolute (distance) or relative (time) terms and are proportional to the effi ciency and the structure of the networks they represent. The relationships that transportation network s establish with space are related to their continuity, their topographic space and the spatial control
they establish. The territory is a topological space with two or three dimensions, depending on the transport mode considered (road moves roughly over a two-dimensional space while air transport evolves over a three-dimensional space).
Figure 2.10 represents the same network topology but with different distance units of measurement between nodes. In an absolute context, distance in a network is a fi xed attribute that does not change. For instance, the straight distance between New York and Boston is about 310 km, which has not changed in time and will not change. The location of the elements of such a network is also absolute and fi xed. In a relative context, distance is a variable attribute that depends on numerous factors, such as technology, the mode being used and its effi ciency. Under such circumstances, some nodes of the network are "closer" than others. So, while it took about 44 hours to travel between New York and Boston in around 1800, this fi gure is just above an hour today using air travel.
However, fl ows and infrastructures are linear; they have one dimension since they conceptually link two points. The establishment of a network is thus a logical outcome for a one-dimensional feature to service a territory by forming a lattice of nodes and links. In order to have such a spatial continuity in a transport network , three conditions are necessary:
- Ubiquity. The possibility to reach any location from any other location on the network, thus providing a general access. Access can be a simple matter of vehicle ownership or bidding on the market to purchase a thoroughfare from one location to another.
- Fractionalization. The possibility for a traveler or a unit of freight to be transported without depending on a group. It becomes a balance between the price advantages of economies of scale and the convenience of a dedicated service.
- Instantaneity. The possibility to undertake transportation at the desired or most convenient moment. There is a direct relationship between fractionalization and instantaneity since the more fractionalized a transport system is, the more likely time convenience can be accommodated.
These three conditions are never perfectly met as some transport modes fulfi ll them better than others. For instance, the automobile is the most fl exible and ubiquitous mode for passenger transportation, but has important constraints such as low capacity and high levels of space and energyconsumption. In comparison, public transit is more limited in the spatial coverage of its service, implies batch movements (bus loads, train
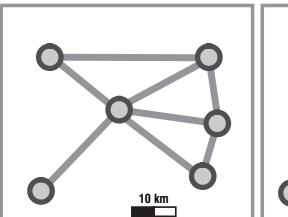
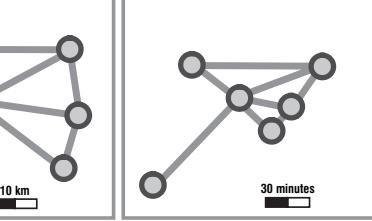
Figure 2.10 Absolute and relative distance in a network
loads, etc.) and follows specifi c schedules (limited instantaneity), but is more cost and energy effi cient. Freight transportation also varies in its spatial continuity, ranging from massive loads of raw materials (oil and ores) that can be handled only in a limited number of ports to highly fl exible parcel movements. Containerization has been a remarkable attempt to address the issue of ubiquity (the system permits intermodalmovements), fractionalization (each containeris a load unit) and instantaneity (units can be loaded by trucks at any time of the day and containerships make frequent port calls).
An important cause of discontinuity is linked to the spatial distribution of economic activities, notably industrial and urban, which tend to agglomerate. Congestion may also alter those conditions. Road congestion in a metropolitan area may impair ubiquity as some locations may be very diffi cult to reach since their accessibility is reduced. Fractionalization may also be reduced under such circumstances as people would consider public transit and carpooling and would thus move as batches. Further, as commuters cope with increasing congestion, several trips may be delayed or cancelled altogether, reducing instantaneity.
Transportation networks have always been a tool for spatial control and occupation. The Roman and Chinese empires relied on transportation networks to control their respective territories, mainly to collect taxes and move commodities and military forces. During the colonial era, maritime networks became a signifi cant tool of trade, exploitation and political control, which was later expanded by the development of modern transportation networks within colonies. In the nineteenth century, transportation networks also became a tool of nation building and political control. For instance, the extension of railwaysin the American hinterland had the purpose to organize the territory, extend settlements and distribute resources to new markets. In the twentieth century, road and highways systems (such as the Interstate system in the United States and the autobahn in Germany) were built to reinforce this purpose. For the early twentyfi rst century, telecommunication networks have become means of spatial cohesion and interactions.
Network expansion
As transport network s expand, existing transport infrastructures are being upgraded to cope with spatial changes. Airports and ports are being transformed, expanded or relocated. In the air transportsector, emphasis is being given to integrate airports within fully-fl edged multimodal transport systems, networking air with rail and road transport. In maritime transport , networks are also being modifi ed with increasing attention being paid to:
- Exploiting sea leg routes across the Arctic Ocean
- Expanding the Panama and Suez canals
- Increasing traffi c on inland maritime waterways
- Creating new inland passages between semi-enclosed or enclosed seas.
The growing competition between the sea and land corridors is not only reducing tariffs and encouraging international tradebut also prompting many governments to reassess their land-based connections and seek shorter transit routes.
Existing land routes are also being extended. Passages through extremely rigorous terrain are being investigated with a view to creating fully-fl edged land-based continental connections, notably through railways. These land network expansions are driven by economic globalization and inter-regional cooperation and eventually become multimodal
transcontinental corridors for rail, road, pipelines and trunk telecommunications routes. But the impact of increasing world trade on land network expansion, notably the railway transportation network,is scale specifi c. The expansion of railways has permitted interand intra-continental connections in the form of:
- Landbridges, a land movement across a continent linking origin and destination overseas
- Minibridges to cover movement linking two ends of a continent
- Microbridges covering traffi c from/to a port to an inland destination or origin.
Over the last twenty years, new rail routes in North America, Eurasia, Latin America and Africa trade routes have been developed or are being considered. There is scope for shippers to increase their trade through these new routes, particularly if rising insurance premiums, charter rates and shippingrisks prompt them to opt for a land route instead of the sea route through the Suezor Panama canal . These developments linked to the integration of regional economies to the world market are part of a rationalization and specialization process of rail traffi c presently occurring around the world. But the success of these rail network expansions depends on the speed of movement and the unitization of general cargo by containerization. Railways servicing ports tend more and more to concentrate on the movement of container traffi c. This strategy followed by some rail transport authorities allows on the one hand an increase in the delivery of goods, and on the other hand the establishment of door-to-door services through a better distribution of goods among different transport modes.
New arterial links are constructing and reshaping new trade channels, underpinning outward cargo movements and the distribution of goods. As some coastal gateways are now emerging as critical logisticsservice centers that rationalize distribution systems to fi t new trading patterns, the land network development and cross-border crossings throughout the world have far-reaching geopolitical implications.
Concept 4 – Transport supply and demand
Context
What are the differences between a Boeing 747, an oil tanker, a car and a bicycle? Many indeed, but they each share the common goal of fulfi lling a derived transport demand, and they thus all fi ll the purpose of supporting mobility. Transportation is a service that must be utilized immediately and thus cannot be stored. Mobility must occur over transport infrastructures, providing a transport supply. In several instances, transport demand is answered in the simplest means possible, notably by walking. However, in some cases elaborate and expensive infrastructures and modes are required to provide mobility, such as for international air transportation.
An economic system including numerous activities located in different areas generates movements that must be supported by the transport system. Without movements infrastructures would be useless and without infrastructures movements could not occur, or would not occur in a cost-effi cient manner. This interdependency can be considered according to two concepts:
• Transport supply. This is the expression of the capacity of transportation infrastructures and modes, generally over a geographically defi ned transport system and for a specifi c period of time. Therefore, supply is expressed in terms of infrastructures (capacity), services (frequency) and networks. The number of passengers, volume (for liquids or containerized traffi c), or mass (for freight) that can be transported per unit of time and space is commonly used to quantify transport supply.
• Transport demand. This is the expression of the transport needs, even if those needs are satisfi ed fully, partially or not at all. Similar to transport supply, it is expressed in terms of number of people, volume, or tons per unit of time and space.
Transport supply is generally expressed by Aij; the transport supply between locations i and j (Figure 2.11). Indirectly it combines modal supply, the capacity of a mode to support traffi c, and intermodal supply, the capacity to transship traffi c from one mode to the other. Transport demand is represented by Tij, which expresses the transport demand between locations i and j. The potential transport demand would be the amount of traffi c if transport costs were negligible. The realized transport demand, a subset of the potential transport demand, is the traffi c that actually takes place, namely in view of costs between the origins and the destinations.
There is a simple statistical way to measure transport supply and demand for passengers or freight:
The passenger-km (or passenger-mile) is a common measure expressing the realized passenger transport demand as it compares a transported quantity of passengers with a distance over which it gets carried. The ton-km (or ton-mile) is a common measure expressing the realized freight transport demand. Although both the passenger-km and the ton-km are most commonly used to measure realized demand, the measure can equally apply for transport supply.
For instance, the transport supply of a Boeing 747-400 fl ight between New York and London would be 426 passengers over 5,500 kilometers. This implies a transport supply of 2,343,000 passenger-km. In reality, there could be a demand of 450 passengers for that fl ight, or of 2,465,000 passenger-km, even if the actual capacity would be of only 426 passengers (if a Boeing 747-400 is used). In this case the realized demand would be 426 passengers over 5,500 kilometers out of a potential demand of 450 passengers, implying a system where demand is at 105 percent of capacity.
Transport demand is generated by the economy, which is composed of persons, institutions and industries and which generates movements of people and freight. When these movements are expressed in space they create a pattern which refl ects mobility and accessibility. The location of resources, factories, distribution centers and markets is obviously related to freight movements. Transport demand can vary under
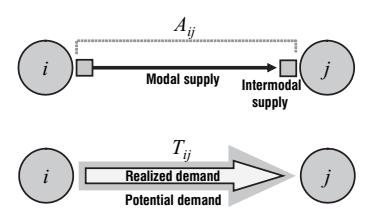
Figure 2.11 Transport supply and demand
two circumstances that are often concomitant: the quantity of passengers or freight increases or the distance over which these passengers or freight are carried increases. Geographical considerations and transport costs account for signifi cant variations in the composition of freight transportdemand between countries. For the movements of passengers, the location of residential, commercial and industrial areas tells a lot about the generation and attraction of movements.
The realized transport demand, expressed in passenger-km or ton-km, can increase for two reasons (Figure 2.12). The fi rst is obviously that more passengers or freight are being carried. This is an outcome of growth in population, production, consumption and income. The second is a growth in the average distance over which passengers or freight are being carried. Industrial relocation, economic specialization (factors linked with globalization ) and suburbanization are relevant factors behind this trend. These two factors often occur concomitantly: more passengers and freight being carried over longer distances.
Supply and demand functions
Transport supply can be simplifi ed by a set of functions representing the main variables infl uencing the capacity of transport systems. These variables are different for each mode. For road, rail and telecommunications, transport supply is often dependent on the capacity of the routes and vehicles (modal supply), while for air and maritime transportation transport supply is strongly infl uenced by the capacity of the terminals (intermodal supply).
- Modal supply. The supply of one mode infl uences the supply of others, such as for roads where different modes compete for the same infrastructure, especially in congested areas. For instance, transport supply for cars and trucks is inversely proportional since they share the same road infrastructure.
- Intermodal supply. Transport supply is also dependent on the transshipment capacity of intermodalinfrastructures. For instance, the maximum number of fl ights per day between Montreal and Toronto cannot be superior to the daily capacity of the airports of Montreal and Toronto, even though the Montreal–Toronto air corridor has potentially a very high capacity.
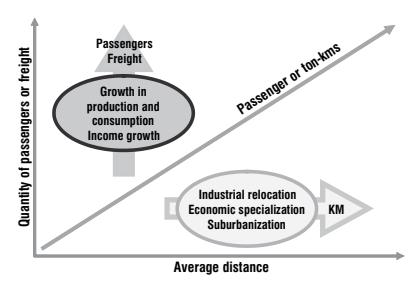
Figure 2.12 Growth factors in transport demand
Transport demand tends to be expressed at specifi c times that are related to economic and social activity patterns. In many cases, transport demand is stable and recurrent, which allows a good approximation in planning services. In other cases, transport demand is unstable and uncertain, which makes it diffi cult to offer an adequate level of service. For instance, commuting is a recurring and predictable pattern of movements, while emergency response vehicles such as ambulances are dealing with an unpredictable demand. Transport demand functions vary according to the nature of what is to be transported:
- Passengers. For the road and air transport of passengers, demand is a function of demographic attributes of the population such as income, age, standard of living, race and sex, as well as modal preferences.
- Freight. For freight transport ation, the demand is a function of the nature and the importance of economic activities (GDP, commercial surface, number of tons of ore extracted, etc.) and of modal preferences. Freight transportation demand is more complex to evaluate than passengers.
- Information. For telecommunications, the demand can be a function of several criteria including the population (telephone calls) and the volume of fi nancial activities (stock exchange). The standard of living and education levels are also factors to be considered.
Supply/demand relationships
Relationships between transport supply and demand continually change, but they are mutually interrelated. From a conventional economic perspective, transport supply and demand interact until an equilibrium is reached between the quantity of transportation the market is willing to use at a given price and the quantity being supplied for that price level.
Many transport systems behave in accordance with supply and demand, which are infl uenced by cost variations. In Figure 2.13 the demand curve assumes that if transport costs are high, demand is low as the consumers of a transport service (either freight or passengers) are less likely to use it. If transport costs are low, the demand would be high as users would get more services for the same cost. The supply curve behaves inversely. If costs are high, transport providers would be willing to supply high quantities of services since high profi ts are likely to arise under such circumstances. If costs are
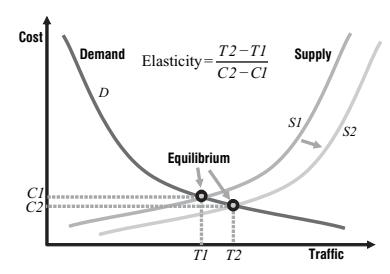
Figure 2.13 Classic transport demand/supply function
low, the quantity of transport services would be low as many providers would see little benefi t of operating at a loss.
The equilibrium point represents a compromise between what users are willing to pay and what providers are willing to offer. Under such circumstances, an amount of traffi c T1 would fl ow at an operating cost C1. If because of an improvement a larger amount of service is possible for the same cost (the supply curve moves from S1 to S2), a new equilibrium will be reached with a quantity of traffi c T2 at a price C2. Elasticity refers to the variation of the demand in accordance with the variation of the price. The higher it is, the more the traffi c in a transport system is infl uenced by costs variations.
However, several considerations are specifi c to the transport sector which complexify supply/demand relationships:
- Entry costs. These are the costs incurred to operate at least one vehicle in a transport system. In some sectors, notably maritime, rail and air transportation, entry costs are very high, while in others such as trucking, they are very low. High entry costs imply that transport companies will consider seriously the additional demand before adding new capacity or new infrastructures (or venturing in a new service). In a situation of low entry costs, the market sees companies coming in or dropping out, fl uctuating with the demand. Consequently, transport activities with high entry costs tend to be oligopolistic while transport activities with low entry costs tend to have many competitors.
- Public sector. Few other sectors of the economy have seen such a high level of public involvement than transportation, which creates many disruptions in conventional price mechanisms. The provision of transport infrastructures, especially roads, was massively funded by governments, namely for the sake of national accessibility and regional equity. Transit systems are also heavily subsidized, namely to provide accessibility to urban populations and more specifi cally to the poorest segment judged to be deprived in mobility. As a consequence, transport costs are often considered as partially subsidized. Government control (and direct ownership) was also signifi cant for several modes, such as rail and air transportation in a number of countries. Recent years have however been characterized by less governmental involvement and deregulation.
- Elasticity. Refers to the variation of demand in response to a variation of cost. For example, an elasticityof –0.5 for vehicle use with respect to vehicle operating costs means that an increase of 1 percent in operating costs would imply a 0.5 percent reduction in vehicle mileage or trips. Variations in transport costs have different consequences for different modes, but transport demand has a tendency to be inelastic. While commuting tends to be inelastic in terms of costs, it is elastic in terms of time. For economic sectors where freight costs are a small component of the total production costs, variations in transport costs have limited consequences on the demand. For air transportation, especially the tourism sector, price variations have signifi cant impacts on the demand.
The concept of elasticity is very useful to understand the economic behavior of transport supply and demand (Figure 2.14). Depending on the transport activity, a movement is linked with different elasticities. Emergencies tend to have low, if any, elasticity. Commuting also has a very low elasticity as this category of movements is related to a fundamental economic activity that provides income. This fact is underlined by empirical evidence which shows that drivers are marginally infl uenced by variations in the price of fuel in their commuting behavior, especially in highly motorized societies. Since work is a major, if not the only, source of income, commuting can simply not
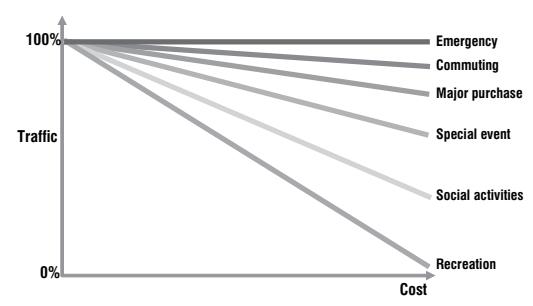
Figure 2.14 Transport elasticity by activity (Source: adapted from Victoria Transport Policy Institute 2002)
be forfeited under any circumstances short of being cost prohibitive. Activities that confer limited economic benefi ts tend to have high elasticities. Social and recreationoriented movements are commonly those whose users have the least cost tolerance. Consequently, as transport costs increase, recreational movements are those which experience the fastest decline.
Generally, transport demand is variable in time and space whereas transport supply is fi xed. When demand is lower than supply, transit times are stable and predictable, since the infrastructures are able to support the demand. When transport demand exceeds supply for a period in time, there is congestion with signifi cant increases in transit times and higher levels of unpredictability. A growth of the transport demand increases the load factor of a transport network until transport supply is reached. Speed and transit times drop afterwards. The same journey can thus have different durations according to the time of the day.
Method 1 – Defi nition and properties of graph theory
Basic graph defi nition
A graphis a symbolic representation of a network and of its connectivity. It implies an abstraction of the reality so it can be simplifi ed as a set of linked nodes.
Graph theory is a branch of mathematics concerned with how networks can be encoded and their properties measured.
The goal of a graphis to represent the structure, not the appearance of a network. The conversion of a real network into a planar graph is a straightforward process which follows some basic rules: 1) The most important rule is that every terminal and intersection point becomes a node. 2) Each connected node is then linked by a straight segment.
The outcome of this abstraction, as portrayed on Figure 2.15, is the actual structure of the network. The real network, depending on its complexity, may be confusing in terms of revealing its connectivity (what is linked with what). A graph representation
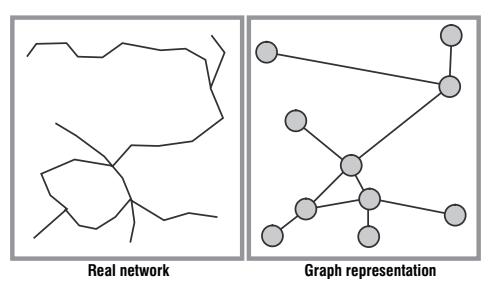
Figure 2.15 Graph representation of a real network
reveals the connectivity of a network in the best possible way. Other rules can also be applied, depending on the circumstances: 3) A node that is not a terminal or an intersection point can be added to the graph if along that segment an attribute changes. For instance, it would be recommended to represent as a node the shift from two lanes to four lanes along a continuous road segment, even if that shift does not occur at an intersection or terminal point. 4) A "dummy node" can be added for esthetical purposes, especially when it is required that the graph representation remains comparable to the real network. 5) Although the relative location of each node can remain similar to its real world counterpart (as in Figure 2.15), this is not required.
In transport geographymost networks have an obvious spatial foundation, namely road, transit and rail networks, which tend to be defi ned more by their links than by their nodes. This is not necessarily the case for all transportation network s. For instance, maritime and air networks tend to be defi ned more by their nodes than by their links since the links are often not clearly defi ned. A telecommunication system can also be represented as a network, while its spatial expression can have limited importance and would actually be diffi cult to represent. Mobile telephone networks or the Internet, possibly the most complex graphs to be considered, are relevant cases of networks having a structure that can be diffi cult to symbolize. However, cellular phones and antennas can be represented as nodes while the links could be individual phone calls. Servers, the core of the Internet, can also be represented as nodes within a graphwhile the physical infrastructure between them, namely fi ber optic cables, can act as links. Consequently, all transport networks can be represented by graph theory in one way or another.
The following elements are fundamental in understanding graph theory :
- Graph. A graph G is a set of vertexes (nodes) v connected by edges (links) e. Thus G = (v , e).
- Vertex (Node). A node v is a terminal point or an intersection point of a graph . It is the abstraction of a location such as a city, an administrative division, a road intersection or a transport terminal (stations, terminuses, harbors and airports).
- Edge (Link). An edge e is a link between two nodes. The link (i , j) is between initial extremity i and terminal extremity j. A link is the abstraction of a transport infrastructure supporting movements between nodes. It has a direction that is commonly represented as an arrow. When an arrow is not used, it is assumed the link is bi-directional.
The graph on Figure 2.16 has the following defi nition: G = (v, e); v = (1, 2, 3, 4, 5); e = (1, 2), (1, 3), (2, 2), (2, 5), (4, 2), (4, 3), (4, 5).
Sub-graph. A subset of a graph G where p is the number of sub-graphs. For instance *G*´ = (*v*´, *e*´ ) can be a distinct sub-graph of G. Unless the global transport system is considered as a whole, every transport network is in theory a sub-graph of another. For instance, the road transportation network of a city is a sub-graph of a regional transportation network, which is itself a sub-graph of a national transportation network.
Buckle. A link that makes a node correspond to itself.
Planar graph. A graph where every intersection of two edges is a vertex. Since this graph is located within a plane, its topology is two-dimensional.
Non-planar graph. A graph where there are no vertexes at the intersection of at least two edges. This implies a third dimension in the topology of the graph since there is the possibility of having a movement "passing over" another movement, such as for air transport. A non-planar graph has potentially many more links than a planar graph.
Links and their structures
A transportation networkenables fl ows of people, freight or information, which occur along links. Graph theory must thus offer the possibility of representing movements as linkages, which can be considered over several aspects:
- Connection. A set of two nodes. Considers if a movement between two nodes is possible, whatever its direction. Knowledge of the connections within a graph means it is possible to fi nd whether a node can be reached from another node .
- Path. A sequence of links that are traveled in the same direction. For a path to exist between two nodes, it must be possible to travel along an uninterrupted sequence of links. Finding all the possible paths in a graph is a fundamental attribute in measuring accessibility and traffi c fl ows.
On graph A of Figure 2.17 there are fi ve links [(1, 2), (2, 1), (2, 3), (4, 3), (4, 4)] and three connections [(1–2), (2–3), (3–4)]. On graph B, there is a path between 1 and 3, but on graph C there is no path between 1 and 3.
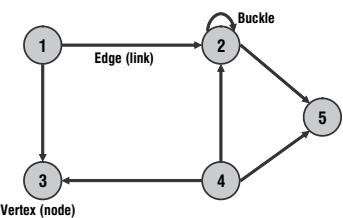
Figure 2.16 Basic graph representation of a transport network
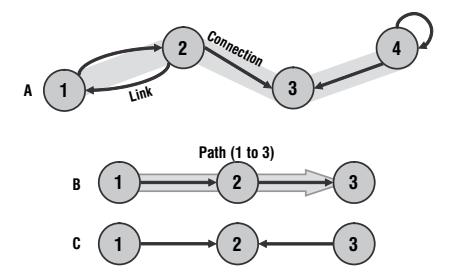
Figure 2.17 Connections and paths
Chain. A sequence of links having a connection in common with each other. Direction does not matter.
Length of a link, connection or path. Refers to the label associated with a link, a connection or a path. This label can be distance, the amount of traffi c, the capacity or any attribute of that link. The length of a path is the number of links (or connections) in this path.
Cycle. A chain where the initial and terminal node is the same and which does not use the same link more than once.
Circuit. A path where the initial and terminal node corresponds. It is a cycle where all the links are traveled in the same direction. Circuits are very important in transportation because several distribution systems use circuits to cover as much territory as possible in one direction (delivery route).
On the graph of Figure 2.18, 2–3–6–5–2 is a cycle but not a circuit. 1–2–4–1 is a cycle and a circuit.
Basic structural properties
The organization of nodes and links in a graphconvey a structure that can be labeled. The basic structural properties of a graph are:
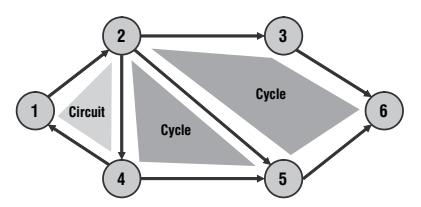
Figure 2.18 Cycles and circuits
- Symmetry and asymmetry. A graph is symmetrical if each pair of nodes linked in one direction is also linked in the other. By convention, a line without an arrow represents a link where it is possible to move in both directions. However, both directions have to be defi ned in the graph. Most transport systems are symmetrical but asymmetry can often occur as is the case for maritime (pendulum) and air services. Asymmetry is rare on road transportation network s, unless one-way streets are considered.
- Completeness. A graph is complete if two nodes are linked in at least one direction. A complete graph has no sub-graph.
- Connectivity. A complete graph is described as connected if for all its distinct pairs of nodes there is a linking chain. Direction is not important for a graph to be connected, but may be a factor for the level of connectivity. If p > 1 the graph is not connected because it has more than one sub-graph. There are various levels of connectivity, depending on the degree to which each pair of nodes is connected.
Two sub-graphs are complementary if their union results in a complete graph . Multimodal transportation network s are complementary as each sub-graph benefi ts from the connectivity of other sub-graphs.
- Root. A node r where every other node is the extremity of a path coming from r is a root. Direction is important. A root is generally the starting point of a distribution system, such as a factory or a warehouse.
- Trees. A connected graphwithout a cycle is a tree. A tree has the same number of links than nodes plus one (e = v – 1). If a link is removed, the graph ceases to be connected. If a new link between two nodes is provided, a cycle is created. A branch of root r is a tree where no links connect any node more than once.
- Articulation node. In a connected graph , a node is an articulation node if the subgraph obtained by removing this node is no longer connected. It therefore contains more than one sub-graph (p > 1). An articulation node is generally a port or an airport, or an important hub of a transportation network, which serves as a bottleneck.
- Isthmus. In a connected graph , an isthmus is a link that, when removed, creates two sub-graphs with at least one connection.
Method 2 – Measures and indices of graph theory
Measures
Several measures and indices can be used to analyze network effi ciency. Many of them were initially developed by Kansky (1963) and can be used for:
- Expressing the relationship between values and the network structures they represent
- Comparing different transportation networks at a specifi c point in time
- Comparing the evolution of a transport network at different points in time.
As well as the numbers of nodes and edges, three basic measures are used to defi ne the structural attributes of a graph : the diameter, the number of cycles and the order of a node.
Diameter (*d*). The length of the shortest path between the most distanced nodes of a graph is the diameter. d measures the extent of a graph and the topological length between two nodes.
The diameter enables to measure the development of a network in time. The greater the diameter, the less linked a network tends to be. In the case of a complex graph , the diameter can be found with a topological distance matrix (Shimbel distance), which computes the minimal topological distance for each node pair. Graphs in which the extent remains constant, but with a higher connectivity, have lower diameter values.
Number of cycles (*u*). The maximum number of independent cycles in a graph . This number (u) is estimated through the number of nodes (v), links (e) and sub-graphs (p): u = e – v + p.
For trees and simple networks u = 0 since they have no cycles. The more complex a network is, the higher the value of u, so it can be used as an indicator of the level of development and complexity of a transport system.
Order (degree) of a node (*o*). The number of attached links in a graph. This is a simple but effective measure of nodal importance. The higher its value, the more a node is important in a graphas many links converge to it. Hub nodes have a high order, while terminal points have an order that can be as low as 1. A perfect hub would have its order equal to the summation of all the orders of the other nodes in the graph and a perfect spoke would have an order of 1.
Indexes
Indexes are more complex methods to represent the structural properties of a graph since they involve the comparison of one measure over another.
Detour index. A measure of the effi ciency of a transport network in terms of how well it overcomes distance or the friction of space. The closer the detour index gets to 1, the more the network is spatially effi cient. Networks with a detour index of 1 are rarely, if ever, seen and most networks would fi t on an asymptotic curve getting close to 1, but never reaching it.
$$DI = \frac{DT}{DD}$$
For instance, the straight distance (DD) between two nodes may be 40 km but the transport distance (DT; real distance) is 50 km. The detour index is thus 0.8 (40/50). The complexity of the topography is often a good indicator of the level of detour.
Network density. Measures the territorial handhold of a transport network in terms of km of links (L) per square kilometer of surface (S). The higher it is, the more a network is developed.
Pi index. The relationship between the total length of the graph L(G) and the distance along its diameter D(d). It is called the pi index because of its similarity with the constant pi (3.14), which expresses the ratio between the circumference and the
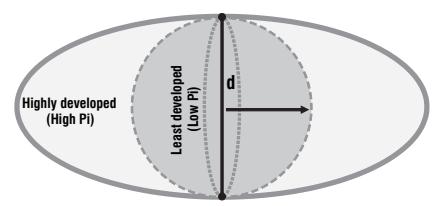
Figure 2.19 Pi index and the shape of transportation networks
diameter of a circle. A high index shows a developed network. It is a measure of distance per units of diameter and an indicator of the shape of a network.
Figure 2.19 provides an abstraction between the diameter (d; vertical axis) and length of the network (horizontal axis). A low pi index is linked with a low level of network development and a high pi index is linked with a more extensively developed network.
Eta index. Average length per link. Adding new nodes will cause the eta index to decrease as the average length per link declines.
$$\eta = \frac{L(G)}{e}$$
Theta index. Measures the function of a node, that is the average amount of traffi c per intersection. The higher theta is, the greater the load of the network.
$$\theta = \frac{Q(G)}{v}$$
Beta index. Measures the level of connectivity in a graph an d is expressed by the relationship between the number of links (e) over the number of nodes (v). Trees and simple networks have beta index values of less than 1. A connected network with one cycle has a value of 1. More complex networks have a value greater than 1. In a network with a fi xed number of nodes, the higher the number of links, the higher the number of paths possible in the network. Complex networks have a high beta index.
The four graphs of Figure 2.20 are of growing connectivity. Graphs A and B are not fully connected and their beta value is less than 1. Graph C is connected and has a beta value of 1. Graph D is even more connected with a beta value of 1.25.
Alpha index. A measure of connectivity which evaluates the number of cycles in a graph in comparison with the maximum number of cycles. The higher the alpha index, the more a network is connected. Trees and simple networks will have a value of 0. A value of 1 indicates a completely connected network. The alpha index measures the level of connectivity independently of the number of nodes. It is very rare for a network to have an alpha value of 1, because this would imply very serious redundancies.
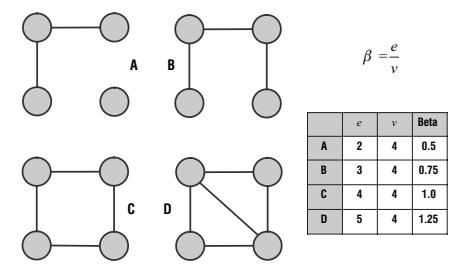
Figure 2.20 Beta index
The graphs of Figure 2.21 have a growing level of connectivity. While graph A has no cycles, graph D has the maximum possible number of cycles for a planar graph.
Gamma index (*g*). A measure of connectivity that considers the relationship between the number of observed links and the number of possible links. The value of gamma is between 0 and 1, where a value of 1 indicates a completely connected network and is extremely unlikely in reality. The gamma index is an effi cient way to measure the progression of a network in time.
The graphs of Figure 2.22 have a growing level of connectivity with graph D having the maximum number of links (10) and a gamma index of 1.0.
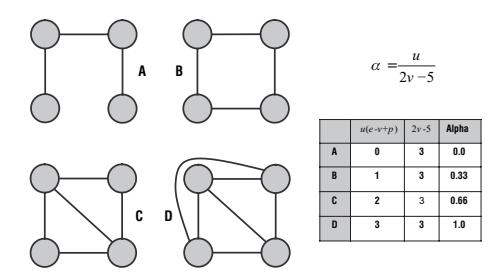
Figure 2.21 Alpha index
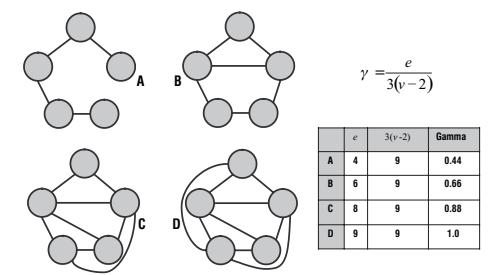
Figure 2.22 Gamma index
Method 3 – Network data models
Nature and utility
Graph theory gives a topological and mathematical representation of the nature and structure of transportation networks. However, graph theory ca n be expanded for the analysis of real world transport networks by encoding them in an information system. In the process, a digital representation of the network is created. This digital representation is highly complex, since transportation data is often multimodal, can span several local, national and international jurisdictions and has different logical views depending on the particular user.
It is thus becoming increasingly relevant to use a data model where a transportation network can be encoded, stored, retrieved, modifi ed, analyzed and displayed. Obviously, Geographic Information Systems have received a lot of attention over this issue since they are among the best tools to store and use network data models. Network data models are an implicit part of many GIS. There are four basic application areas of network data models:
• Topology. The core purpose of a network data model is to provide an accurate representation of a network as a set of links and nodes. Topology is the arrangement of nodes and links in a network. Of particular relevance are the representations of location, direction and connectivity. Even if graph theory ai ms at the abstraction of transportation networks, the topology of a network data model should be as close as possible to the real world structure it represents. This is especially true for the usage of network data models in a GIS.
Figure 2.23 represents the basic topology of an urban transport network co mposed of linked nodes. It has been encoded into a network data model to represent the reality as closely as possible, both topologically and geographically. Topologically, each node has been encoded with the connectivity it permits, such as whether a left turn is possible or not (although this attribute is not displayed here). Further, a direction has been encoded in each link (directional or bi-directional) to represent one-ways. Geographically, each node is located at a coordinate which matches, within a tolerated accuracy, the actual intersection it represents. In addition, the links between each node have been decomposed
into several segments (not implicitly shown) to respect the positional accuracy of the road they represent.
• Cartography. Allows the visualization of a transport network fo r the purpose of reckoning and simple navigation and serves to indicate the existence of a network. Different elements of the network can have a symbolism defi ned by some of their attributes. For instance, a highway link may be symbolized as a thick line with a label such as its number, while a street may be symbolized as an unlabeled simple line. The symbolized network can also be combined with other features such as landmarks to provide a better level of orientation to the user. This is commonly the case for road maps used by the general public.
By using attributes encoded in the network data model, such as road type, each segment can be displayed to refl ect its importance. For instance, the cartographic representation of a network data model on Figure 2.24 displays three road classes (highway, main street and street) differently. Descriptive labels for the most important elements and directional signs for one-ways have also been added. To enrich the cartographic message, additional layers of information have been added, namely landmarks (City Hall, Central Park and a college campus). Nodal attributes can also have a cartographic utility, such as displaying whether an intersection has traffi c lights.
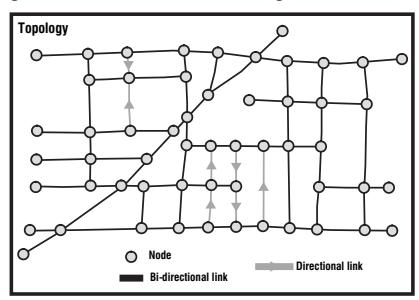
Figure 2.23 Topology of a network data model
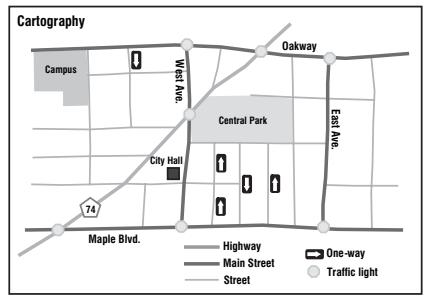
Figure 2.24 Cartography of a network data model
Geocoding. Transportation network models can be used to derive a precise location, notably through a linear referencing system. For instance, the great majority of addresses are defi ned according to a number and a street. If address information is embedded in the attributes of a network data model, it becomes possible to use this network for geocoding and to pinpoint the location of an address, or any location along the network, with reasonable accuracy. •
Geocoding is possible if a linear referencing system is embedded in a network data model. One of the most common linear referencing systems is the address system, where each link has a corresponding street name and address range. The address range of Figure 2.25 illustrates even (right side) and odd (left side) addresses, very common attributes in most network data models such as TIGER (developed by the US Census Bureau). For instance, fi nding the approximate location of the address "197 East Ave." would fi rst imply querying the network data model to fi nd all the links that have "East Ave." as a name attribute. Then, the appropriate address range is found and the location interpolated. "197" corresponds to the 191–209 address range, located on the left side of East Ave. Its approximate location would be at 1/3 [1 – (209 – 197)/(209 – 191)] of the length of the link that has the 191–209 address range. The same procedure can be applied to the address "188 East Ave.", which in this case would be located at 1/4 of the length of the link that has the 172–210 address range.
• Routing and assignment. Network data models may be used to fi nd optimal paths and assign fl ows with capacity constraints in a network. While routing is concerned with the specifi c behavior of a limited number of vehicles, traffi c assignment is mainly concerned with the system-wide behavior of traffi c in a transport network. This requires a topology in which the relationship of each link with other intersecting segments is explicitly specifi ed. Impedance measures (e.g. distance) are also attributed to each link and will have an impact on the chosen path or on how fl ows are assigned in the network. Routing and traffi c assignment at the continental level is generally simple since small variations in impedance are of limited consequences. Routing and traffi c assignment in an urban area is much more complex as in determining the impedance of a route it must consider stop signs, traffi c lights and congestion.
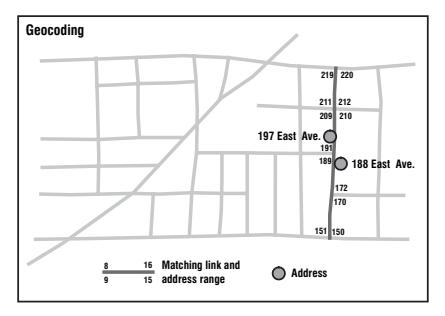
Figure 2.25 Geocoding in a network data model
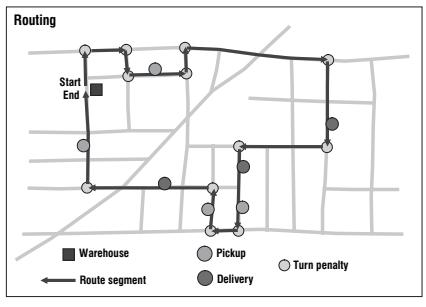
Figure 2.26 Routing in a network data model
Routing in a network data model can be simulated if impedance is attributed to links and nodes. For links, impedance is often characterized by travel time, while turn penalties are often used to characterize impedance at nodes, that is how diffi cult (if possible) it is to turn in one direction, as opposed to another. The network in Figure 2.26 represents a typical routing "traveling salesperson" type of problem. Starting and ending at a warehouse, a delivery truck has a set of deliveries and pickups to perform. The locations of those pickup and delivery points could have been derived from address matching (geocoding). Considering link and node (turn penalties) impedance attributes that are encoded in the network data model, it is possible to plot an optimal route minimizing travel time that would satisfy basic constraints related to the start and end points, pickup and delivery points, as well as link and turn penalty impedances.
Basic representation
Constructing the geometry of a network depends on the mode and the scale being investigated. For urban road networks, information can be extracted from aerial photographs or topographic maps. Air transport networks are derived from airport locations (nodes) and scheduled fl ights between them (links). Two fundamental tables are required in the basic representation of a network data model that can be stored in a database:
- Node table. This table contains at least three fi elds: one to store a unique identifi er and the others to store the node's x and y coordinates. Although these coordinates can be defi ned by any Cartesian reference system, longitudes and latitudes would insure an easy portability to a GIS.
- Link table. This table also contains at least three fi elds: one to store a unique identifi er, one to store the node of origin and one to store the node of destination. A fourth fi eld can be used to state whether or not the link is unidirectional.
Once those two tables are relationally linked, a basic network topology can be constructed and all the indexes and measures of graph theorycan be calculated. Attributes such as the connectivity and the Shimbel matrix can also easily be derived from the link table. This basic representation enables to defi ne the topology of networks as structured by graph theory.
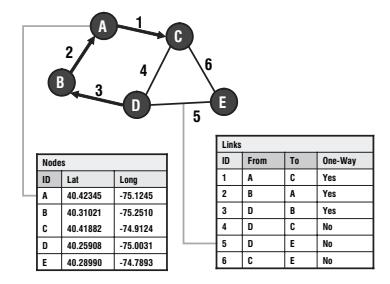
Figure 2.27 Relational database representation of a simple network
A network can be represented by using two tables, one defi ning nodes and the other defi ning links (Figure 2.27). The three core elements (fi elds) of a nodes table are a unique identifi er and locational attributes in a coordinate system, such as latitude and longitude values. On Figure 2.27, coordinates are in decimal degrees, meaning that the location of these nodes can be directly imported into a GIS. Additional attributes can also be included in this table.
The links table has four core elements (fi elds). The fi rst is a unique identifi er for each link, the next two are the nodes of origin and destination of the link and the fourth is a directional tag indicating whether or not the link is unidirectional. An alternative would be to assume that all links are unidirectional and defi ne each of them implicitly. This would require the addition of three new records if the directional tag fi eld is not used (C–D, E–D and E–C). However, this would involve serious redundancies on a complex network. As for the nodes table, additional attributes can be included, such as name, number of lanes, maximum speed, etc.
Both the nodes and links tables have little value if they are considered individually, as a network is the combination of the information contained on both tables. A way to combine these tables is by building a relational join between them. In the above example, a relational join can be established between the [From] and [To] fi elds of the links table with the [ID] fi eld of the nodes table. The resulting relational database contains the basic topological elements of the network.
Many efforts have been made to create comprehensive transportation network databases to address a wide variety of transportation problems ranging from public transit to package distribution. Initially, these efforts were undertaken within transportation network optimization packages (e.g. EMME/2, TransCAD) which created topologically sound representations. Many of these representations were however geographically inaccurate and had limited visual and geocoding capabilities. Using a network data model for the purposes of cartography, geocoding and routing requires further developments.
Layer-based approach
Most conventional GIS data models separate information in layers, each representing a different class of geographical elements symbolized as points, lines and polygons. As such, a network data model must be constructed with the limitation of having points and lines in two separate layers; thus the layer-based approach. Further, an important
requirement is that the geometry of the network matches the reality as closely as possible since these networks are often part of a geographic information system where accurate location and visualization is a requisite. This has commonly resulted in the fragmentation of each logical link into a multitude of segments, with most of the nodes of these segments mere intermediate cosmetic elements. The topology of such network data models is not well defi ned, and has to be inferred. However, these network data models benefi t from the attribute linking capabilities of the spatial database models they are derived from. Among the most signifi cant attributes that can be attached to network layers are:
- Classifi cation and labeling. Each segment can be classifi ed into categories such as its function (street, highway, railway, etc.), importance (number of lanes) and type (paved, non-paved). Also, a complex labeling structure can be established with prefi xes, proper names and suffi xes.
- Linear referencing system. Several systems to locate elements along a segment have been established. One of the most common is the address system where each segment is provided with an address range. Through linear interpolation, a specifi c location can be derived (geocoding).
- Segment travel costs. Can consider a vast array of impedance measures. Among the most common is the length of the segment, a typical travel time or a speed limit. Congestion can also be assessed, either as a specifi c value of impedance or as a mathematical function.
- Direction. To avoid unnecessary, and often unrealistic duplication of links, especially at the street level, a directional attribute can be included in the attribute table.
- Overcrossing and undercrossing. Since the great majority of layer-based network models are planar, they are ill designed to deal with non-planar representations. A provision must be made in the attribute table to identify segments that are overcrossing or undercrossing a segment they intersect with.
- Τurn penalties. An important attribute to insure accurate routing within a network. Each intersection has different turn constraints and possibilities. Conventionally in road transportation, a right turn is assumed to have a smaller penalty than a left turn.
The TIGER (Topologically Integrated Geographic Encoding and Referencing) model is a notable example of a layer-based structure which has been widely accepted. TIGER was developed by the US Census Bureau to store street information constructed for the 1990 census. It contains complete geographic coordinates in a line-based structure. The most important attributes include street name and address information, offering an effi cient linear referencing system for geocoding. The layer-based approach is consequently good to solve the cartography and geocoding issues. However, it is ill suited to comprehensively address routing and assignment transport problems.
The object-oriented approach represents the latest development in spatial data models. It assumes that each geographical feature is an object with a set of properties and a set of relationships with other objects, namely membership and inheritance. As such, a transportation network is an object composed of other objects, namely nodes and links. Since topology is one of the core concepts defi ning transportation networks, relationships expressing it are imbedded in object-oriented representations.
Bibliography
- Briggs, K. (1972) Introducing Transportation Networks, London: University of London Press.
- Cambridge Systematics (1996) Quick Response Freight Manual, Federal Highway Administration, Offi ce of Planning and Environment Technical Support Services for Planning Research, http://tmip. fhwa.dot.gov/clearinghouse/docs/quick/Quick.pdf.
- Dalton, R., J. Garlick, R. Minshull and A. Robinson (1978) Networks in Geography, London: George Philip.
- Haggett, P. and R.J. Chorley (1969) Network Analysis in Geography, London: Edward Arnold.
- Henderson, J.V., Z. Shalizi and A.J. Venables (2000) Geography and Development, http://econ.lse.ac.uk/ staff/ajv/vhzstv3.pdf.
- Kansky, K. (1963) Structure of Transportation Network s: Relationships Between Network Geography and Regional Characteristics, University of Chicago, Department of Geography, Research Papers 84.
- Leinbach, T. (1976) "Networks and Flows", Progress in Geography, 8, 179–207.
- Mattiussi, R. (1978) A Temporal Graph-Theoretic Study of the Ontario Passenger Rail Network. Undergraduate Thesis. Department of Geography, Wilfrid Laurier University, Waterloo, Ontario.
- Miller, H.J. and S.L. Shaw (2001) "GIS-T Data Models", in Geographic Information Systems for Transportation: Principles and Applications, Oxford: Oxford University Press. http://www. gisvisionmag.com/Book/miller_shaw.pdf.
- Taaffe, E.J., H.L. Gauthier and M.E. O'Kelly (1996) Geography of Transportation, 2nd edn, Upper Saddle River, NJ: Prentice Hall.
- Victoria Transport Policy Institute (2002) "Transportation Elasticities", Transport Demand Management Encyclopedia, http://www.vtpi.org/tdm/tdm11.htm.Zeiler, M. (1999) Modeling our World: The ESRI Guide to Geodatabase Design, Redlands, CA: ESRI Press.
Economic and spatial structure of transport systems 3
Transport systems are closely related to socio-economic changes. The mobility of people and freight and levels of territorial accessibility are at the core of this relationship. Economic opportunities are likely to arise where transportation infrastructures are able to answer mobility needs and insure access to markets and resources. From the industrial revolution in the nineteenth century to globalization and economic integration processes of the late twentieth century, regions of the world have been affected differently by economic development. International, regional and local transportation systems alike have become fundamental components of economic activities. A growing share of the wealth is thus linked to trade and distribution. However, even if transportation has positive impacts on socio-economic systems, there are also negative consequences such as congestion, accidents and mobility gaps.
Concept 1 – Transport and economic development
The economic importance of transportation
The transport sector is an important component of the economy, impacting on development and the welfare of populations. When transport systems are effi cient, they provide economic and social opportunities and benefi ts that impact throughout the economy. When transport systems are defi cient, they can have an economic cost in terms of reduced or missed opportunities. Transport also carries an important social and environmental load, which cannot be neglected. From a general standpoint, the economic impacts of transportation can be direct and indirect:
- Direct impacts related to accessibilitychange where transport enables larger markets and enables to save time and costs.
- Indirect impacts related to the economic multiplier effect where the price of commodities drop and/or their variety increases.
Table 3.1 shows a wide range of economic benefi ts conveyed by transportation systems, some direct (income related) and some indirect (accessibility related), impacting transport supply and demand and at the microeconomic (sector-wise) and macroeconomic (whole economy) levels.
The impacts of transportation are not always intended, and can have unforeseen consequences such as congestion. Mobility is one of the most fundamental and important characteristics of economic activity as it satisfi es the basic need of going from one location to the other, a need shared by passengers, freight and information. All economies do not share the same level of mobility. Economies that possess greater mobility are often those with better opportunities to develop than those suffering from
Table 3.1 Economic benefi ts of transportation
| Direct transport supply | Direct transport demand |
Indirect microeconomic | Indirect macroeconomic |
|---|---|---|---|
| – Income from transport operations (fares and salaries) |
– Improved accessibility |
– Rent income | – Formation of distribution networks |
| – Access to wider distribution markets and niches |
– Time and cost savings |
– Lower price of commodities |
– Attraction and accumulation of economic activities |
| – Productivity gains | – Higher supply of commodities |
– Increased competitiveness |
|
| – Division of labor | – Growth of consumption |
||
| – Access to a wider range of suppliers and consumers |
– Fulfi lling mobility needs |
||
| – Economies of scale |
scarce mobility. Reduced mobility impedes development while greater mobility is a catalyst for development. Mobility is thus a reliable indicator of development (Figure 3.1).
Economic development is linked with transitions in passenger mobility from nonmotorized (mainly walking) to motorized forms of transportation. The initial stage of this transition involves the development of collective forms of transportation (tramways, subways, buses) while individual forms of transportation (mainly the automobile) become more prevalent at a later stage. This is particularly linked with the growth of individual incomes where at some point individual motorized mobility becomes affordable.
Providing this mobility is an industry that offers services to its customers, employs people and pays wages, invests capital and generates income. The economic importance of the transportation industry can thus be assessed from a macroeconomic and microeconomic perspective:
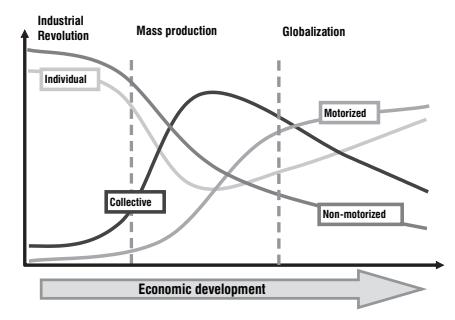
Figure 3.1 Passenger mobility transition
- At the macroeconomic level (the importance of transportation for a whole economy), transportation and the mobility it confers are linked to a level of output, employment and income within a national economy. In many developed countries, transportation accounts for between 6 and 12 percent of the GDP.
- At the microeconomic level (the importance of transportation for specifi c parts of the economy) transportation is linked to producer, consumer and production costs. The importance of specifi c transport activities and infrastructure can thus be assessed for each sector of the economy. Transportation accounts for on average between 10 and 15 percent of household expenditure while it accounts for around 4 percent of the costs of each unit of output in manufacturing.
Transportation links together the factors of production in a complex web of relationships between producers and consumers. The outcome is a more effi cient division of production by an exploitation of geographical comparative advantages, as well as the means to develop economies of scale and scope. The productivity of space, capital and labor is thus enhanced with the effi ciency of distribution. It is acknowledged that economic growth is increasingly linked with transport development.
Transportation and economic development
Transportation developments that have taken place since the beginning of the industrial revolution have been linked to growing economic opportunities. At each stage of human societal development, a particular transport mode has been developed or adapted. However, it has been observed that throughout history no single mode of transport has been solely responsible for economic growth. Instead, modes have been linked with the direction and the geographical setting in which growth was taking place. For instance, major fl ows of international migration that occurred since the eighteenth century were linked with the expansion of international and continental transport systems. Transport has played a catalytic role in these migrations, transforming the economic geography of many nations. Concomitantly, transportation has been a tool of territorial control and exploitation, particularly during the colonial era where resource-based transport systems supported the extraction of commodities in the developing world.
Each transport mode and technology is linked to a set of economic opportunities, notably in terms of market areas, types of commodities that can be transported (including passengers) and economies of scale (Figure 3.2). All these issues are related to a scale and level of commercial geography . Prior to the industrial revolution, economic opportunities were limited by the low capacity to move commodities over long distances, as most activities were very localized is scale and scope. The industrial revolution unleashed greater economic opportunities, initially with the development of inland canal systems, steamships and then railway systems. Passenger and freight transportation expanded as well as production and consumption while new markets and resources became available. In many instances, the development of one transportation mode built on the opportunities developed by another, such as maritime and canal shipping. In other situations, the growth of a new mode of transportation favored the decline of others, such as the collapse of many inland canal networks in the late nineteenth century because of rail competition.
The development of the mass production system at the beginning of the twentieth century increasingly relied on the commercial opportunities introduced by road transportation, particularly the automobile. Later in the twentieth century, globalization became a possibility with the joint synergy of maritime transportation, roadways,
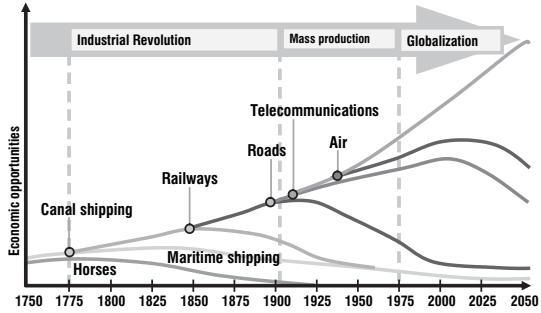
Figure 3.2 Cumulative modal contribution to economic opportunities (Source: adapted from HOP Associates)
railways, air and telecommunications. Economic opportunities became global in scale and scope, particularly because of the capacity to maintain an intricate network of trade and transactions through transport systems. More recently, new opportunities arose with the convergence of telecommunications and information technologies, supporting a higher level of management of production, consumption and distribution. It is expected that such a process, building upon the advantages conferred by other transportation modes, will account for a signifi cant share of economic opportunities in the fi rst half of the twenty-fi rst century.
While some regions benefi t from the development of transport systems, others are often marginalized by a set of conditions in which inadequate transportation plays a role. Transport by itself is not a suffi cient condition for development, however; the lack of transport infrastructures can be seen as a constraining factor on development. The relationship between transportation and economic development is thus diffi cult to formally establish and has been debated for many years. The complexity lies in a variety of possible impacts:
- Timing of the development varies as the impacts of transportation can either precede, occur during or take place after economic development. The lag, concomitant and lead impacts make it diffi cult to separate the specifi c contributions of transport to development, therefore. Each case study appears to be specifi c to a set of timing circumstances that are diffi cult to replicate elsewhere.
- Types of impacts vary considerably. The spectrum of impacts ranges from the positive through the permissive to the negative. In some cases transportation impacts can promote, in others they may hinder, economic development in a region. In many cases, few, if any, direct linkages can be clearly established.
Cycles of economic development provide a revealing conceptual perspective about how transport systems evolve in time and space as they include the timing and the nature of the transport impact on economic development. Transport, as a technology, follows a path of experimentation, introduction, adoption and diffusion and, fi nally, obsolescence, each of which has an impact on economic development. Succinctly, transport technology can be linked to fi ve major waves of economic development where a specifi c mode or system emerged:
- Seaports. Linked with the early stages of European expansion from the sixteenth to eighteenth centuries. They supported the development of international trade through colonial empires, but were constrained by limited inland access.
- Rivers and canals. The fi rst stage of the industrial revolutionin the late eighteenth and early nineteenth centuries was linked to the development of canal systems in Western Europe and North America, mainly to transport heavy goods. This permitted the development of rudimentary and constrained inland distribution systems.
- Railways. The second stage of the industrial revolution in the nineteenth century was intimately linked to the development and implementation of rail systems enabling a more fl exible inland transportation system.
- Roads. The twentieth century saw the development of road transportation systems and automobile manufacturing. Individual transportation became a commodity available to the masses, especially after World War II. This process was reinforced by the development of highway systems.
- Airways and information. The later part of the twentieth century saw the development of global air and telecommunication networks in conjunction with the globalization of economic activities. New organization, control and maintenance capacities were made possible. Electronic communications have become consistent with transport functions, especially in the rapidly developing realm of logisticsand supply chain management.
Technological innovation and economic growth are closely related and can be articulated within the concept of cycles or waves. Each wave represents a diffusion phase of technological innovations, creating entirely new industrial sectors, and thus opportunities for investment and growth. Five waves have been identifi ed so far (Figure 3.3):
- 1st wave (1785–1845). Depended on innovations such as water power, textiles and iron. The beginning of the industrial revolutionin England was mainly focused on simple commodities such as clothes and tools. The conventional maritime technology relying on sailships was perfected, supporting the creation of large colonial/trading empires, mainly by the British, the French, the Dutch, and the Spanish. Signifi cant inland waterway systems were also constructed.
- 2nd wave (1845–1900). Involved the massive application of coal as a source of energy, mainly through the steam engine. This induced the development of railtransport systems, opening new markets and giving access to a wider array of resources. The steamship had a similar impact for maritime transport ation and permitted further commercial exploitation.
- 3rd wave (1900–50). Electrifi cation was a major economic change as it permitted the usage of a variety of machines and appliances. This permitted the development
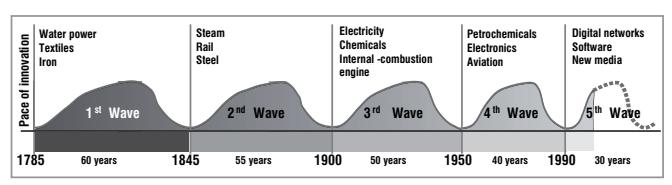
Figure 3.3 Long wave cycles of innovation
of urban transit systems (subways and tramways). Another signifi cant improvement was the internal combustion engine, around which the whole automotive industry was created.
- 4th wave (1950–90). The post-World War II period represented signifi cant industrial changes such as plastics (petrochemicals) and electronics (television). The jet engine expanded the aviation industry towards the mass market.
- 5th wave (1990–2020?). The current wave mainly relies on information systems, which have tremendously modifi ed the transactional environment with new methods of communication and more effi cient management of production and distribution systems. This has spawned new industries, mainly computer manufacturing and software programming, but more recently e-commerce as information processing converged with telecommunications.
As time progressed, the lapse between each wave got shorter. For instance, the fi rst wave lasted 60 years while the fourth wave lasted 40 years. This refl ects a growing capacity for innovation and the capacity of economic systems to derive wealth from it. Innovations are no longer the result of individual efforts, but are organized and concerted actions whose results are rapidly diffused. It is thus expected that the fi fth wave will last about 30 years.
Contemporary trends have underlined that economic development has become less dependent on relations with the environment (resources) and more dependent on relations across space. While resources remain the foundation of economic activities, the commodifi cation of the economy has been linked with higher levels of material fl ows. Concomitantly, resources, capital and even labor have shown increasing levels of mobility. This is particularly the case for multinational fi rms that can benefi t from transport improvements in two signifi cant markets:
- Commodity market. Improvement in the effi ciency with which fi rms have access to raw materials and parts as well as to their respective customers. Thus, transportation expands opportunities to acquire and sell a variety of commodities necessary for industrial and manufacturing systems.
- Labor market. Improvement in the access to labor and a reduction in access costs, mainly by improved commuting (local scale) or the use of lower cost labor (global scale).
Transport as a factor of production
Transportation is an economic factor of production of goods and services. It provides market accessibility by linking producers and consumers. An effi cient transport system with modern infrastructures favors many economic changes, most of them positive. The major impacts of transport on economic processes can be categorized as follows:
• Geographic specialization. Improvements in transportation and communication favor a process of geographical specialization that increases productivity and spatial interactions. An economic entity tends to produce goods and services with the most appropriate combination of capital, labor, and raw materials. A given area will thus tend to specialize in the production of goods and services for which it has the greatest advantages (or the least disadvantages) compared with other areas, as long as appropriate transport is available for trade. Through geographic specialization supported by effi cient transportation, the economic productivity is promoted. This process is known in economic theory as comparative advantages.
- Large-scale production. An effi cient transport system offering cost, time and reliability advantages permits goods to be transported further. This facilitates mass production through scale economies because more markets can be accessed. The concept of "just-in-time" has further expanded the productivity of production and distribution. Thus, the more effi cient transportation becomes, the larger the markets that can be serviced and the larger the scale of production.
- Increased competition. When transport is effi cient, the potential market for a given product (or service) increases, and so does competition. A wider array of goods and services becomes available to consumers through competition which tends to reduce costs and promote quality and innovation.
- Increased land value. Land which is adjacent to or serviced by good transport services generally has greater value due to the utility it confers to many activities. In some cases, the opposite can be true. Land located near airports and highways, near noise and pollution sources, will thus suffer from corresponding diminishing land value.
Transport also contributes to economic development through job creation and its derived economic activities. Accordingly, a large amount of direct (freighters, managers, shippers) and indirect (insurance, packaging, handling, travel agencies, transit operators) employment are associated with transport. Consumers take economic decisions on products, markets, costs, location, and prices which are themselves based on transport services, their availability, costs and capacity.
Socio-economic impacts
While many of the economic impacts of transportation are positive, there are also signifi cant negative impacts that are assumed by individuals or by the society in one way or another. Among the most signifi cant are:
- Mobility gaps. Since mobility is one of the fundamental components of the economic benefi ts of transportation, its variations are likely to have substantial impacts on the opportunities of individuals. Mobility needs do not always coincide due to several factors, namely the lack of income, lack of time, lack of means and lack of access. People's mobility and transport demands thus depend on their socio-economic situation. The higher the income, the higher the mobility, which may give rise to substantial mobility gaps between different population groups. Gender gaps exist in mobility as women tend to have lower incomes. Mobility gaps are particularly prevalent for long-distance travel. With the development of air transport, a segment of the global population has achieved a very high level of mobility for their business and leisure activities, while the great majority of the global population has little mobility.
- Costs differences. Locations that have low levels of accessibilitytend to have higher costs for many goods (sometimes basic necessities such as food) as most have to be imported, often over long distances. The resulting higher transport costs inhibit the competitiveness of such locations and limit opportunities. Consumers and industries will pay higher prices, impacting on their welfare and competitiveness.
- Congestion. With the increased use of transport systems, it has become increasingly common for parts of the network to be used above design capacity. Congestion is the outcome of such a situation with its associated costs, delays and waste of energy. Distribution systems that rely upon on-time deliveries are particularly susceptible to congestion .
• Accidents. The use of transport modes and infrastructure is never entirely safe. Every motorized vehicle contains an element of danger and nuisance. Due to human errors and various forms of physical failures (mechanical or infrastructural), injuries, damage and even deaths occur. Accidents tend to be proportional to the intensity of use of transport infrastructures. They have important socio-economic impacts including healthcare, insurance, damage to property and the loss of life. The respective level of safety depends on the mode of transport. No mode is completely safe but the road remains the most dangerous medium for transportation, accounting for 90 percent of all transport accidents on average. Chinahas one of the highest car accident death rates in the world, with more than 110,000 fatalities per year (300 per day), a factor mainly due to recent growth in vehicle ownership.
The emission of pollutants related to transport activities has a wide range of environmental consequences that have to be assumed by the society, more specifi cally on four elements:
- Air quality. Atmospheric emissions from pollutants produced by transportation, especially by the internal combustion engine, are associated with air pollution , acid rain and the potential for global warming. Some pollutants (NOx , CO, O3 volatile organic compounds, etc.) can produce respiratory troubles and aggravate cardiovascular illnesses. In urban regions, about 50 percent of all air pollution emanates from automobile traffi c.
- Noise. A major irritant, noise can impact on human health and most often on human welfare. Noise can be manifested on three levels, depending on emissions intensity: psychological disturbances (perturbations, displeasure), functional disturbances (sleep disorders, loss of work productivity, speech interference) or physiological disturbances (health issues such as fatigue, and hearing damage). Noise and vibration associated with trains, trucks, and planes in the vicinity of airports are major irritants.
- Water quality. Accidental and nominal runoff of pollutants from transport such as oil spills, are sources of contamination for both surface water and groundwater.
- Land take. Transport is a large consumer of space when all of its supporting infrastructure and equipment are considered. Furthermore, the planning associated with these structures does not always consider aesthetic value as was often the case in the construction of urban highways. These visual impacts are adverse consequences to the quality of life of nearby residents.
Concept 2 – Transport and spatial organization
Global spatial organization
Throughout history, transport networks have structured space on different scales. The fragmentation of production and consumption, the locational specifi cities of resources, labor and markets generate a wide array of fl ows of people, goods and information. Transportation not only stimulates economic development but also helps structure space. Space shapes transport as much as transport shapes space. It is a salient example of the reciprocity of transport and its geography. The relationship between transport and spatial organization can be considered on three major geographical scales: the global, the regional and the local.
Figure 3.4 provides a perspective of the main elements structuring the organization of space at the local, regional and global levels. While the major nodes structuring spatial organization at the global level are gateways mainly supported by port, airport and telecommunication activities, at the local level, employment and commercial activities, which tend to be agglomerated, are the main structuring elements. Each of these scales is also characterized by specifi c links and relations ranging from locally based commuting to global trade fl ows.
At the global level, transportation supports and shapes economic specialization and productivity through international trade . Improvements in transport are expanding markets and development opportunities, but not uniformly. The inequalities of the global economy are refl ected in its spatial organization and transport systems. The patterns of globalization have created a growth in spatial fl ows and increased interdependencies. Telecommunications, maritime transportand air transportsupport the majority of global fl ows. The nature and spatial structure of these fl ows can be considered from two major perspectives that seek to explain global differences in growth and accessibility:
- Core/periphery. This basic representation assumes that the global spatial organization favors a few core areas that grow faster than the periphery. This differential growth in time creates acute inequalities in levels of development. Transportation is thus perceived as a factor of polarization and unequal development. From this perspective, parts of the global economyare gaining, because they are more accessible, while other are marginalized and bound to dependency. However, this trend can be reversed if international transport costs are signifi cantly reduced. This is evidenced by the substantial growth of many Pacifi c Asian countries.
- Poles. Transportation is perceived as a factor of articulation in the global economy where the circulation of passengers and freight is regulated by poles corresponding to a high level of accumulation of transport infrastructures, distribution and economic activities. These poles are subject to centrifugal and centripetal forces that have favored the geographical concentration of some activities and the dispersion of others.
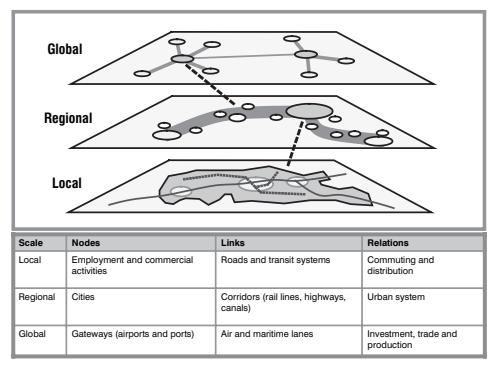
Figure 3.4 Scales of spatial organization for transportation
Global fl ows are handled by the gateways of the global economy , each of which accounts for a signifi cant share of the fl ows of people, freight and information.
Gateway. A location offering accessibility to a large system of circulation of freight and passengers. Gateways reap the advantages of a favorable physical location such as highway junctions, the confl uence of rivers, a good port site, and have been the object of a signifi cant accumulation of transport infrastructures such as terminals and their links. A gateway is commonly an origin, a destination and a point of transit. It generally commands the entrance to and the exit from its catchment area. In other words, it is a pivotal point for the entrance and the exit of merchandise in a region, a country, or a continent and often requires intermodal transfers.
However, services are following a spatial trend which appears to be the opposite of production. As production disperses worldwide, services increasingly concentrate into a relatively few large metropolitan areas, labeled as world cities. They are centers for fi nancial services (banking, insurance), head offi ces of major multinational corporations and the seats of major governments. Thus, gateways and world cities may not necessarily correspond as locations.
Regional spatial organization
Regions are commonly organized along an interdependent set of cities forming what is often referred to as an urban system. The key spatial foundation of an urban system is based on a series of market areas, which are a function of the level of activity of each center divided by the friction of distance . The spatial structure of most regions can be subdivided into three basic components:
- A set of locations of specialized industries such as manufacturing and mining, which tend to group into agglomerations according to location factors such as raw materials, labor, markets, etc. They are often export-oriented industries from which a region derives the bulk of its growth.
- A set of service industry locations, including administration, fi nance, retail, wholesale and other similar services, which tend to agglomerate in a system of central places (cities) providing optimal accessibility to labor or potential customers.
- A pattern of transport nodes and links, such as roads, railways, ports and airports, which service major centers of economic activity.
Jointly, these components defi ne the spatial order of a region, mostly its organization in a hierarchy of relationships involving fl ows of people, freight and information. More or less well-defi ned urban systems spatially translate such development. Many conceptual models have been proposed to explain the relationships between transport, urban systems and regional development, the core–periphery stages of development and the network expansion being among those. Three conceptual categories of regional spatial organization can be observed:
• Central places/urban systems models try to fi nd the relationships between the size, the number and the geographic distribution of cities in a region. Many variations of the regional spatial structure have been investigated by Central Place Theory. The great majority of urban systems have a well-established hierarchy where a few centers dominate. Transportation is particularly important in such a representation
as the organization of central places is based on minimizing the friction of distance . The territorial structure depicted by Central Place Theory is the outcome of a region seeking the provision of services in a (transport) cost-effective way.
- Growth poles where economic development is the structural change caused by the growth of new propulsive industries that are the poles of growth. The location of these activities is the catalyst of the regional spatial organization. Growth poles fi rst initiate, then diffuse, development. It attempts to be a general theory of the initiation and diffusion of development models. Growth gets distributed spatially within a regional urban system, but this process is uneven with the core benefi ting fi rst and the periphery eventually becoming integrated in a system of fl ows. In the growth poles theory, transportation is a factor of accessibilitywhich reinforces the importance of poles.
- Transport corridors represent an accumulation of fl ows and infrastructures of various modes and their development is linked with economic, infrastructural and technological processes. When these processes involve urban development, urbanization corridors are a system of cities oriented along an axis, commonly fl uvial or a coastline. Historically, urbanization was mainly organized by the communication capacities offered by fl uvial and coastal maritime transportation. Many urban regions such as BosWash (Boston–Washington) or Tokaido (Tokyo–Osaka) share this spatial commonality.
Figure 3.5 shows three geographical models which relate urbanization, transportation and corridors:
• The urban-system and central places theory mainly considers cities as structurally independent entities that compete over overlapping market areas. Under the location and accessibilitymodel (A) an urban region is considered as a hierarchy/order of services and functions and the corridor as a structure organizing interactions within this hierarchy. Transport costs are considered a dominant factor in the organization of the spatial structure as the hinterland of each center is the outcome of the consumers' ability to access its range of goods and services. Because of higher levels of accessibility along the corridor, market areas are smaller and the extent of goods and services being offered are broader.
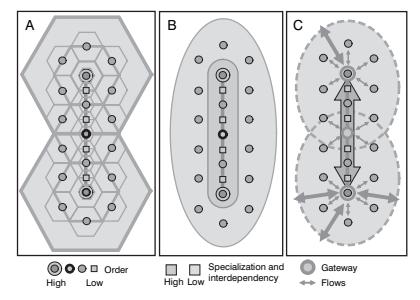
Figure 3.5 Transport corridors and the regional spatial structure
- The specialization and interdependency model (B) considers that some cities can have a level of interaction and that transportation could be more than a factor of market accessibility, but also of regional specialization and of comparative advantages. The Megalopolis concept introduced by Gottmann (1961) acknowledges the creation of large urban corridors structured by transportation infrastructures and terminals maintaining interactions. Accessibility and economies of scale, in both production and consumption, are factors supporting the development of such entities where urban areas are increasingly specialized and interdependent. The main assumption is that the accessibility provided by the corridor reinforces territorial specialization and interdependency along its main axis, and consequently the reliance on a regional transport system.
- The distribution/fl ow model (C) is one where a major gateway of an urban region acts as the main interface between global, national and regional systems. Under such a paradigm, three core structural elements defi ne a regional corridor: 1) Gateways regulate freight, passengers and information fl ows. 2) Transport corridors with a linear accumulation of transport infrastructures service a set of gateways. They provide for the physical capacity of distribution. 3) Flows, their spatial structure and the underlying activities of production, circulation and consumption.
Local spatial organization
Although transport is an important element in rural spatial organization, it is at the urban level that transportation has the most signifi cant local spatial impact. Urbanization and transport are interrelated concepts (see Chapter 7 for a detailed perspective concerning urban transportation). Every city relies on the need for mobility of passengers (residence, work, purchases, and leisure) and freight (consumption goods, food, energy, construction materials and waste disposal), where the main nodes are employment zones. Demographic and spatial evolution (urban setting) is translated in space by the breadth and amplitude of movements. Employment and attraction zones are the most important elements shaping the local urban spatial organization:
- Employment zones. The growing dissociation between the workplace and the residence is largely due to the success of motorized transport, notably the private automobile. Employment zones being located away from residential zones have contributed to an increase in number and length of commuting trips. Before suburbanization, public transit was wholly responsible for commuting. Today, the automobile supports the majority of these trips. This trend is particularly prevalent in highly populated, industrialized and urbanized zones, notably in North America.
- Attraction zones. Attraction zones linked to transport modes are areas to which a majority of the population travels for varied reasons such as shopping, professional services, education and leisure. As with central place theory, there is a certain hierarchy of services within an urban area ranging from the central business district offering a wide variety of specialized services to small local centers offering basic services such as groceries and personal banking.
The development of cities is conditioned by transport and several modes, from urban transit to the automobile, have contributed to the creation of urban landscapes. Three distinct phases can be noted:
- The conventional/classic city. Constructed for pedestrian interactions and constrained by them, the historic city was compact and limited in size. The emergence of the fi rst public transit systems in the nineteenth century permitted the extension of the city into new neighborhoods. However, pedestrian movements still accounted for the great majority of movements and the local spatial organization remained compact. Many European and Asian cities still have a signifi cant level of compactness today.
- Suburbanization. The advent of more effi cient public transit systems and later on of the automobile permitted an increased separation of basic urban functions (residential, industrial and commercial) and the resulting spatial specialization. The rapid expansion of urban areas that resulted, especially in North America, created a new spatial organization, less cohesive than before but still relatively adjacent to the existing urban fabric. Although this process started in the early twentieth century, it accelerated after World War II.
- Exurbanization. Additional improvements in mobility favored urban expansion in the countryside where urban and rural activities are somewhat intermixed. Many cities became extended metropolitan regions, with a wide array of specialized functions including residential areas, commercial centers, industrial parks, logistics centers, recreational areas and high tech zones. These exurbanization developments have also been called "edge cities".
The automobile has clearly infl uenced the new spatial organization but other socioeconomic factors, such as gentrifi cation and the increase in land values, have also shaped urban development. The diffusion of the automobile has led to an urban explosion. The car has favored the mobility of individuals thus permitting a disorderly growth and an allocation of space between often confl icting urban functions (residential, industrial, commercial). Transport thus contributes to the local spatial organization; however, it must also adapt to urban morphologies. Transport networks and urban centers complement and condition each other.
Concept 3 – Transport and location
The importance of transport in location
In addition to being a factor of development both at the macro- and microeconomic levels, transportation is linked with the location of socio-economic activities, including retail, manufacturing and services. In a market economy, location is the outcome of a constrained choice where many issues are being considered, transportation being one. There is a long tradition within economic geography of developing location theories with a view to explaining and predicting the locational logic of economic activities by incorporating market, institutional and behavioral considerations in various degrees. The majority have an explicit or implicit role attributed to transport. As there are no absolute rules dictating locational choices, the importance of transport can only be evaluated with varying degrees of accuracy. At best, the following observations concerning transportation modes and terminals and their importance for location can be made:
- Ports and airports. Convergence of related activities around terminals, particularly for ports since inland distribution costs tend to be high.
- Roads and railroads. A structuring and convergence effect that varies according to the level of accessibility. For rail transport, terminals also have a convergence effect.
• Telecommunications. No specifi c local infl uence, but the quality of regional and national telecommunication systems tends to ease transactions.
Globalization has been associated with signifi cant changes in business operations and markets. Managing operations in such an environment has become increasingly complex, especially with the territorial extension of production and consumption. Manufacturing strategies tend to use different locations for each component of a product in order to optimize respective comparative advantages. Transport requirements have increased proportionally as well in order to organize the related fl ows. The requirement of faster long-distance transport services has propelled the importance of air transport , especially for freight. Air terminals have thus become a signifi cant location factor for globally oriented activities, which tend to agglomerate in the vicinity. Technological changes have also been linked with the relocation of industrial and even service activities. Global telecommunication facilities can favor the outsourcing of several services to lower cost locations.
Location factors
Transport plays an important role in the location of activities. It is a necessary condition, among others for social and economic development. The location of economic activities is a priori dependent on the nature of the activity itself and on certain location factors such as the attributes of the site, the level of accessibility and the socio-economic environment (Figure 3.6).
Location factors can be subdivided into three general functional categories:
- Site. Specifi c micro-geographical characteristics of the site, including the availability of land, basic utilities, visibility (prestige), amenities (quality of life) and the nature and level of access to local transportation (such as the proximity to a highway). These factors have an important effect on the costs associated with a location.
- Accessibility. Includes a number of opportunity factors related to a location, mainly labor (wages, availability, level of qualifi cation), materials (mainly for raw materials dependent activities), energy, markets (local, regional and global) and accessibility to suppliers and customers (important for intermediate activities). These factors tend to have a meso (regional) connotation.
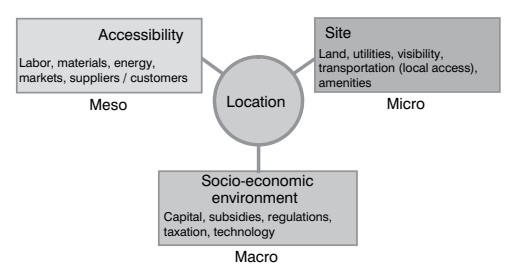
Figure 3.6 Basic location factors
• Socio-economic environment. Specifi c macro-geographical characteristics that tend to apply to political units (nation, region, locality). They consider the availability of capital (investment, venture), varied subsidies, regulations, taxation and technology.
The role and importance of each factor depends on the nature of the activity of which the locational behavior is being investigated. Although each type of economic activity has its own set of location factors, some general factors can be identifi ed by major economic sector:
- Primary economic activities. Their dominant location factor is related to environmental endowments, such as natural resources. For instance, mining takes place where economically recoverable mineral deposits are found and agriculture is subject to environmental constraints such as soil fertility, precipitation and temperature. Primary activities are thus characterized by the most basic location factors but have a strong reliance on transportation since their locations are rarely close to centers of demand. Substantial investments in extraction and distribution infrastructures must thus be made before resources can be brought to markets. The capacity to transport raw materials plays a signifi cant role in the possible development of extractive activities at a location.
- Secondary economic activities. Imply a complex web of location factors which, depending upon the industrial sector, relate to labor (cost and/or skill level), energy costs, capital, land, markets and/or proximity of suppliers. Location is thus an important cost factor (cost minimization). Considering the wide variety of industrial and manufacturing activities, understanding the rationale of each sector is a diffi cult task that has been subject to many investigations in economic geography. Globalization and recent developments in supply chain management and global production networks have made the situation even more complex with the presence of many intermediaries and signifi cant locational changes.
- Tertiary economic activities. Involve activities that are most bound to market proximity, since the capacity to sell a product or service is their most important location requirement. As many of these activities are retail oriented, consumer proximity (as well as their level of income) is essential and is directly related to sale levels. The main focus is to maximize sales revenues. Location is thus an important revenue factor (revenue maximization). The retail industry has signifi cantly changed with the emergence of large retail stores that maximize sales through economies of scale and local accessibility. E-commerce also provides a new dynamic where information can easily be traded and where niche retailing markets can be developed in a situation of high product diversity.
- Quaternary economic activities. Imply activities not linked to environmental endowments or access to a market, but to high-level services (banking, insurance), education, research and development; dominantly the high technology sector. With improvements in telecommunications, many of these activities can be located almost anywhere, as demonstrated by the recent trend to locate call centers offshore. There are still some strong locational requirements for high technology economic activities that include proximity to large universities and research centers and to a pool of highly qualifi ed workers (as well as cheap labor for supporting services), availability of venture capital, a high quality of life and access to excellent transportation and telecommunication facilities.
Each of these sectors thus has its own criteria, which vary in time and space. However, basic location strategies appear to be dominantly a cost minimization or a revenue maximization endeavor. Understanding location factors enables a better overview of the dynamics of the global economy and the associated territorial changes at the global, regional and local levels.
Accessibility and location
Since accessibilityis dominantly the outcome of transportation activities, namely the capacity of infrastructures to support mobility, it presents the most signifi cant infl uence of transportation on location. Hence, it appears that location (accessibility) and economic activities are intimately linked.
Conventionally, two major elements of the transport system provide a level of accessibility : nodal and linear (Figure 3.7). The nodes (A), related to transport terminals, and the links (B), related to transport infrastructures, have a gradient-like expression of accessibility that has been considered in location theories since Von Thunen . This gradient can be like concentric circles for nodes and like linear buffers for links. The closer a location is to these elements, the more suitable the accessibility of a site is supposed to be. Not every economic activity is dependent on a high level of accessibility, so a range of accessibility requirements can be considered. An activity with a high accessibility requirement is limited in its location to category range 1, while an activity with a low accessibility requirement can consider sites in category range 3 (including ranges 1 and 2). Activities with low accessibility requirements tend to have more locational choices than activities with high accessibility requirements. However, the former are more willing to bid for these sites than the latter. Two important trends have challenged this rather simplistic relationship between accessibility and location:
- Improvements in local, regional and international transportation have considerably lessened the friction of distance . This expands the area covered by each category of site accessibility (trend T1).
- Improvements in production systems have lessened the accessibility requirements of many activities (trend T2). This means that an activity has more locational choices.
Accessibility plays an important role by offering more customers through an expanded market area, by making distribution more effi cient (in terms of costs and time), or by enabling more people to reach workplaces. While some transport systems have favored the dispersion of socio-economic activities (e.g. automobiles and suburbanization),
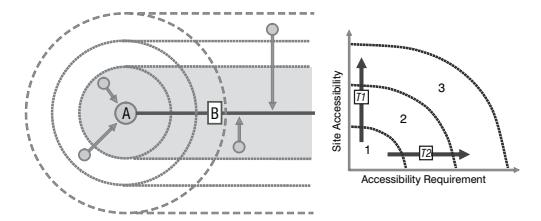
Figure 3.7 Accessibility and location
others have favored their concentration. All systems are bearers of spatial specialization and confi guration. Among the main confi guration forces are:
- Transportation costs. Refer to the benefi ts of a location that minimizes transport costs for either passengers or freight. This is at the core of classic industrial location theories where transport-dependent activities seek to minimize total transport costs. With the expansion of transport infrastructures, shifts in manufacturing, new economic activities such as high technology and an overall decline in transport costs, cost minimization is no longer a substantial consideration in location. However, transport costs cannot easily be dismissed and must be considered in a wider context where the quality and reliability of transport is of growing importance. It has been demonstrated that travel time, instead of distance, is the determining factor behind commuting ranges, a notion that increasingly applies to freight distribution.
- Agglomeration economies. Refer to the benefi ts of having activities locate (cluster) next to another, such as the use of common infrastructures and services. Clustering continues to be a powerful force in location as the reduction in transport costs favor the agglomeration of retail, manufacturing and distribution activities at specifi c locations. For instance, shopping malls are based on agglomeration economies, offering customers a wide variety of goods and services in a single location.
Because of the level of accessibility they provide, new transport infrastructures infl uence the setting of economic activities. They have a specifi c means of attraction as accessible locations favor certain functions. The effects on activities are not always automatic or evident. They are important however when infrastructure is accompanied by social, economic and urban transformations of space. New infrastructures therefore play a catalytic role because they are capable of transforming space.
Method 1 – The transportation problem (linear programming)
Linear inequalities
Mathematical programming is a set of techniques used to determine the optimal solution to allocation problems. Linear programming, the most widely used of these techniques, is a method that helps to attain a desired objective, such as minimizing costs or maximizing profi ts, subject to constraints on the amounts of commodities required or the resources available. The term linear implies proportionality; programming is used in the mathematical sense of selecting an optimum allocation of resources. In transport geography, linear programming is used to optimize fl ow patterns in which optimality implies the minimization of distance or transportation costs subject to certain constraints.
The following example is used to demonstrate the methodology. A government aid agency requires quantities of materials to assist in disaster relief of a region devastated by a major earthquake. The aid agency has two suppliers, A and B, both of which are depots. Supplier A can deliver 6 tons of food, 2 tons of medical material and 2 tons of shelter supplies. Supplier B can supply 2 tons of food, 8 tons of medical material and 2 tons of shelter supplies. The minimum requirements of aid material for the devastated region consist of 60 tons of food, 80 tons of medical materials and 40 tons of shelter supplies. See Table 3.2.
Table 3.2 Amount of materials required from two suppliers
| Supplier A | Supplier B | Minimum requirements | |
|---|---|---|---|
| Food | 6 | 2 | 60 |
| Medical material | 2 | 8 | 80 |
| Shelter supplies | 2 | 2 | 40 |
First the problem is stated in algebraic form. Let the minimum requirements consist of x loads for supplier A and y loads for supplier B. Thus:
For food: 6x + 2y ≥ 60 For medical material: 2x + 8y ≥ 80 For shelter supplies: 2x + 2y ≥ 40
Moreover, x and y cannot be negative, so the following conditions are added:
$$x \ge 0$$ $$y \ge 0$$
The above set of fi ve inequalities are called the constraints of the problem. A particular point (x, y) satisfying all the constraints is called a feasible point. The set of all points satisfying the constraints is the constraint set. Geometrically the constraint set represents a region of the x, y plane called the feasible region. The constraint set is graphed in Figure 3.8 (shaded region).
Notice that the region is unbounded and includes segments AB, BC and CD and the axes Ax and Dy. The vertexes A, B, C, and D are feasible points. There are four points where the inequalities cut each other on the x and y axes. For points A, B, C, and D, the coordinates are given in Table 3.3.
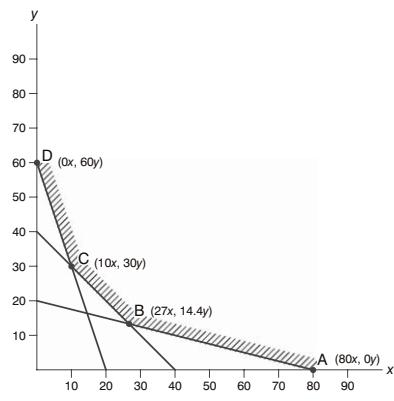
Figure 3.8 Linear inequalities
Table 3.3 Coordinates of the feasible region
| Point | x coordinate | y coordinate |
|---|---|---|
| Point A | 80 | 0 |
| Point B | 27 | 14.4 |
| Point C | 10 | 30 |
| Point D | 0 | 60 |
A vertex of the constraint set must be: 1) the intersection of a pair of constraint lines and 2) a feasible point. This constraint set or feasible region represents a convex region in the x, y plane. Any point in this region is a feasible solution, namely it satisfi es the inequalities.
Linear programming
In practical problems, the best, or optimal, solution is sought. Typically, the objective is to minimize costs or to maximize profi ts when a set of activities is carried out. In this simple problem, the minimum requirements of material for the aid agency at the lowest transportation cost are to be met. Let the distance between Supplier A and the agency be 60 km and from Supplier B be 30 km. The problem can then be modeled as:
Minimize: $$Z = 60x + 30y$$
Subject to the constraints
$$6x + 2y \ge 60$$ $$2x + 8y \ge 80$$ $$2x + 2y \ge 40$$ $$x \ge 0$$ $$y \ge 0$$
Z, a linear function of x and y, is called the objective function. x and y are the activity variables to be determined. The model of the problem in terms of linear constraints and linear objective is called a linear program.
Optimal solution
Before solving a linear program, there is a need to consider the objective function more closely. The objective function is not represented by an area on the graph, but by an infi nite number of parallel lines. The dashed parallel lines in Figure 3.9 represent the equations Z = 60x + 30y for several values of Z. The further these lines shift to the right, the greater the value of Z they represent.
The optimum (minimum cost) value of Z occurs when Z passes the point C where the lines 6x + 2y = 60 and 2x + 2y = 40 intersect. Solving these equations gives x = 10 and y = 30 and so the minimum transport value of Z = 1500 load-kilometers. See Table 3.4.
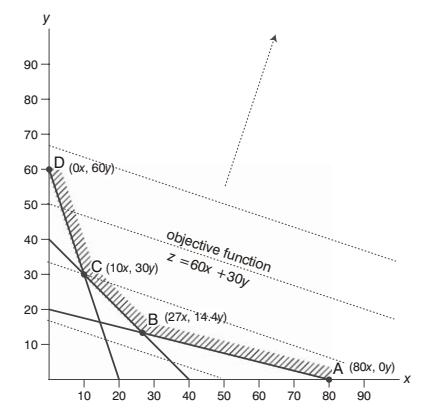
Figure 3.9 Optimal solution
Table 3.4 Optimal solution
| Material | Food | Medical material | Shelter supplies | Loads |
|---|---|---|---|---|
| Supplier A Supplier B Total |
60 tons 60 tons 120 tons |
20 tons 240 tons 260 tons |
20 tons 60 tons 80 tons |
10 loads 30 loads |
Advanced linear programming
Linear programming is the simplest and most widely used method of mathematical programming. The procedure explained above may be used to determine an optimal solution to problems involving the physical transportation of items. Linear programming can be used in selecting the shortest paths for distributing commodities from a variety of dispatch points to numerous destinations with a view to minimize total transportation costs. The method is extremely useful in evaluating the impact of changes in a transportation network such as road extension on various location problems.
Standard linear programming assumes simple transportation problems in which supplies and demands and the costs of fl ows between pairs of location are known. But transportation problems are more complicated. They often relate to problems involving modal split, transshipment and several allocations where decisions are taken at different stages because they involve assembling components. These transportation problems can also involve probability constraints and queuing theory. To solve these problems, more complex linear programming methods have been developed to meet variable costs, uncertain demand and even non-linear functions. As a result, linear programming and its extension represents one of the most important tools for transport geographers in the analysis of fl ows in a network.
Method 2 – Market area analysis
Market size and shape
Each economic activity possesses a location, but the various demands (raw materials, labor, parts, services, etc.) and fl ows it generates also have a spatial dimension called a market area.
A market area is the surface over which a demand or supply offered at a specifi c location is expressed. For a factory it includes the areas to which its products are shipped; for a retail store it is the tributary area from which it draws its customers.
Transportation is particularly important in market area analysis because it impacts on the location of the activities as well as their accessibility. The size of a market area is a function of its threshold and range:
- Market threshold. The minimum demand necessary to support an economic activity such as a service. Since each demand has a distinct location, a threshold has a direct spatial dimension. The size of a market has a direct relationship with its threshold.
- Market range. The maximum distance each unit of demand is willing to travel to reach a service or the maximum distance a product can be shipped to a customer. The range is a function of transport costs, time or convenience in view of intervening opportunities. To be profi table, a market must have a range higher than its threshold.
Figure 3.10 considers a fairly uniform distribution of customers on an isotropic plane and a single market where goods and services may be purchased. If each customer is willing to purchase one unit per day and the market needs to sell 11 units per day to cover its costs (production or acquisition), then the threshold of the market would be the yellow circle at distance D(T) from the market. However, 29 customers per day, including customers 1 and 2, patronize the market, of which an extra 18 are beyond
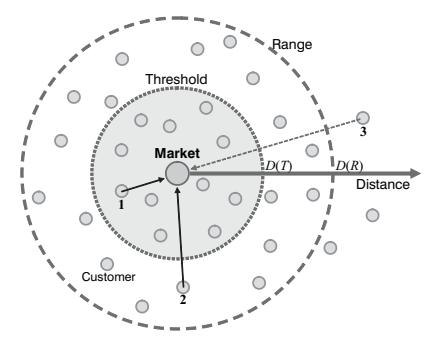
Figure 3.10 Market threshold and range
the threshold distance D(T). They contribute directly to the profi tability of the market. The market range of all these customers is less than distance D(R). Beyond this range, customers, such as customer 3, are unwilling to go to the market. There are different thresholds according to the variety of products or services that can be offered on a market. A threshold may be as low as 250 people for a convenience store or as high as 150,000 people for a theater. If the demand falls below the threshold level, the activity will run at a loss and will eventually fail. If the demand increases above the minimum, the activity will increase its profi ts, which may also lead to increased competition from new service activities. The frequency of use of goods or services is important in assessing the extent of the market threshold, which is often linked to the level of income. A movie theater needing 500 visitors per night will require a threshold population of around 150,000 if the average number of visits is one per year. But, if the average number of visits is three per year, the population threshold drops to 50,000. Three movie theaters instead of one can be supported by the same population.
In the case of a single market area, its shape in an isotropic plane is a simple concentric circle with the market range as radius. Since the purpose of commercial activities is to service all the available demand, when possible, and the range of many activities is limited, more than one location is required to service an area. For such a purpose, a hexagonal-shaped structure of market areas represents the optimal market shape under a condition of isotropy. This shape can be modifi ed by non-isotropic conditions mainly related to variations in density and accessibility.
The left part of Figure 3.11 represents the standard hexagonal shape of a set of markets under isotropic conditions. Each market has the same market area and is evenly spaced. This theoretical condition cannot obviously be found in reality. The two most important non-isotropic conditions impacting on the shape of market areas are differences in density and accessibility. The middle part of the fi gure represents conditions where there is a concentric gradient of population density (from low to high) and a highway crossing through. Their possible outcome on the shape of market areas is portrayed on the right part of the fi gure.
Economic defi nition of a market area
A market depends on the relationship between supply and demand. It acts as a price fi xing mechanism for goods and services. Demand is the quantity of a good or service that consumers are willing to buy at a given price. It is high if the price of a commodity is low, while in the opposite situation – a high price – demand would be low. Outside market price, demand can generally be infl uenced by the following factors:
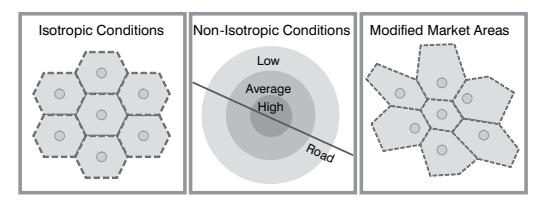
Figure 3.11 Non-isotropic conditions and the shape of market areas
- Utility. While goods and services that are necessities (such as food) do not see much fl uctuation in the demand, items deemed of lesser utility (even frivolous) would vary according to income.
- Income levels. Income, especially disposable income, is directly proportional to consumption. A population with a high income level has much more purchasing power than a population with a low income.
- Infl ation. Involves an increase in the amount of currency in relation to the availability of assets, commodities, goods and services. Commonly the outcome of an indirect confi scation of wealth through an over-issuance of currency ("money printing") by central banks and governments. Although it directly infl uences prices, infl ation is outside the supply–demand relationship and decreases the purchasing power, if wages are not increased accordingly.
- Taxation. Sales and value added taxes can have an inhibiting effect on sales of goods and services as they add to the production costs and claim a share of consumers' income.
- Savings. The quantity of capital available in savings can provide a potential to acquire consumer goods. Also, people may restrain from consuming if saving is a priority, namely in periods of economic hardship. The wide availability of credit in fi at currency systems has considerably skewed the relationships between savings and consumption as it promotes current consumption levels, but at the expense of future consumption.
Supply is the amount of goods or services which fi rms or individuals are able to produce taking account of a selling price. Outside price, supply can generally be infl uenced by the following factors:
- Profi ts. Even if the sales of a product are limited, if profi ts are high an activity providing goods or services may be satisfi ed with this situation. This is particularly the case for luxury goods. If profi ts are low, an activity can cease, thus lowering the supply.
- Competition. Competition is the most important mechanism for establishing prices. Where competition is absent (an oligopoly), or where there is too much (overcompetition), prices artifi cially infl uence supply and demand.
According to the market principle, supply and demand are determined by the price, which is an equilibrium between both. It is often called equilibrium price or market price. This price is a compromise between the desire of fi rms to sell their goods and services at the highest price possible and the desire of consumers to buy goods and services at the lowest possible price.
For many economists, the market is a point where goods and services are exchanged and does not have a specifi c location, since it is simply an abstraction of the relationships between supply and demand. It is important to nuance in this reasoning since most of the time consumers must move in order to acquire a good or service. The producer must also ship a commodity to a place where the consumer can buy it, be it at the store or at his/her residence (in the case of Internet shopping). The concept of distance must thus be considered concomitantly with the concept of market. In those conditions, the real price includes the market price plus the transport price from the market to the location of fi nal consumption.
Competition over market areas
Competition involves similar activities trying to attract customers. Although the core foundation of competition for a comparable good or service is price, there are several spatial strategies that impact the price element. The two most common are:
- Market coverage. Activities offering the same service will occupy locations with a view to offering goods or services to the whole area. This aspect is well explained by the central place theory and applies well for sectors where spatial market saturation is a growth strategy (fast food, coffee shops, etc.). The range of each location will be a function of customer density, transport costs and the location of other competitors.
- Range expansion. Existing locations try to expand their ranges in order to attract more customers. Economies of scale resulting in larger retail activities are a trend in that direction, namely the emergence of shopping malls. Taken individually, each store would have a limited range. However, as a group they tend to attract additional customers from wider ranges for many reasons. First, a complementarity of goods or services is offered. A customer would thus fi nd it convenient to be able to buy clothes, shoes and personal care products at the same location. Second, a diversity of the same goods or services is offered even if they compete with one another. Third, other related amenities are provided such as safety, food, indoor walking space, entertainment and also parking space.
Making market area competition models operational has been the object of numerous approaches. The early work of Hotelling with his principle of market competition, created the foundations of market area analysis by considering factors such as retail location and distance decay. Later, factors such as market size were taken into consideration (Reilly's law) permitting to build complex market areas. Since market areas are often non-monopolistic, this factor was included with market areas becoming ranges of probabilities that customers will attend specifi c locations (Huff's law). Although market areas are particularly relevant for retail analysis, the methodology also applies to timedependent activities, such as freight distribution.
Hotelling was one of the fi rst to introduce the principle of spatial competition by investigating how sellers would choose locations along a linear market. He assumed that the product was uniform so customers would buy from the nearest seller and that the friction of distancewas linear and isotropic. The total price to the customer is thus the market price plus the transport price (time or effort spent to go to the market). Under such circumstances, two competitors will select locations A and B for an optimal market coverage (Figure 3.12). With P1 being the market price, the market boundary would be
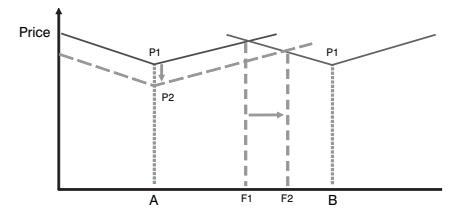
Figure 3.12 Hotelling principle of market competition
F1 (point of cost indifference) since right of F1, customers would get a lower price at location B instead of location A and left of F1, customers would get a lower price at location A. If for any reasons, location A is able to lower the market price from P1 to P2, then its market area would expand at the expense of location B, from F1 to F2.
The purpose of Reilly's law of retail gravitation (1931) is to fi nd a point of indifference between two locations, so the trading area of each can be determined. This point is assumed to be a function of the distance between two locations divided by their respective size (population is often used for this purpose). One location can thus be more attractive than another. For instance, on Figure 3.13 two locations are 75 km apart. According to the Hotelling principle, the point of indifference should be halfway between (35 km). However, since location A has a larger population, it is assumed that it will draw more customers. Under such circumstances, the point of indifference is 45.9 km away from location A.
Huff's retail model (1963) assumes that customers have a choice to patronize a location in view of other alternatives and thus a market area is expressed as probabilities (unless there are no other alternative locations). The point of indifference becomes the point of equal probability that a customer will patronize one location or another. On Figure 3.13, a customer has a greater chance (0.71) to patronize location A at the midpoint than to patronize location B (0.29). The advantage of Huff's retail model is that it leaves room for customer choice.
GIS and market areas analysis
GIS have become useful tools to evaluate market areas, especially in retailing. With basic data, such as a list of customers and their addresses (or ZIP codes) it is relatively easy to evaluate market areas with a reasonable level of accuracy, a task that would have been much more complex beforehand. With GIS, market area analysis left the realm of abstraction to become a practical tool used by retailers and service providers. The market area is a polygon which can be measured and used to perform operations such as intersection (zones of spatial competition) or union (area serviced). Among the major methods of using a GIS to evaluate market areas are (Figure 3.14):
• Concentric circles. The simplest method since it assumes an isotropic effect of distance in all directions. The radius represents the maximum distance a customer is willing to travel. It is useful to have a rough overview of the situation when limited information is available. Buffer creation, a common GIS procedure, associates each concentric circle with a distance (or a time value). They can include the threshold
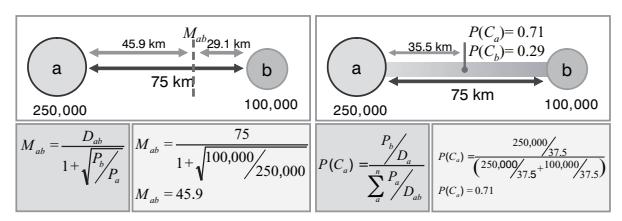
Figure 3.13 Reilly's and Huff's laws
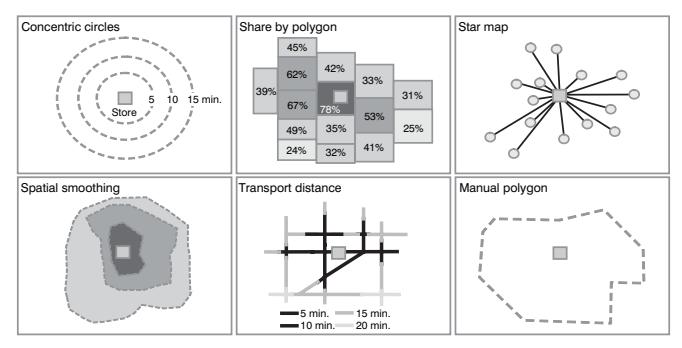
Figure 3.14 GIS methods to estimate market areas
and the range of a store. On Figure 3.14, three concentric circles have been created with a 5-minute distance increment between each. Five minutes is assumed to be the threshold of this activity, while the range is estimated to be 10 minutes.
- Share by polygon. When data is available at the zonal level, such as the ZIP code, the market area can be expressed as a share of the market for each zone. Share by polygon can be estimated in many ways. For instance, it can be an aggregation of individual customers within a geographical unit of reference (ZIP code, census bloc, etc.) or a statistical calculation based on a set of representative variables, such as distance, population, income and age. On Figure 3.14, a market share was calculated for each unit and then classifi ed according to a graduated color expressing the level of membership of the store's market area.
- Star map. Composed of straight lines between each customer and locations. It is an indication of the extent and the shape of the market area and particularly relevant for distribution systems where relationships between distribution centers and their customers are shown. It depicts a market area as a set of customers connected to a store. Qualitative and quantitative attributes can be attached to each vector.
- Spatial smoothing. A trend surface based on the location of actual customers. The higher the density of customers (the importance of each customer can be weighted), the higher the membership of a market area. Spatial smoothing is the outcome of statistical modeling that interpolates data from a known set of points (customers) to a continuous surface. The density of customers thus becomes a statistical surface expressing the market area. On Figure 3.14, spatial smoothing has created a statistical surface expressing three levels of membership of the store's market area (high, average and low).
Transport distance. Particularly useful for retailing or any activity that depends on consumer accessibility or timed deliveries. A measure of transport distance, often driving time in minutes, is calculated on road segments radiating from the facility location. It takes into consideration transport distance, often quite different from Euclidean distance, as well as the different capacities of road segments (number of lanes, driving speed, turn penalties, etc.). A new layer is created where each former road vector is segmented according to distance/time decay through a routing procedure
that originates from the store. On Figure 3.14, roads are segmented according to 5 minute driving time increments from the store location.
Manual polygon. Based on local knowledge, common sense and judgment. It may implicitly consider other methods. They are created with tracing where the analyst evaluates a market area from a set of assumptions, often based on specifi c expertise and empirical knowledge about that market. For instance, the analyst may empirically know that for various reasons few customers may be coming from a nearby neighborhood, excluding it from the market area. It may also be known that few customers are coming from further away than a specifi c street, making that street a boundary for the market area.
Bibliography
Beaverstock, J.V., P. Taylor and R.G. Smith (1999) "A Roster of World Cities", Cities, 16, 445–58.
Berry, B.J.L. (1967) Geography of Market Centers and Retail Distribution, Englewood Cliffs, NJ: Prentice-Hall.
Berry, B.J.L. (1991) Long-wave Rhythms in Economic Development and Political Behavior, Baltimore: Johns Hopkins University Press.
Burrough, P. (1986) Principles of Geographical Information Systems for Land Resource Assessment. Monographs on Soil and Resource Survey No. 12. Oxford: Clarendon Press.
European Conference of Ministers of Transport (2001) Transport and Economic Development, Paris: OECD. http://www1.oecd.org/publications/e-book/7502101E.PDF.
Goodbody Economic Consultants (2003) Transport and Regional Development. http://www. irishspatialstrategy.ie/docs/pdf/Transport%20and%20Regional%20Development.pdf.
Gottmann, J. (1961) Megalopolis: The Urbanized Northeast Seaboard of the United States , New York: Twentieth Century Fund.
Hall, P. (1984) The World Cities, 3rd edn, New York: St. Martin's Press.
Harrington, J.W. and B. Warf (1995) Industrial Location: Principles, Practice & Policy, London: Routledge.
Henderson, J.V., Z. Shalizi and A.J. Venables (2000) Geography and Development, http://econ.lse.ac.uk/ staff/ajv/vhzstv3.pdf.
HOP Associates (2005) "Time, mobility and economic growth", http://www.fl exibility.co.uk/issues/ transport/time-mobility.htm.
ICF Consulting & HLB Decision-Economics (2002) Economic Effects of Transportation: The Freight Story, http://www.ops.fhwa.dot.gov/freight/.
Isard, W. (1956) Location and Space-Economy: A General Theory Relating to Industrial Location, Market Areas, Land Use, Trade, and Urban Structure, Cambridge, MA: MIT Press.
Llewelyn-Davies (2004) Transport and City Competitiveness – Literature Review, Department for Transport, http://www.dft.gov.uk/stellent/groups/dft_science/documents/pdf/dft_science_pdf_ 027353.pdf.
McQuaid, R.W., M. Greig, A. Smyth and J. Cooper (2004) The Importance of Transport in Business Location Decisions, Department for Transport, http://www.dft.gov.uk/stellent/groups/dft_science/ documents/pdf/dft_science_pdf_027294.pdf.
Perroux, F. (1955) "Note sur la Notion de Pôle de Croissance", Economie Appliquée, 7, 307–20.
Pred, A. (1977) City Systems in Advanced Economies: Past Growth, Present Processes and Future Development Options, New York: Wiley.
Preston, R.E. (1985) "Christaller's Neglected Contribution to the Study of the Evolution of Central Places", Progress in Human Geography, 9, 177–93.
Weber, A. (1909; 1929 translation). Alfred Weber's Theory of the Location of Industries, Chicago: University of Chicago Press.
Transportation modes 4
Transportation modes are an essential component of transport systems since they are the means by which mobility is supported. Geographers consider a wide range of modes that may be grouped into three broad categories based on the medium they exploit: land, water and air. Each mode has its own requirements and features, and is adapted to serve the specifi c demands of freight and passenger traffi c. This gives rise to marked differences in the ways the modes are deployed and utilized in different parts of the world. Recently, there is a trend towards integrating the modes through intermodality and linking the modes ever more closely into production and distribution activities. At the same time, however, passenger and freight activity is becoming increasingly separated across most modes.
Concept 1 – A diversity of modes
Transport modes are the means by which people and freight achieve mobility. They fall into one of three basic types, depending on what surface they travel over: land (road, rail and pipelines), water (shipping ), and air. Each mode is characterized by a set of technical, operational and commercial characteristics (see Figure 4.1).
Road transportation
This has become the dominant land transport system today. Automobiles, buses and trucks require a road bed. Such infrastructures are moderately expensive to provide, but there is
| Vehicle | Capacity | 1 Barge Equivalency |
|---|---|---|
| Barge | 1500 Tons 52,500 Bushels 453,600 Gallons |
1 |
| 15 barges on tow | 22,500 Tons 787,500 Bushels 6,804,000 Gallons |
0.06 |
| Hopper car | 100 Tons 3,500 Bushels 30,240 Gallons |
15 |
| 100 car train unit | 10,000 Tons 350,000 Bushels 3,024,000 Gallons |
0.15 |
| Semi-trailer truck | 26 Tons 910 Bushels 7,865 Gallons |
57.7 |
Figure 4.1 Performance comparison for selected freight modes
a wide divergence of costs, from a gravel road to a multi-lane urban expressway. Because vehicles have the means to climb moderate slopes, physical obstacles are less important than for some other land modes. Most roads are provided as a public good by governments, while the vast majority of vehicles are owned privately. The capital costs, therefore, are shared, and do not fall as heavily on one source as is the case for other modes.
All road transport modes have limited abilities to achieve scale economies. This is due to the size constraints imposed by governments and also by the technical and economic limits of the power sources. In most jurisdictions, trucks and buses have specifi c weight and length restrictions which are imposed for safety reasons. In addition, there are serious limits on the traction capacities of cars, buses and trucks because of the considerable increases in energy consumption that accompany increases in the weight of the unit. For these reasons the carrying capacities of individual road vehicles are limited.
Road transport, however, possesses signifi cant advantages over other modes. The capital cost of vehicles is relatively small. This produces several key characteristics of road transport. Low vehicle costs make it comparatively easy for new users to gain entry, which helps ensure that the trucking industry, for example, is highly competitive. Low capital costs also ensure that innovations and new technologies can diffuse quickly through the industry. Another advantage of road transport is the high relative speed of vehicles, the major constraint being government-imposed speed limits. One of its most important attributes is the fl exibility of route choice, once a network of roads is provided. Road transport has the unique opportunity of providing door-to-door service for both passengers and freight. These multiple advantages have made cars and trucks the modes of choice for a great number of trip purposes, and have led to the market dominance of cars and trucks for short-distance trips.
The success of cars and trucks has given rise to a number of serious problems. Road congestionhas become a feature of most urban areas around the world (see Chapters 7 and 10). In addition, the mode is behind many of the major environmental externalities linked to transportation (see Chapter 8). Addressing these issues is becoming an important policy challenge at all levels of jurisdiction, from the local to the global (see Chapter 9).
Rail transportation
Railways require tracks along which the locomotives and rail cars move. The initial capital costs are high because the construction of rail tracks and the provision of rolling stock are expensive. Historically, the investments have been made by the same source (either governments or the private sector). These expenditures have to be made before any revenues are realized and thus represent important entry barriers that tend to limit the number of operators. It also serves to delay innovation, compared with road transport, since rail rolling stock has a service life of at least twenty years.
Railway routing is affected by topography because locomotives have limited capacities to mount gradients. As a result, railwayseither avoid important natural barriers or overcome them by expensive engineering solutions. An important feature of rail systems is the width of the rails. The standard gauge of 1.4351 meters has been adopted in many parts of the world, across North America and most of Western Europe for example. But other gauges have been adopted in other areas. This makes integration of rail services very diffi cult, since both freight and passengers are required to change from one railway system to the other. As attempts are being made to extend rail services across continents and regions, this is an important obstacle, as for example between France and Spain, Eastern and Western Europe, and between Russia and China . The potential of the Eurasian land bridge is limited in part by these gauge differences. Other factors that inhibit the movement of trains between different countries include signaling and electrifi cation standards. These are particular problems for the European Union where the lack of "interoperability" of the rail systems between the member states is a factor limiting the wider use of the rail mode.
The ability of trains to haul large quantities of goods and signifi cant numbers of people over long distances is the mode's primary asset. Once the cars have been assembled or the passengers have boarded, trains can offer a high speed – high capacity service. It was this feature that led to the train's pre-eminence in opening the interior of the continents in the nineteenth century, and is still its major asset. Passenger service is effective where population densities are high. Freight traffi c is dominated by bulk cargo shipments, agricultural and industrial raw materials in particular. Rail transport is a "green" system, in that its consumption of energy per unit load per km is lower than road modes.
Although sometimes identifi ed as a mode that enjoyed its heyday during the nineteenth century, railtransport is enjoying a resurgence because of technological advances in the latter part of the twentieth century. In passenger transport this has come about through signifi cant breakthroughs in speed. For instance, in Europe and Japan high-speed rail systems reach speeds up to 515 km/hr. This gives rail a competitive advantage over road transport and even with air transport over short and medium distances (see Figure 4.2). Japan saw the fi rst comprehensive development of a high-speed trainsystem, notably used along the Tokyo–Osaka corridor in 1964. By the 1990s, the usage of the system had peaked, in part because of competition from air transport. Europe has been the region where the adoption of the high-speed train has been the most signifi cant since the 1990s. Close to a half of all the world's high-speed passengers-km are now occurring in Europe. South Korea is the latest country to build a high-speed rail system along the Seoul–Pusan corridor, which was inaugurated in 2004.
Unit trains, where trains are made up of wagons carrying one commodity-type only, allow scale economies and effi ciencies in bulk shipments, and double stacking has greatly promoted the advantages of railfor containershipments. Rail transport is also enjoying a resurgence as a mode for commuters in many large cities.
Pipelines
Pipelines are an extremely important and extensive mode of land transport, although very rarely appreciated or recognized by the general public, mainly because they are
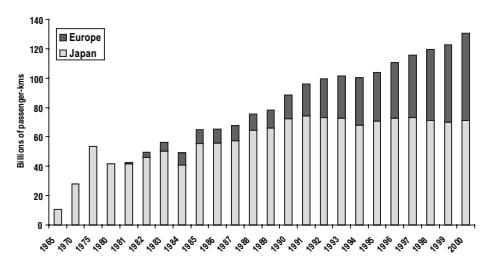
Figure 4.2 Development of high-speed train traffi c, Europe and Japan, 1965–2000
buried underground (or under the sea as in the case of gas pipelines from North Africa to Europe). In the USA, for example, there are 409,000 miles of pipelines that carry 17 percent of all ton/miles of freight. The longest oil pipeline is the TransSiberian, extending over 9,344 km to Western Europe from the Russian arctic oilfi elds in eastern Siberia. Two main products dominate pipeline traffi c: oil and gas, although locally pipelines are signifi cant for the transport of water, and in some rare cases for the shipment of dry bulk commodities, such as coal in the form of slurry.
Pipelines are almost everywhere designed for a specifi c purpose only, to carry one commodity from one location to another. They are built largely with private capital and because the system has to be in place before any revenues are generated, represent a signifi cant capital commitment. They are effective in transporting large quantities of products where no other feasible means of transport (usually water) is available. Pipeline routes tend to link isolated areas of production with major centers of refi ning and manufacture in the case of oil , or major populated areas, as in the case of natural gas.
The routing of pipelines is largely indifferent to terrain, although environmental concerns frequently delay approval for construction. In sensitive areas, particularly in arctic/sub-arctic areas where the pipes cannot be buried because of permafrost, the impacts on migratory wildlife may be severe, and be suffi cient to deny approval, as was the case of the proposed McKenzie Valley pipeline in Canadain the 1970s. The 1,300 km long Trans Alaskan pipeline was built under diffi cult conditions and is above the ground for most of its path. Geo-political factors play a very important role in the routing of pipelines that cross international boundaries. Pipelines from the Middle East to the Mediterranean have been routed to avoid Israel, and new pipelines linking Central Asia with the Mediterranean are being routed in response to the ethnic and religious mosaic of the republics in the Caucasus.
Pipeline construction costs vary according to the diameter of the pipe and increase proportionally with the distance and with the viscosity of the fl uid (need for pumping stations). Operating costs are very low, however, and as mentioned above, pipelines represent a very important mode for the transport of liquid and gaseous products. One major disadvantage of pipelines is the inherent infl exibility of the mode. Once built (usually at great expense), expansion of demand is not easily adjusted to. There exist specifi c limits to the carrying capacity. Conversely, a lessening of supply or demand will produce a lowering of revenues that may affect the viability of the system. A further limit arises out of geographical shifts in production or consumption, in which a pipeline having been built from one location to another may not be able to easily adjust to changes. For example, the refi neries in Montreal, Canada , were served by a pipeline from Portland, Maine in order to receive shipments year-round because of ice on the St. Lawrence River. In the 1980s a pipeline from western Canada was built to provide domestic crude oil at a time when the price of the international supply was escalating. Since then the Portland pipeline has been lying idle.
Water transportation
Shipping exploits the water routes that cross oceans as well as rivers and lakes. Many of the oceanic routes are in international waters and are provided at no cost to the users. In many coastal and inland waters too shippinglanes are "free", although national regulations may exclude foreign vessels from cabotage trade. Physical barriers represent a particular problem for shipping in two areas. First are the sections of inland waterways where water depths and/or rapids preclude navigation. The second is where land barriers separate seas. In both cases canals can provide access for shipping, but they may be tolled. An example of the fi rst type is the St. Lawrence Seaway, while the Suezand Panama canals are examples of the latter. Thus, except for canals, shipping enjoys rights of way that are at no cost to the users. Complementing this advantage are the relatively low operating costs of ships. Ships have the ability to carry large volumes with small energy consumption and limited manpower requirements. Shipping, therefore, is a mode that can offer very low rates compared with other modes.
Even if maritime transport ation has experienced remarkable improvements in safety and reliability, maritime routes are still hindered by dominant winds, currents and general weather patterns. The North Atlantic and the North Pacifi c (50 to 60 degrees north) are subject to heavy wave activity during the winter that sometimes impairs navigation, and may cause ships to follow routes at lower latitudes, thereby increasing the route lengths (see Figure 4.3). During the summer monsoon season (April to October), navigation may become more hazardous on the Indian Ocean and the South China Sea.
Rivers may not be useful for commercial navigation if their orientations do not correspond to the directions of transport demand. Thus, many of the major rivers of Russia fl ow north–south, while the main trade and passenger fl ows are east–west. Shallow draught and extensive obstacles, such as rapids, may also limit navigation. However, many rivers, such as the Rhine or the Chang Jiang, are signifi cant arteries for water transport because they provide access from the oceans to inland markets (see Figure 4.3).
Shipping has traditionally faced two drawbacks. It is slow, with speeds at sea averaging 15 knots (26 km/h). Secondly, delays are encountered in ports where loading and unloading takes place. The latter may involve several days of handling. These drawbacks are particularly constraining where goods have to be moved over short distances or where shippers require rapid service deliveries. There are four broad types of ships employed around the world.
- Passenger vessels can be further divided into two categories: passenger ferries, where people are carried across relatively short bodies of water in a shuttle-type service, and cruise ships, where passengers are taken on vacation trips of various durations, usually over several days. The former tend to be smaller and faster vessels, the latter are usually very large capacity ships.
- Bulk carriers are ships designed to carry specifi c commodities, and are differentiated into liquid bulk and dry bulk vessels. They include the largest vessels afl oat. The largest tankers, the Ultra Large Crude Carriers (ULCC) are up to 500,000 deadweight
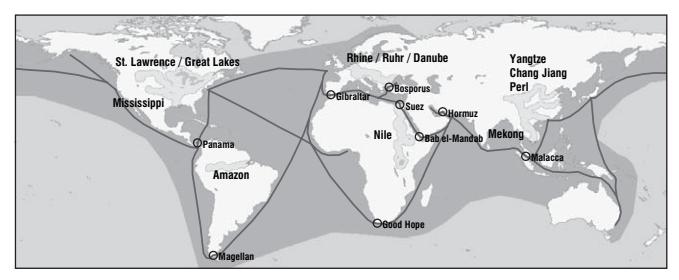
Figure 4.3 Domains of maritime transport
- tons (dwt), with the more typical size being between 250,000 and 350,000 dwt; the largest dry bulk carriers are around 350,000 dwt, while the more typical size is between 100,000 and 150,000 dwt.
- General cargo ships are vessels designed to carry non-bulk cargoes. The traditional ships were less than 10,000 dwt, because of extremely slow loading and off-loading. More recently these vessels have been replaced by container ships that because they can be loaded more effi ciently are becoming much larger, with 80,000 dwt being the largest today.
- Roll on roll off (RORO) vessels, which are designed to allow cars, trucks and trains to be loaded directly on board. Originally appearing as ferries, these vessels are used on deep-sea trades and are much larger than the typical ferry. The largest are the car carriers that transport vehicles from assembly plants to the main markets.
The distinctions in vessel types are further differentiated by the kinds of services on which they are deployed. Bulk ships tend to operate either on a regular schedule between two ports or on voyage basis. In the latter case the ship may haul cargoes between different ports based on demand. General cargo vessels operate on liner services, in which the vessels are employed on a regular scheduled service between fi xed ports of call, or as tramp ships, where the vessels have no schedule and move between ports based on cargo availability.
An important feature of the economics of shippingis the capital costs. Because of their size, ships represent a signifi cant capital outlay. Cruise ships represent the most expensive class of vessels, with the Queen Mary 2 costing \$800 million, but even container ships represent initial capital outlays of \$75 million. The annual cost of servicing the purchase of these vessels represents the largest single item of operating expenditures, typically accounting for over half of the annual operating costs. Container shipping requires the deployment of many vessels to maintain a regular service (14 ships in the case of a typical Far East – Europe service), which is a severe constraint on the entry of new players. On the other hand, older second-hand vessels may be purchased for much smaller amounts, and sometimes the purchase price can be easily covered by a few successful voyages. In some regards, therefore, the shipping industry is quite open and historically has provided opportunities for entrepreneurs to accumulate large fortunes. Many of the largest fl eets are in private hands, owned by individuals or by family groups.
The shipping industry has a very international character. This is refl ected particularly in terms of ownership and fl agging. The ownership of ships is very broad. While a ship may be owned by a Greek family or a US corporation, it may be fl agged under another nationality. Flags of convenience are means by which ship owners can obtain lower registration fees, lower operating costs and fewer restrictions.
The share of open registry ships operated under a fl ag of convenience grew substantially after World War II. They accounted for 5 percent of world shippingtonnage in 1950, 25 percent in 1980, and 45 percent in 1995. The usage of a fl ag of convenience refers to a national owner choosing to register one or more vessels in another nation in order to avoid higher regulatory and manning costs. This enables three types of advantages for the ship owners:
• Regulation. Under maritime law, the owner is bound to the rules and regulations of the country of registration, which also involves requisitions in situation of emergency (war, humanitarian crisis, etc.). Being subject to less stringent regulations commonly confers considerable savings in operating costs.
- Registry costs. The state offering a fl ag of convenience is compensated according to the ship's tonnage. Registry costs are on average between 30 and 50 percent lower than those of North America and Western Europe.
- Operating costs. Operating costs for open registry ships are from 12 to 27 percent lower than for traditional registry fl eets. Most of the savings come from lower manning expenses. Flags of convenience have much lower standards in terms of salary and benefi ts.
The countries with the largest registered fl eets offer fl ags of convenience (Panama, Liberia, Greece, Malta, Cyprus and the Bahamas) and have very lax regulations (see Figure 4.4). Ship registry is a source of additional income for these governments. Even the landlocked country of Mongolia offers ship registry services.
An important historic feature of oceanic liner transport is the operation of conferences. These are formal agreements between companies engaged on particular trading routes. They fi x the rates charged by the individual lines, operating for example between Northern Europe and the East Coast of North America, or eastbound between Northern Asia and the West Coast of North America. Over the years in excess of 100 such conference arrangements have been established. While they may be seen as anti-competitive, the conference system has always escaped prosecution from national anti-trust agencies. This is because they are seen as a mechanism to stabilize rates in an industry that is inherently unstable, with signifi cant variations in supply of ship capacity and market demand. By fi xing rates, exporters are given protection from swings in prices, and are guaranteed a regular level of service provision (Brooks, 2000). Firms compete on the basis of service provision rather than price. A new form of inter-fi rm organization has emerged in the container shipping industry since the mid-1990s. Because the costs of providing ship capacity to more and more markets are escalating beyond the means of many carriers, many of the largest shipping lines have come together by forming strategic alliances with erstwhile competitors. They offer joint services by pooling vessels on the main commercial routes. In this way they are each able to commit fewer ships to a particular service route, and deploy the extra ships on other routes that are maintained outside the alliance. The alliance services are marketed separately, but operationally involve close cooperation in selecting ports of call and in establishing schedules. The alliance structure has led to signifi cant developments in route alignments and economies of scale of container shipping (Slack, 2004).
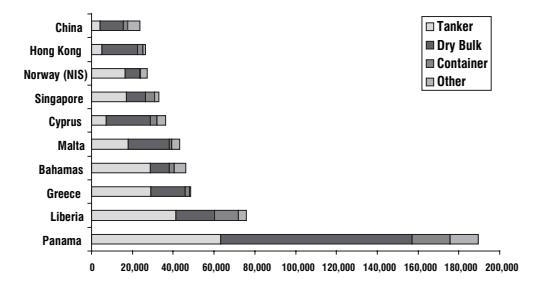
Figure 4.4 Tonnage by country of registry, 2003
Air transportation
Air transport, compared with other modes, has the obvious advantage of speed. This feature has served to offset many of its limitations, among which operating costs, fuel consumption and limited carrying capacities are the most signifi cant. Technology has worked to overcome some of the constraints, most notably the growth of capacity, in which aircraft will soon be capable of transporting 500 passengers or 100 tons of freight. Technology has also signifi cantly extended the range of aircraft, so that while 40 years ago aircraft were just beginning to be capable of crossing the Atlantic without stopping at intermediate places such as Newfoundland, they are now capable of making trips of up to 18 hours duration. Surprisingly, the speed of commercial aircraft has not progressed since the 1960s, when the prospect of supersonic speed was being anticipated with the development of the Anglo-French Concorde, which was removed from service in 2003. Figure 4.5 shows the ranges of three major categories of jet planes:
- Regional. The airbus A320, with a range of 3,700 km, was designed to service destinations within a continent. From New York, most of North America can be reached. This range can be applied to the European continent, South America, East Asia and Africa. This type of aircraft is also used for high demand regional services needing several fl ights a day, enabling to improve the quality of service.
- International. The Boeing 777-100, with a range of 7,400 km, can link one continent to another. From New York, it is possible to reach Western Europe and most of South America.
- Intercontinental. The Boeing 747-400, with a range of 11,400 km, can reach from New York any destination around the world except Australia, South and Southeast Asia. Japan is within range.
Air transport makes use of air space that theoretically gives it great freedom of route choice. While the mode is less restricted than land transport to specifi c rights of way, it is nevertheless much more constrained than might be supposed. In part this is due to physical conditions, in which aircraft seek to exploit (or avoid) upper atmospheric
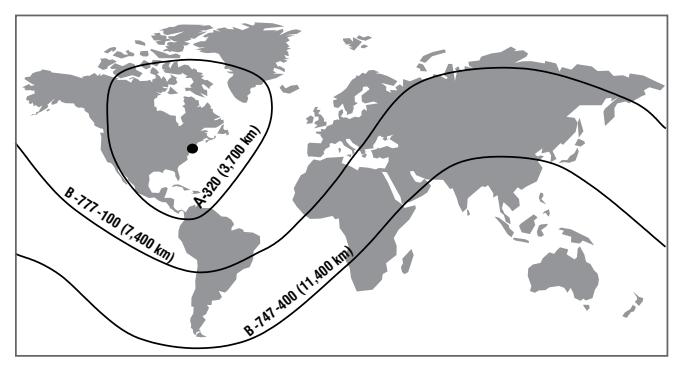
Figure 4.5 Range from New York of different modern commercial jet planes
winds, in particular the jet stream, to enhance speed and reduce fuel consumption. In addition, specifi c corridors have been established in order to facilitate navigation and safety. Strategic and political factors also infl uence route choice. For example, the fl ights of South African Airways were not allowed to over-fl y many African nations during the apartheid period, and Cubana Airlines has been routinely prohibited from over-fl ying the USA.
Like maritime transport, the airline industry is highly capital intensive. For instance, a new Boeing 747-400, used for high-volume and long-distance travel, costs approximately \$200 million, depending on the confi guration, and a new Boeing 737-800, used for regional fl ights, costs about \$60 million. However, unlike the maritime sector, air transportation is labor intensive, with limited room to lower labor requirements, although many airlines are now trying to reduce labor costs by cutting salaries and benefi ts. The industry has become a powerful factor of development, generating globally more than \$700 billion in added value and creating more than 21 million jobs.
The initial development of air transportationtook place in the 1920s and 1930s, not always for commercial reasons (Graham, 1995). It was seen as a means of providing a national air mail service (US) and of establishing long-haul air services to colonies and dependencies (UK and France). Airline companies were set up to provide these national goals, a trend that continued in the post-colonial period of the 1950s to the 1970s, as many African, Asian and Caribbean nations created their own airline companies while reserving them for specifi c markets and for specifi c routes. By convention, an air space exclusively belongs to the country under it, and this has led to signifi cant government control over the industry.
Traditionally, an airline needs the approval of the governments of the various countries involved before it can fl y in or out of a country, or even across another country without landing. Prior to World War II, this did not present too many diffi culties since the range of commercial planes was limited and air transportnetworks were in their infancy and nationally oriented. In 1944, an International Convention was held in Chicago to establish the framework for all future bilateral and multilateral agreements for the use of international air spaces. Five freedom rights were designed, but a multilateral agreement went only as far as the fi rst two freedoms (right to over-fl y and right to make a technical stop).
Freedoms are not automatically granted to an airline as a right, they are privileges that have to be negotiated. All other freedoms have to be negotiated by bilateral agreements, such as the 1946 agreement between the United States and the UK, which permitted limited "fi fth freedom" rights. The 1944 Convention has been extended since then, and as shown in Figure 4.6 there are currently nine different freedoms:
- First Freedom. The right to fl y from a home country over another country (A) enroute to another (B) without landing. Also called the transit freedom.
- Second Freedom. The right for a fl ight from a home country to land in another country (A) for purposes other than carrying passengers, such as refueling, maintenance or emergencies. The fi nal destination is country B.
- Third Freedom. The right to carry passengers from a home country to another country (A) for purpose of commercial services.
- Fourth Freedom. The right to fl y from another country (A) to a home country for purpose of commercial services.
The Third and Fourth Freedoms are the basis for direct commercial services, providing the rights to load and unload passengers, mail and freight in another country.
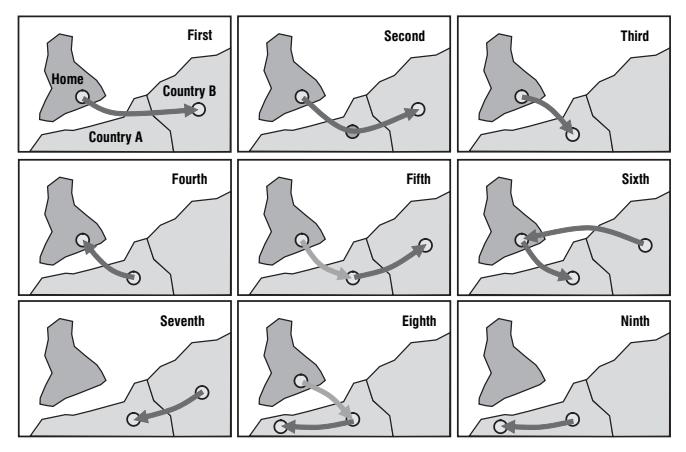
Figure 4.6 Air freedom rights
- Fifth Freedom. This freedom enables airlines to carry passengers from a home country to another intermediate country (A), and then fl y on to a third country (B) with the right to pick up passengers in the intermediate country. Also referred to as "beyond right". This freedom is divided into two categories: Intermediate Fifth Freedom Type is the right to carry from the third country to the second country. Beyond Fifth Freedom Type is the right to carry from the second country to the third country.
- Sixth Freedom. Not formally part of the original 1944 convention, it refers to the right to carry passengers between two countries (A and B) through an airport in the home country. With the hubbing function of most air transportnetworks, this freedom has become more common, notably in Europe (London, Amsterdam).
- Seventh Freedom. Covers the right to operate a passenger service between two countries (A and B) outside the home country.
- Eighth Freedom. Also referred to as "cabotage" privileges. It involves the right to move passengers on a route from a home country to a destination country (A) that uses more than one stop along which passengers may be loaded and unloaded.
- Ninth Freedom. Also referred to as "full cabotage" or "open-skies" privileges. It involves the right of a home country to move passengers within another country (A).
In the 1970s, the perspective changed and air transportwas increasingly seen as just another transport service. Market forces were considered to be the mechanism for fi xing prices and it became widely accepted that airline companies should be given freedom within national markets to decide the nature and extent of their services, while the role of governments should be limited to operational and safety regulations. In the United States , the Air Deregulation Act of 1978 put an end to fi xed markets and opened the industry to competition. This liberalization process has spread to many other countries, although with important local distinctions. Many of the former private fi rms in the USA and many former state-owned airlines elsewhere that were heavily protected and subsidized, went bankrupt or have been absorbed by larger ones. Many new carriers have emerged, with several low-cost carriers such as Ryan Air and South-West Air, having achieved industry leadership. Internationally, air transport is still dominated by bi-lateral agreements between nations (Graham, 1995).
As in the case of ocean shipping, there has been a signifi cant development of alliances in the international airline industry. The alliances are voluntary agreements to enhance the competitive positions of the partners. Members benefi t from greater scale economies, a lowering of transaction costs and a sharing of risks, while remaining commercially independent. The fi rst major alliance was established in 1989 between KLM and North West Airlines. The "Star" alliance was initiated in 1993 between Lufthansa and United Airlines. In 1996, British Airlines and American Airlines formed the "One World" alliance. Other national carriers have joined different alliance groupings. They cooperate on scheduling, code sharing, equipment maintenance and schedule integration. It permits airlines that may be constrained by bi-lateral regulations to offer a global coverage (Agusdinata and de Klein, 2002).
Prior to deregulation movements (end of 1970s–early 1980s), many airline services were taking place on a point-to-point basis. Figure 4.7 shows two airline companies servicing a network of major cities. A fair amount of direct connections exists, but mainly at the expense of the frequency of services and high costs (if not subsidized). Also, many cities are serviced, although differently, by the two airlines and connections are likely to be inconvenient. With deregulation, a system of hub-and-spoke networks emerges as airlines rationalize the effi ciency of their services. A common consequence is that each airline assumes dominance over a hub and services are modifi ed so the two hubs are connected to several spokes. Both airlines tend to compete for fl ights between their hubs and may do so for specifi c spokes, if demand warrants it. However, as this network matures, it becomes increasingly diffi cult to compete at hubs as well as at spokes, mainly because of economies of agglomeration. As an airline assumes
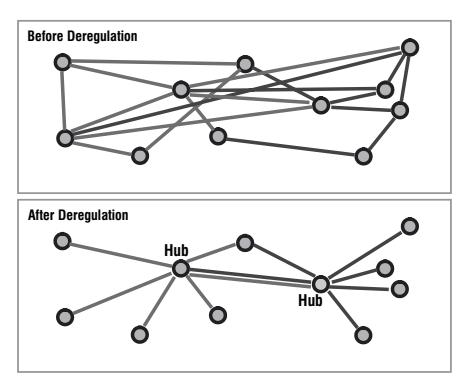
Figure 4.7 Airline deregulation and hub-and-spoke networks
dominance of a hub, it reaches oligopolistic (if not monopolistic) control and may increase airfares for specifi c segments. The advantage of such a system for airlines is the achievement of a regional market dominance and higher plane loads, while passengers benefi t from better connectivity (although delays for connections and changing planes are more frequent) and lower costs.
Air transport is extremely important for both passenger and freight traffi c. In 2000, 1.4 billion passengers traveled by air transport , representing the equivalent of 23 percent of the global population. Passenger traffi c is made up of business travelers and the general public, many of whom are holiday-makers. Air transport is a very signifi cant factor in the growth of international tourism. Figure 4.8 indicates the continued domination of US carriers in passenger transport.
In 2000, 30 million tons of freight was transported, a fi gure that represents one third of the value of all international trade . This freight traffi c is made up of electronics, parcels and parts with a high value-to-weight ratio that are at the heart of contemporary just-in-time and of fl exible production systems. Freight is carried in the belly-hold of passenger airplanes, and provides supplementary income for airline companies. However, with the growth of the freight traffi c an increasing share is being accounted for by all-cargo planes and specialized air freight carriers, either as independent companies or as separate ventures by conventional passenger carriers (see Figure 4.9).
Modal competition
A general analysis of transport modes reveals that they each possess key operational and commercial advantages and properties. Modes can compete or complement each other in terms of cost, speed, reliability, frequency, safety, comfort, etc. Cost is one of the most important considerations in the choice of mode. Because each mode has its own price/performance profi le, the actual competition between the modes depends primarily upon the distance traveled, the quantities that have to be shipped and the value of the goods. Thus, while maritime transport might offer the lowest variable costs, over short distances and for small bundles of goods, road transport tends to be most competitive. A critical factor is the terminal cost structure for each mode, where the costs (and delays) of loading and unloading the unit impose fi xed costs that are incurred independent of
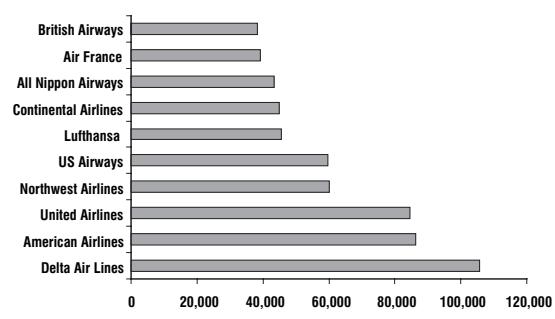
Figure 4.8 World's 10 largest passenger airlines, 2000 (in 1,000 passengers) (Source: IATA, World Air Transport Statistics)
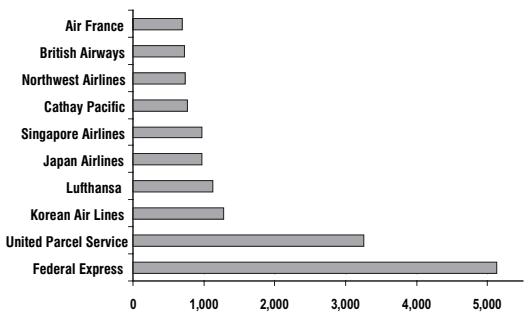
Figure 4.9 World's 10 largest freight airlines, 2000 (in 1,000 tonnes)
the distance traveled (see Chapter 5). As shown in Figure 4.10, different transportation modes have different cost functions. Road, rail and maritime transport have respectively C1, C2, and C3 cost functions. While road has a lower cost function for short distances, its cost function climbs faster than rail and maritime cost functions. At a distance D1, it becomes more profi table to use railway transport than road transport while from a distance D2, maritime transport becomes more advantageous. Point D1 is generally located between 500 and 750 km of the point of departure while D2 is near 1,500 km.
With increasing levels of income the propensity for people to travel rises. At the same time, international trade in manufactured goods and parts has increased. These trends in travel demand act differentially upon the modes. The modes that offer faster and more reliable services gain over modes that offer a lower cost, but slower, alternative. For passenger services, rail has diffi culty in meeting the competition of road transport over short distances and aircraft for longer trips. For freight, rail and shipping have suffered from competition from road and air modes for high value shipments. While shipping, pipelines and rail still perform well for bulkier shipments, intense competition over the last thirty years has seen road and air modes capture an important market share of the high revenue-generating goods. Figure 4.11 shows the modal split in one major market region, where trucks dominate, particularly in terms of value of shipments.
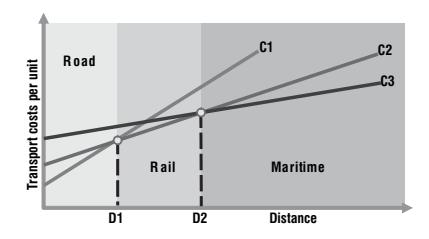
Figure 4.10 Distance, modal choice and transport cost
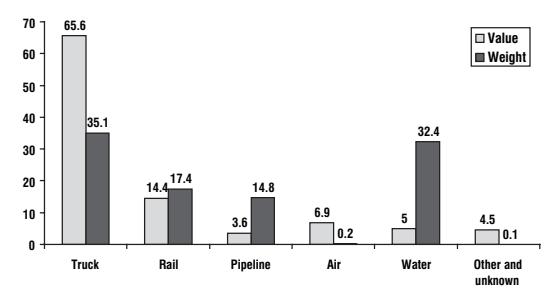
Figure 4.11 Modal shares of US–NAFTA-partner merchandise trade, 2000
There are important geographical variations in modal competition. The availability of transport infrastructures and networks varies enormously. Some regions possess many different modes that in combination provide a range of transport services that ensure an effi cient commercial environment. In many parts of the world, however, there are only limited services, and some important modes may be absent altogether. This limits the choices for people and shippers, and acts to limit accessibility. People and freight are forced to use the only available modes that may not be the most economic for the nature of the demand. Goods may not be able to fi nd a market, and people's mobility may be impaired.
For these reasons, transport provision is seen as a major factor in economic development (see Chapter 3). Areas with limited modal choices tend to be among the least developed. The developed world, on the other hand, possesses a wide range of modes that can provide services to meet the needs of society and the economy.
Concept 2 – Intermodal transportation
The nature of intermodalism
Competition between the modes has tended to produce a transport system that is segmented and un-integrated. Each mode has sought to exploit its own advantages in terms of cost, service, reliability and safety. Carriers try to retain business by maximizing the linehaul under their control. All the modes saw the other modes as competitors, and were viewed with suspicion and mistrust. The lack of integration between the modes was also accentuated by public policy that has frequently barred companies from owning fi rms in other modes (as in the United Statesbefore deregulation), or has placed a mode under direct state monopoly control (as in Europe). Modalism was also favored because of the diffi culties of transferring goods from one mode to another, thereby incurring additional terminal costs and delays.
The use of several modes of transport has frequently occurred as goods are shipped from the producer to the consumer. When several modes are used this is referred to as multimodal transport. Within the last forty years efforts have been made to integrate separate transport systems through intermodalism. What distinguishes intermodal from multimodal transport is that the former involves the use of at least two different modes in a trip from origin to destination under a single transport rate. Intermodality enhances the economic performance of a transport chain by using the modes in the most productive manner. Thus, the line-haul economies of rail may be exploited for long distances, with the effi ciencies of trucks providing local pick up and delivery. The key is that the entire trip is seen as a whole, rather than as a series of legs, each marked by an individual operation with separate sets of documentation and rates.
Figure 4.12 illustrates two alternatives to freight distribution. The fi rst is a conventional point-to-point multimodal network where origins (A, B and C) are independently linked to destinations (D, E and F). In this case, two modes (road and rail) are used. The second alternative involves the development of an integrated intermodaltransport network . Traffi c converges at two transshipment points, rail terminals, where loads are consolidated. This can result in higher load factors and/or higher transport frequency, especially between terminals. Under such circumstances, the effi ciency of such a network mainly resides in the transshipment capabilities of transport terminals.
The emergence of intermodalism has been brought about in part by technology (Muller, 1995). Techniques for transferring freight from one mode to another have facilitated intermodaltransfers. Early examples include piggyback (TOFC: trailers on fl at cars), where truck trailers are placed on rail cars, and LASH (lighter aboard ship), where river barges are placed directly on board sea-going ships. The major development undoubtedly has been the container , which permits easy handling between modal systems. Containers have become the most important component for rail and maritime intermodal transportation.
While handling technology has infl uenced the development of intermodalism, another important factor has been the changes in public policy. Deregulation in the United States in the early 1980s liberated fi rms from government control. Companies were no longer prohibited from owning across modal types, and there developed a strong impetus towards intermodalcooperation. Shipping lines, in particular, began to offer integrated rail and road service to customers. The advantages of each mode could be exploited in a seamless system. Customers could purchase the service to ship their products from door to door, without having to concern themselves about modal barriers. With one bill of lading clients can obtain one through rate, despite the transfer of goods from one mode to another (Hayuth, 1987).
The provision of through bills of lading in turn necessitated a revolution in organization and information control. At the heart of modern intermodalism are data handling, processing and distribution systems that are essential to ensure the safe, reliable and cost-effective control of freight movements across several modes. Electronic Data
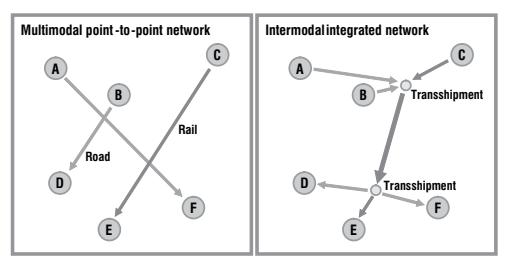
Figure 4.12 Multimodal and intermodal transportation
Interchange (EDI) is an evolving technology that is helping companies and government agencies (customs documentation) to cope with an increasingly complex global transport system.
Intermodalism, the container and maritime transport
Intermodalism originated in maritime space, with the development of the containerin the late 1960s and has since spread to integrate other modes. It is not surprising that the maritime sector should have been the fi rst mode to pursue containerization. It was the mode most constrained by the time taken to load and unload the vessels. Containerization permits the mechanized handling of cargoes of diverse types and dimensions that are placed into boxes of standard dimensions. In this way, goods that might have taken days to be loaded or unloaded from a ship can now be handled in a matter of minutes (Slack, 1998).
One of the keys to the success of the containeris that the International Standards Organization (ISO) very early on established base dimensions. The reference size is the 20-foot box, 20 feet long, 8 feet high and 8 feet wide, or 1 Twenty-foot Equivalent Unit (TEU). The other major size is the 40-foot box, which has the capacity to carry 4,400 VCRs or 267,000 video games or 10,000 pairs of shoes. Containers are either made of steel or aluminum and their structure confers fl exibility and hardiness. Each year, about 1.5 million TEU worth of containers are manufactured. The global inventory of containers was estimated to be around 15.9 million TEU by 2002. The standard 20-foot container costs about \$2,000 and a 40-footer about \$4,000.
Among the numerous advantages related to the success of containers in international transport, it is possible to note several elements:
- Standard transport product. A containercan be manipulated anywhere in the world as its dimensions are an ISO standard. Indeed, transfer infrastructures allow all elements (vehicles) of a transport chain to handle it with relative ease. The rapid diffusion of containerization was facilitated by the fact that its initiator, Malcolm McLean, purposely did not patent his invention. Consequently all segments of the industry, competitors alike, had access to the standard. It necessitated the construction of specialized ships and of lifting equipment.
- Flexibility of usage. A container can transport a wide variety of goods, ranging from raw materials (coal, wheat), manufactured goods, and cars to frozen products. There are specialized containers for transporting liquids (oil and chemical products) and perishable food items in refrigerated containers or reefers. About 1 million TEUs of reefers were being used by 2002.
- Management. The container , as an indivisible unit, carries a unique identifi cation number and a size type code, enabling transport management not only in terms of loads, but in terms of unit. Computerized management reduces waiting times considerably and allows the position of containers to be traced at any time. It enables containers to be assigned according to the priority, destination and available transport capacities.
Costs. Containerization of shipping has reduced costs signifi cantly. Before containerization, maritime transport costs could account for between 5 and 10 percent of the retail price of manufactured products; this share has been reduced to 1.5 percent. The main factors behind costs reductions reside in the speed and fl exibility incurred by containerization. It has permitted shipping to achieve ever greater economies of scale through the introduction of larger ships. A 5,000 TEU containershiphas operating costs per container that are 50 percent lower than a 2,500 TEU vessel.
Speed. Transshipment operations are minimal and rapid. A modern container ship has a monthly capacity of three to six times more than a conventional cargo ship. This is notably attributable to gains in transshipment time as a crane can handle roughly 30 movements (loading or unloading) per hour. Port turnaround times have thus been reduced from 3 weeks to about 24 hours. It takes on average between 10 and 20 hours to unload 1,000 TEUs compared with between 70 and 100 hours for a similar quantity of general cargo. A regular freighter can spend between half and two-thirds of its useful life in port. With less time in port, containerships can spend more time at sea, and thus be more profi table to operators. Further, containerships are on average 35 percent (19 knots versus 14 knots) faster than regular freighter ships. System-wide, the outcome has been a reduction of costs by about 30 percent because of containerization.
Warehousing. The containerlimits the risks for goods it transports because it is resistant to shocks and weather conditions. The packaging of goods it contains is therefore simpler and less expensive. Containers fi t together, permitting stacking on ships and on the ground. The container is consequently its own warehouse.
Security. The contents of the container are anonymous to outsiders as it can only be opened at the origin, at customs and at the destination. Thefts, especially those of valued commodities, are therefore considerably reduced.
In spite of numerous advantages in the usage of containers, some drawbacks are evident:
- Consumption of space. A containership of 25,000 tons requires a minimum of 12 hectares of unloading space. Conventional port areas are not adequate for container handling. Consequently, containers have modifi ed the local geography of ports (see Chapter 5).
- Infrastructure costs. Container handling infrastructures, such as gantry cranes, yard equipment, road and rail access, represent important investments for port authorities and load centers. Several developing countries cannot afford these infrastructures and so cannot participate in international trade.
- Management logistics. The management logistics of containers is very complex. This requires high levels of information technology for the recording, positioning and ordering of containers handled.
- Empty travel. At the global scale, it is rare for the origins and destinations of containers to be in equilibrium. Most containertrade is imbalanced, and thus containers "accumulate" in some places and must be shipped back to locations where there are defi cits. Many containers are moved empty. Either full or empty, a container takes the same amount of space on the ship or in a storage yard and takes the same amount of time to be transshipped. As a result, shippinglines waste substantial amounts of time and money in repositioning empty containers.
- Illicit trade. By its confi dential character, the containeris a common instrument used in the illicit trade of drug and weapons, as well as for illegal immigrants. Concerns have also been raised about containers being used for terrorism. Electronic scanning systems are being implemented to remotely inspect the contents of containers at major gateways.
Intermodalism and other modes
With the deregulation and privatization trends begun in the 1980s, containerization, which was already well established in the maritime sector, could spread inland. The
shipping lines were among the fi rst to exploit the intermodalopportunities that US deregulation permitted. They could offer door-to-door rates to customers by integrating rail services and local truck pick up and delivery in a seamless network. To achieve this they leased trains, managed rail terminals, and in some cases purchased trucking fi rms. In this way, they could serve customers across the country by offering door-to-door service from suppliers located around the world. The move inland also led to some signifi cant developments, most notably the double-stacking of containers on rail cars. This produced important competitive advantages for intermodal rail transport (Muller, 1995).
Other parts of the world have not developed the same degree of synergies between rail and shipping as is found in North America. However, there appears to be a trend towards closer integration in many regions. In Europe, rail intermodal services are becoming well established between the major ports, such as Rotterdam, and southern Germany, and between Hamburg and Eastern Europe (van Klink and van den Berg, 1998). Rail shuttles are also making their appearance in China .
While rail intermodaltransport has been relatively slow to develop in Europe, there are extensive interconnections between barge services and ocean shipping, particularly on the Rhine (Notteboom and Konings, 2004). Barge shipping offers a low-cost solution to inland distribution where navigable waterways penetrate to interior markets. This solution is being tested in North America, where the Port Authority of New York and New Jersey is sponsoring barge services to Albany and several other destinations.
While it is true that the maritime containerhas become the work horse of international trade , other types of containers are found in certain modes, most notably in the airline industry. High labor costs and the slowness of loading planes, which require a very rapid turnaround, made the industry very receptive to the concept of a loading unit of standard dimensions. The maritime container was too heavy and did not fi t the rounded confi guration of a plane's fuselage, and thus a box specifi c to the needs of the airlines was required. The major breakthrough came with the introduction of wide-bodied aircraft in the late 1970s. Lightweight aluminum boxes could be fi lled with passengers' baggage or parcels and freight, and loaded into the holds of the planes using tracking that requires little human assistance.
A unique form of intermodal unit has been developed in the rail industry, particularly in the USA. Roadrailer is essentially a road trailer that can also roll on rail tracks. It is unlike the TOFC (piggyback) system that requires the trailer be lifted onto a rail fl at car. Here the rail bogies may be part of the trailer unit, or be attached in the railway yard. The road unit becomes a rail car, and vice versa. It is used extensively by a major US rail company, Norfolk Southern, whose "Triple Crown" service provides just-in-time deliveries between the automobile parts manufacturers located in Michigan, and the assembly plants located in Georgia, Texas and Mexico and Canada .
Intermodalism and production systems
NS's Triple Crown Service is but one example of how transport chains are being integrated into production systems. As manufacturers spread their production facilities and assembly plants around the globe to take advantage of local factors of production, transportation becomes an ever more important issue. The integrated transport chain is itself being integrated into the production and distribution processes. Transport can no longer be considered as a separate service that is required only as a response to supply and demand conditions. It has to be built into the entire supply chain system, from multisource procurement, to processing, assembly and fi nal distribution (Robinson, 2002).
While many manufacturing corporations may have in-house transportation departments, increasingly the complex needs of the supply chain are being contracted out to third parties. Third party logistics providers (3PL) have emerged from traditional intermediaries such as forwarders, or from transport providers such as FEDEX or Maersk-SeaLand. Because the latter are transporters themselves, they are referred to as fourth party logistics providers (4PL). Both groups have been at the forefront of the intermodal revolution that is now assuming more complex organizational forms and importance. In offering door-to-door services, the customer is no longer aware or necessarily concerned with how the shipment gets to its destination. The modes used and the routing selected are no longer of immediate concern. The preoccupation is with cost and level of service. This produces a paradox, that for the customer of intermodal services geographic space becomes meaningless; but for the intermodal providers routing and modal choice assume an ever greater importance.
Concept 3 – Passengers or freight?
Advantages and disadvantages
With some exceptions, such as buses and pipelines, most transport modes have developed to handle both freight and passenger traffi c. In some cases both are carried in the same vehicle, as for example in the airlines where freight is transported in the cargo holds of passenger aircraft. In others, different types of vehicle have been developed for freight and passenger traffi c, but they both share the same road bed, as for example in rail and road traffi c. In shipping , passengers and freight used to share the same vessel, but since the 1950s specialization has occurred, and the two are now quite distinct, except for ferries and some RORO services.
The sharing by freight and passengers of a mode is not without diffi culties, and indeed some of the major problems confronting transportation occur where the two seek to co-inhabit. For example, trucks in urban areas are seen as a nuisance and a cause of congestion by passenger transport users. The poor performance of some modes, such as rail , is seen as the outcome of freight and passengers having to share routes. This raises the question as to whether freight and passengers are compatible. The main advantages of joint operations are:
- High capital costs can be justifi ed more easily with a diverse revenue stream (rail, airlines, ferries).
- Maintenance costs can be spread over a wider base (rail, airlines).
- The same traction sources can be used for both freight and passengers, particularly for rail.
The main disadvantages of joint operations are:
- Locations of demand rarely match origin/destination of freight is usually quite distinct spatially from passenger traffi c.
- Frequency of demand is different for passengers the need is for high frequency service, for freight it tends to be somewhat less critical.
- Timing of service demand for passenger services has specifi c peaks during the day, for freight it tends to be more evenly spread throughout the day.
Traffi c balance on a daily basis passenger fl ows tend to be in equilibrium, for freight, market imbalances produce empty fl ows.
Reliability although freight traffi c increasingly demands quality service, for passengers delays are unacceptable.
Sharing routes favors passenger traffi c passenger trains are given priority; trucks may be excluded from areas at certain times of the day.
Different operational speeds passengers demand faster service.
Security screening measures for passengers and freight require totally different procedures.
A growing divergence
In several modes and across many regions passenger and freight transport is being unbundled.
- Shipping. It has already been mentioned that in the maritime sector passenger services have become divorced from freight operations, the exception being some ferry services where the use of RORO ships on high frequency services adapt to the needs of both market segments. Deep sea passenger travel is now dominated by cruise shippingwhich has no freight-handling capabilities, and bulk and general cargo ships rarely have an interest or the ability to transport passengers.
- Rail. Most railsystems still operate passenger and freight business. Where both segments are maintained, the railways give priority to passengers, since rail persists as the dominant mode for inter-city transport in India , Chinaand much of the developing world. In Europe, the national rail systems and various levels of government have prioritized passenger service as a means of checking the growth of the automobile, with its resultant problems of congestion and environmental degradation (see Chapter 8). Signifi cant investments have occurred in improving the comfort of trains and in passenger rail stations, but most notable have been the upgrading of track and equipment in order to achieve higher operational speeds. Freight transport has tended to lose out because of the emphasis on passengers. Because of their lower operational speeds, freight trains are frequently excluded from daytime slots, when passenger trains are most in demand. Overnight journeys may not meet the needs of freight customers. This incompatibility is a factor in the loss of freight business by most rail systems still trying to operate both freight and passenger operations. In Europe, there are signs that the two markets are being separated. First, it is occurring at the management level. The liberalization of the railway system that is being forced by the European Commission is resulting in the separation of passenger and freight operations. This had already taken place in the UK when British Rail was privatized. Second, the move towards high-speed passenger rail service necessitated the construction of separate rights of way for the TGVtrains. This has tended to move passenger train services from the existing tracks, thereby opening up more daytime slots for freight trains. Third, the Dutch are building a freight only track, the Betuwe Line, from the port of Rotterdam to the German border, having already sold the freight business of the Netherlands railway (NS) to DB (Deutsche Bahn), and having opened up the freight business to other fi rms. In North America, the divorce between freight and passenger rail business is most complete. The private railway companies could not compete against the automobile and airline industry for passenger traffi c, and consequently withdrew from the passenger business in the 1970s. They were left to operate a freight only system, which has generally been successful, especially with the introduction of intermodality. The passenger business has been taken over by public agencies, AMTRAK in the USA, and VIA Rail in Canada . Both are struggling
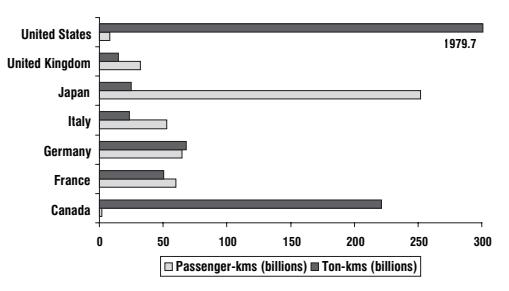
Figure 4.13 Domestic rail passenger travel and freight activity, G7 Countries, 1996 (Source: US Department of Transportation, BTS, G–7 Countries: Transportation Highlights)
to survive. A major problem is that they have to lease trackage from the freight railways, and thus slower freight trains have priority (Figure 4.13).
- Roads. Freight and passenger vehicles still share the roads. The growth of freight traffi c is helping increase road congestion and in many cities concerns are being raised about the presence of trucks (see Chapters 7 and 9). Already, restrictions are in place on truck dimensions and weights in certain parts of cities, and there are growing pressures to limiting truck access to non-daylight hours. Certain highways exclude truck traffi c – the parkways in the USA for example. These are examples of what is likely to become a growing trend – the need to separate truck from passenger vehicle traffi c. Facing chronic congestion around the access points to the port of Rotterdam and at the freight terminals at Schiphol airport, Dutch engineers have worked on feasibility studies of developing separate underground road networks for freight vehicles.
- Air transport. Air transport is the mode where freight and passengers are most integrated. Yet even here a divergence is being noted. The growth of all-freight airlines and the freight-only planes operated by some of the major carriers, such as Singapore Airlines, are heralding a trend. The interests of the shippers, including the timing of the shipments and the destinations, are sometimes better served than in passenger aircraft. The divergence between passengers and freight is also being accentuated by the growing importance of charter and "no frills" carriers. Their interest in freight is very limited, especially when their business is oriented towards tourism, since tourist destinations tend to be lean freight generating locations.
Method 1 – Technical performance indicators
Indicators
Multimodal transportation networks rest upon the combinatory costs and performance of transport modes, or what is referred to as economies of scope. For instance, a single container shipped overseas at the lowest cost from its origin can go from road, to seaway, to railway and to road again before reaching its destination. Freight shippers and carriers therefore require quantitative tools for decision-making in order to compare performances of various transport modes and transport networks. Time-effi ciency
becomes a set imperative for both freight and passenger transit in private as well as in public sector activities.
Performance indicators are widely used by geographers and economists to empirically assess the technical performance (not to be confused with economic performance, for there can exist a lag between the two) of differing transport modes, in other words their capacity to move goods or passengers around. Hence, basic technical performance calculations can be particularly useful for networks' global performance analysis as well as for modal comparison, analysis, and evaluation by bridging both physical attributes (length, distance, confi guration, etc.) and time-based attributes (punctuality, regularity, reliance, etc.) of networks. Some indicators are currently used to measure freight and passenger transport. Table 4.1 gives a few of the most common ones.
Passenger-km or ton-km are standard units for measuring travel that consider the number of people traveling or ton output and distance traveled. For example, 120 passenger-km represents 10 passengers traveling 12 kilometers or 2 passengers traveling 60 kilometers, and so on. More specifi cally, such indicators are of great utility by allowing cross-temporal analysis of a transport nexus or given transport modes.
Economic impact indicators
Undoubtedly, transportation plays a considerable role in the economy with its omnipresence throughout the production chain, at all geographic scales. It is an integral constituent of the production–consumption cycle. Economic impact indicators help to appreciate the relationship between transport systems and the economy as well as to inform on the economic weight of this type of activity. Geographers should be familiar with basic econometric impact indexes (see Table 4.2).
Effi ciency is usually defi ned as the ratio of input to output, or the output per each unit of input. Modal variations in effi ciency will depend heavily on what is to be carried, the distance traveled, the degree and complexity of logistics required as well as economies of scale. Freight transport chains rest upon the complementarity of cost-effi cient and
| Indicator | Passenger | Freight | Description |
|---|---|---|---|
| Passenger/freight density passenger-km/km | ton-km/km | A standard measure of transport effi ciency. |
|
| Mean distance traveled | passenger-km/passenger | ton-km/ton | A measure of the ground covering capacity of networks and different transport modes. |
| Mean per capita ton output (freight) Mean number of trips per capita (passenger) |
passengers/population | tons/population | Used to measure the relative performance of transport modes. |
| Mean occupation coeffi cient |
number of passengers aboard/total carrying capacity (%) |
actual load (ton)/ overall load capacity (ton) (%) |
Especially useful with increasing complexity of logistics associated with containerization of freight (i.e. the problem of empty returns). Can also be used to measure transit ridership. |
Table 4.1 Commonly used performance indicators
Table 4.2 Measures of effi ciency
| Effi ciency indicators | Scale-specifi c indicators | | |
|-------------------------|------------------------------------------|------------|--|
| (Factors of production) | Micro | Meso-macro | |
| output/capital | transport sector income/
local income | output/GDP | |
| output/labor | output/local income | | |
time-effi cient modes, seeking most of the time a balanced compromise rather than an ideal or perfect equilibrium.
Maritime transport is still the most cost-effi cient way to transport bulk merchandise over long distances. On the other hand, while air transport is recognized for its unsurpassed time-effi ciency versus other modes over long distances, it remains an expensive option. Thus, vertical integration, or the absorption of transportation activities by producers, illustrates the search for these two effi ciency attributes by gaining direct control over inputs.
Transportation and economic impacts
The relationship between transport systems and their larger economic frame becomes clear when looking at restructuring patterns which carriers and fi rms are currently undergoing. Structural mutations, best illustrated by the popularity of just-in-time practices, are fuelled by two opposing yet effective forces: transporters seek to achieve economies of scale while having to conform to an increasingly "customized" demand.
Factor substitution is a commonly adopted path in order to reduce costs of production and attain greater effi ciency. Containerization of freight by substituting labor for capital and technology is a good illustration of the phenomenon. Measures of capital productivity for such capital-intensive transport means are of central importance; an output/capital ratio is then commonly used. While the output/labor ratio performs the same productivity measurement but for the labor input (this form of indicator can be used for each factor of production in the system), a capital/labor ratio aims at measuring which factor predominates within the relationship between capital and labor productivity. The above set of indicators therefore provides insights on the relative weight of factors within the production process.
More scale-specifi c indicators can also be used to appreciate the role of transport within the economy. Knowing freight transport both contributes to and is fuelled by a larger economic context, freight output can be confronted against macro-economic indicators: an output/GDP ratio measures the relationship between economic activity and traffi c freight, in other words the traffi c intensity. At the local level, the status of the transport industry within the local economy is given by a transport sector income / local income ratio. Still at a micro-scale, fi nally, a measure of the relative production value of freight output is provided by an output/local income ratio.
Underlying objectives of application of such indicators are as varied as they are numerous. Effi ciency indicators constitute valuable tools to tackle project viability questions as well as to measure investment returns and cost/subsidy recovery of transport systems. Input–output analyses making use of some of the above indicators are also instrumental to the development of global economic impact indexes and productivity assessment concepts such as the Total Factor Productivity (TFP) and to identify sources of productivity gains.
Specialization index
In transport, to fi nd out if a terminal is specialized in the transshipment and/or handling of a particular kind of merchandise or if, inversely, it transfers a wide variety of merchandise, we can calculate a specialization index. For example, the index can be used to know if a port is specialized in the handling of a certain type of product (e.g. containers) or if it handles a wide range of merchandise. As a consequence, such an index is quite versatile and has a variety of applications; it informs geographers on the activities of any type of terminal (port, train and airport ). In the case of an airport terminal, one could ask if a given airport deals with only a single type of fl ights/passengers (local, national, international, etc.) or if it welcomes several. The specialization index (SI) is calculated using the following formula:
$$SI = \sum{i} t{i}^{2} / \left(\sum{i} t{i}\right)^{2}$$
which is the total of squares of tonnage (or monetary value) of each type of merchandise i (t ) handled at a terminal over the square of the total volume tonnage (or monetary value) of merchandise handled at the terminal.
So, if the specialization index tends toward 1, such a result indicates that the terminal is highly specialized. If, inversely, the index tends toward 0, it means that the terminal's activity is diversifi ed. Thus, the specialization index is called upon to appreciate the degree of specialization/diversifi cation of a port, an airport, a train station or any type of terminal.
Location coeffi cient
Certain kinds of merchandise are often transshipped at particular terminals rather than at others. Thus, the degree of concentration of a certain type of traffi c in a terminal (port, airport, train station) compared with the average for all the terminals, can be measured by using the location coeffi cient.
The location coeffi cient is the share of traffi c occupied by a type of merchandise at a terminal over the share of traffi c of the same type of merchandise among the total traffi c of all terminals of the same type.
In the fi eld of transportation, the location coeffi cient (LC) is calculated by using the following formula:
$$LC = \frac{\left(\frac{M{ii}}{\sum M{ii}}\right)}{\left(\frac{\sum M_{i}}{\sum M}\right)}$$
where Mti is the traffi c of a merchandise t at a terminal i, Mt is the total of all merchandises of type t for all terminals and M is the total of all types of merchandises for all terminals.
The greater the value of the index, the greater is the degree of traffi c of a certain type of merchandise. Possible outcomes are of three types:
- A fi gure lower than 1 indicates that the traffi c of the chosen merchandise in the terminal is under-represented compared with the same merchandise in all the terminals.
- A fi gure equal to 1 indicates that the quantity of traffi c of the chosen merchandise in a terminal is proportional to its participation in total traffi c.
- Finally, a coeffi cient above 1 indicates that the traffi c of the chosen merchandise in a given terminal is preponderant in total traffi c.
Beside using the location coeffi cient to evaluate the relative weight of a type of traffi c in a terminal, the location coeffi cient can be used to appreciate the importance of an economic activity for a community compared with the importance of the same activity within a defi ned larger area (e.g. province, country, world, etc.). The larger geographic entity is also known as the benchmark and is critical in the calculation of the location coeffi cient.
References
Agusdinata, B. and W. de Klein (2002) "The Dynamics of Airline Alliances", Journal of Air Transport Management, 8, 201–11.
Brooks, M. (2000) Sea Change in Liner Shipping, New York: Pergamon.
Graham, B. (1995) Geography and Air Transport, Chichester: Wiley.
Hayuth, Y. (1987) Intermodality, Essex: Lloyds of London Press.
Muller, G. (1995) Intermodal Transport, Westport, CT: Eno Foundation.
Notteboom, T. and R. Konings (2004) "Network Dynamics in Container Transport by Barge", Belgeo, 5, 461–77.
Robinson, R. (2002) "Ports as Elements in Value-driven Chain Systems: The New Paradigm", Maritime Policy and Management, 29, 241–55.
Slack, B. (1998) "Intermodal Transportation" in B.S. Hoyle and R. Knowles (eds) Modern Transport Geography, 2nd edn, Chichester: Wiley, pp. 263–90.
Slack, B. (2004) "Corporate Realignment and the Global Imperatives of Container S hipping" in D. Pinder and B. Slack (eds) Transport in the Twenty-First Century, London: Routledge, pp. 25–39.
van Klink, A. and G.C. van den Berg (1998) "Gateways and Intermodalism", Journal of Transport Geography, 6, 1–9.
Transport terminals 5
All spatial fl ows, with the exception of personal vehicular and pedestrian trips, involve movements between terminals. With these two exceptions, all transport modes require assembly and distribution of their traffi c, both passenger and freight. For example, passengers have to go to bus terminals and airports fi rst in order to reach their fi nal destinations, and freight has to be consolidated at a port or a rail yard before onward shipment. Terminals are, therefore, essential links in transportation chains. The goal of this chapter is to examine the strong spatial and functional character of transport terminals. They occupy specifi c locations and they exert a strong infl uence over their surroundings. At the same time they perform specifi c economic functions and serve as foci for clusters of specialized services.
Concept 1 – The function of transport terminals
The nature of transport terminals
A terminal may be defi ned as any facility where freight and passengers are assembled or dispersed. They may be points of interchange involving the same mode of transport. Thus, a passenger wishing to travel by train from Paris to Antwerp may have to change in Brussels, or an air passenger wishing to fl y between Montreal and Winnipeg may have to change planes in Toronto. They may also be points of interchange between different modes of transport, so that goods being shipped from the US Mid-West to the Ruhr in Germany may travel by rail from Cincinnati to the port of New York, be put on a ship to Rotterdam, and then placed on a barge for delivery to Duisberg. Transport terminals, therefore, are central and intermediate locations in the movements of passengers and freight.
In order to carry out the transfer and bundling of freight and passengers, specifi c equipment and infrastructures are required. Differences in the nature, composition and timing of transfer activities give rise to signifi cant differentiations in the form and function between terminals. A basic distinction is between passenger and freight transfers, because in order to carry out the transfer and bundling of each type, specifi c equipment and infrastructures are required.
Passenger terminals
With one exception, passenger terminals require relatively little specifi c equipment. This is because individual mobility is the means by which passengers access buses, ferries or trains. Certainly, services such as information, shelter, food and security are required, but the layouts and activities taking place in passenger terminals tend to be simple and require relatively little equipment. They may appear congested at certain times of the day, but the fl ows of people can be managed successfully with good design of platforms and access points, and with appropriate scheduling of arrivals and departures. The amount of time passengers spend in such terminals tends to be brief. As a result bus termini and railway stations tend to be made up of simple components, from ticket offi ces and waiting areas to limited amounts of retailing.
Airports are of a different order. They are among the most complex of terminals functionally (Caves and Gosling, 1999). Moving people through an airport has become a very signifi cant problem, not least because of security concerns. Passengers may spend several hours in transit, with check-in and security checks on departure, and baggage pick up and in many cases customs and immigration on arrival. Planes may be delayed for a multitude of reasons. The result is that a wide range of services have to be provided for passengers not directly related to the transfer function, including restaurants, bars, stores, hotels, in addition to the activities directly related to operations such as checkin halls, passenger loading ramps and baggage handling facilities. At the same time, airports have to provide for the very specifi c needs of the aircraft, from runways to maintenance facilities, from fi re protection to air traffi c control.
Measurement of activities in passenger terminals is generally straightforward. The most common indicator is the number of passengers handled, sometimes differentiated according to arrivals and departures (see Figure 5.1). Transfer passengers are counted twice (once on arrival, once on departure), and so airports that serve as major transfer facilities inevitably record high passenger totals. This is evident in Figure 5.1 where in-transit passengers at the two leading airports, ATL and ORD, account for over 50 percent of the total passenger movements. A further measure of airport activity is number of aircraft movements, a fi gure that must be used with some caution because it pays no regard to the capacity of planes. High numbers of aircraft movements may not be correlated with passenger traffi c totals.
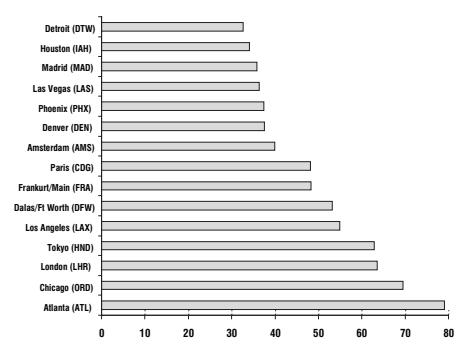
Figure 5.1 World's largest passenger airports, 2003 (in millions) (Source: Airports Council International. http://www.airports.org/)
Freight terminals
Freight handling requires specifi c loading and unloading equipment. In addition to the facilities required to accommodate ships, trucks and trains (berths, loading bays and freight yards respectively), a very wide range of handling gear is required that is determined by the kinds of cargoes handled. The result is that terminals are differentiated functionally both by the mode involved and the commodities transferred. A basic distinction is that between bulk and general cargo:
- Bulk refers to goods that are handled in large quantities that are unpackaged and are available in uniform dimensions. Liquid bulk goods include crude oil and refi ned products that can be handled using pumps to move the product along hoses and pipes. Relatively limited handling equipment is needed, but signifi cant storage facilities may be required. Dry bulk includes a wide range of products, such as ores, coal and cereals. More equipment for dry bulk handling is required, because the material may have to utilize specialized grabs and cranes and conveyer-belt systems.
- General cargo refers to goods that are of many shapes, dimensions and weights, such as machinery and parts. Because the goods are so uneven and irregular, handling is diffi cult to mechanize. General cargo handling usually requires a lot of labor.
A feature of most freight activity is the need for storage. Assembling the individual bundles of goods may be time-consuming and thus some storage may be required. This produces the need for terminals to be equipped with specialized infrastructures such as grain silos, storage tanks, and refrigerated warehouses, or simply space to stockpile.
Measurement of freight traffi c through terminals is more complicated than for passengers. Because freight is so diverse, standard measures of weight and value are diffi cult to compare and combine. Because bulk cargoes are inevitably weighty, terminals specialized in such cargoes will inevitably record higher throughputs measured in tons than others more specialized in general cargoes. This is evident from Figure 5.2, where the traffi c of the two leading ports, Singapore and Rotterdam, is dominated by petroleum . The reverse may be true if the value of commodities handled is the measure employed. The problem of measurement involving weight or volume becomes very diffi cult when many types of freight are handled, because one is adding together goods
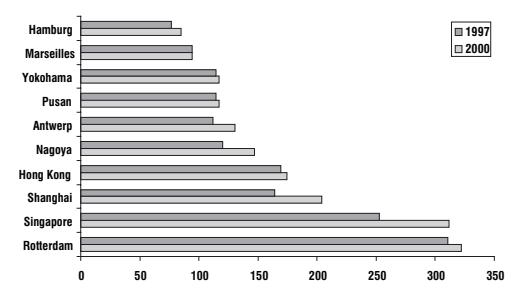
Figure 5.2 Throughput of the world's major ports, 1997–2000 (in millions of metric tons)
that are inherently unequal. Care must be taken in interpreting the signifi cance of freight traffi c totals, therefore.
The diffi culty of comparing traffi c totals of different commodities has led to attempts to "weight" cargoes based upon some indication of the value added they contribute to the terminal. The most famous is the so-called "Bremen" rule. This was developed in 1982 by the portof Bremen and was based on a survey of the labor cost incurred in the handling of one ton of different cargoes. The results found that handling one ton of general cargo equals three tons of dry bulk and 12 tons of liquid bulk. Although this is the most widely used method, other "rules" have been developed by individual ports, such as Rotterdam, and more recently by the port of Antwerp. The "Antwerp rule" indicates that the highest value added is the handling of fruit. Using this as a benchmark, forest products handling requires 3.0 tons to provide the same value added as fruit, cars 1.5 tons, containers 7 tons, cereals 12 tons, and crude oil 47 tons (Haezendonck, 2001).
Terminal costs
Because they jointly perform transfer and consolidation functions, terminals are important economically because of the costs incurred in carrying out these activities. The traffi c they handle is a source of employment and benefi ts regional economic activities, notably by providing accessibility to suppliers and customers. Terminal costs represent an important component of total transport costs. They are fi xed costs that are incurred regardless of the length of the eventual trip, and vary signifi cantly between the modes. They can be considered as:
- Infrastructure costs. Include construction and maintenance costs of facilities such as piers, runways, cranes and structures (warehouses, offi ces, etc.).
- Transshipment costs. The costs of loading and unloading passengers or freight.
- Administration costs. Many terminal facilities are managed by institutions such as port or airport authorities or by private companies. In both cases administration costs are incurred.
Because ships have the largest carrying capacities, they incur the largest terminal costs, since it may take many days to load or unload a vessel. Conversely, a truck or a passenger bus can be loaded much more quickly, and hence the terminal costs for road transport are the lowest. Terminal costs play an important role in determining the competitive position between the modes. Because of their high freight terminal costs, ships and rail are unsuitable for short-haul trips.
Figure 5.3 represents a simplifi ed assumption concerning transport costs for three modes. It should be noticed that the cost curves all begin at some point up the cost axis. This represents terminal costs, and as can be seen, shipping (T3) and rail (T2) start with a signifi cant disadvantage compared with road (T1).
Competition between the modes is frequently measured by cost comparisons. Efforts to reduce transport costs can be achieved by using more fuel-effi cient vehicles, increasing the size of ships, and reducing the labor employed on trains. However, unless terminal costs are reduced as well, the benefi ts would not be realized. For example, in water transportation, potential economies of scale realized by ever larger and more fuel-effi cient vessels would be negated if it took longer to load and off-load the jumbo ships.
Over the last forty years, very signifi cant steps to reduce terminal costs have been made. These have included introducing information management systems such as EDI
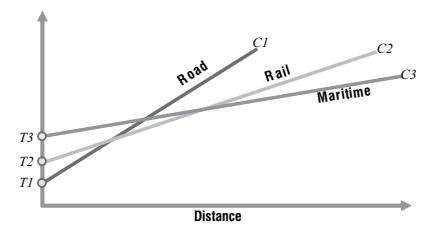
Figure 5.3 Terminal costs
(electronic data interchange) that have greatly speeded up the processing of information, removing delays typical of paper transactions. The most signifi cant development has been the mechanization of loading and unloading activities. Mechanization has been facilitated by the use of units of standard dimensions such as the pallet and most importantly, the container . The container, in particular, has revolutionized terminal operations (see Chapter 4). For the mode most affected by high terminal costs, ocean transport, ships used to spend as much as three weeks in a port undergoing loading and loading. The much larger ships of today spend less than a couple of days in port. A modern container ship requires approximately 750 man-hours to be loaded and unloaded. Prior to containerization it would have required 24,000 man-hours to handle the same volume of cargo. The rail industry too has benefi ted from the container, which permits trains to be assembled in freight yards in a matter of hours instead of days.
Reduced terminal costs have had a major impact on transportation and international trade . Not only have they reduced over-all freight rates, thereby reshaping competition between the modes, but they have also had a profound effect on transport systems. Ships spend far less time in port , enabling ships to make many more revenue-generating trips per year. Effi ciency in the airports, rail facilities and ports greatly improves the effectiveness of transportation as a whole.
Activities in transport terminals represent not just exchanges of goods and people, but constitute an important economic activity. Employment of people in various terminal operations represents an advantage to the local economy. Dockers, baggage handlers, crane operators, and air traffi c controllers are example of jobs generated directly by terminals. In addition there are a wide range of activities that are linked to transportation activity at the terminals. These include the actual carriers (airlines, shippinglines, etc.) and intermediate agents (customs brokers, forwarders) required to carry out the transfers. It is no accident that centers that perform major airport , port and rail functions are also important economic locales.
Terminals favor the agglomeration of related activities in their proximity and often adjacent to them (see Figure 5.4). This terminal–client link mainly involves warehousing and distribution (A). The contribution of transport terminals to regional economic growth can often be substantial. As the regional demand grows, so does the traffi c handled by the related terminal. This in turn can spur further investments to expand the capabilities of the terminal and the creation of a new terminal altogether (B).
Economists have identifi ed clusters as a critical element in shaping competition between countries, regions and industries (Porter, 1990). Clusters are defi ned as a population of interdependent organizations that operate in the same value chain and are geographically concentrated. This concept has been recently applied to seaports (de
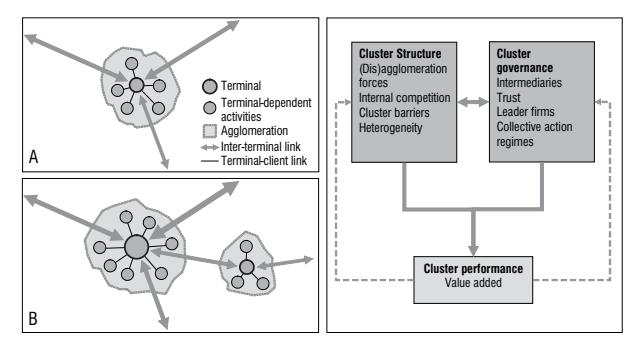
Figure 5.4 Terminals as clusters and growth poles
Langen, 2004). The seaport cluster is made up of fi rms engaged in the transfer of goods in the port and their onward distribution. It also includes logistics activities as well as processing fi rms and administrative bodies. The performance of the seaport cluster is defi ned as the value added generated by the cluster, and is shaped by the interrelationships between the structure of the cluster and its governance. Cluster structure refers to the agglomeration effects and the degree of internal cohesion and competition. Cluster governance relates to the mix of, and relations between, organizations and institutions that foster coordination and pursue projects that improve the cluster as a whole. When applied to the port of Rotterdam, it was suggested that a key role was played by the intermediary fi rms, those that operated services and activities for core transport fi rms. High levels of trust between fi rms led to lower transaction costs, and leader fi rms were very signifi cant because they helped strengthen the agglomeration.
Presented as a new approach, cluster theory is extending what others, including geographers, have recognized for some time, that portactivity, historically at least, generates strong agglomeration economies that produce strong spatially distinct port communities (Slack, 1989). Despite similarities in results from economic impact studies, airports and rail terminals have not yet received the attention of cluster theorists.
Concept 2 – Terminals and location
Location and spatial relations play a signifi cant role in the performance and development of transport terminals. As in all locational phenomena there are two dimensions involved. First is the issue of site, or absolute location. Terminals occupy very specifi c sites, usually with stringent requirements. Their site determinants may play an important role in shaping performance. The second component is relative location, or location relative to other terminals in the network. The spatial relations of terminals are an extremely important factor in shaping competition. Together, absolute and relative locations provide justifi cation for the fundamental signifi cance of geography in understanding transport terminals.
The nature of the function of the terminal is critical to understand its site features. Locations are determined according to the mode and the types of activities carried on.
As will be explained below, the period of time when site development took place is also a factor in site selection and elaboration.
Port sites
Ports are bound by the need to serve ships, and so access to navigable water has been historically the most important site consideration. Before the industrial revolution , ships were the most effi cient means of transporting goods, and thus portsites were frequently chosen at the head of water navigation, the most upstream site (Bird, 1963). Many major cities owed their early pre-eminence to this fact: London on the Thames and Montreal on the St. Lawrence River. Sites on tidal waterways created a particular problem for shipping because of the twice-daily rise and fall of water levels at the berths, and there developed by the eighteenth century the technology of enclosed docks, with lock gates. Because ship transfers were slow, and vessels typically spent weeks in port, a large number of berths were required. This frequently gave rise to the construction of piers and jetties to increase the number of berths per given length of shoreline.
Over time, changes in ships and handling gave rise to new site requirements. By the post-World War II period a growing specialization of vessels emerged, especially the development of bulk carriers. These ships were the fi rst to achieve signifi cant economies of scale, and their size grew very quickly. For example the world's largest oil tanker in 1947 was only 27,000 dwt, by the mid-1970s it was in excess of 500,000 dwt. There was thus a growing vessel specialization and increase in size which resulted in new site requirements, especially the need for dock space and greater depths of water. These site changes and developments in portinfrastructure were captured in the Anyport model of port evolution developed by Bird. Based on evidence of the evolution of British ports, Bird (1963) originally proposed a fi ve-stage model to demonstrate how facilities in a typical port develop. Starting from the initial port site with small lateral quays adjacent to the town center, the elaboration of wharfs is the product of evolving maritime technologies and improvements in cargo handling.
Figure 5.5 summarizes the stages in three phases:
• Setting. The initial setting of a port is strongly dependent on geographical considerations. On the example in Figure 5.5, the setting is related to the furthest point of inland navigation by sailing ships. The port evolves from the original site close to the city center, and is characterized by several simple quays (1). For many centuries until the industrial revolution, ports remained rather rudimentary in terms of their
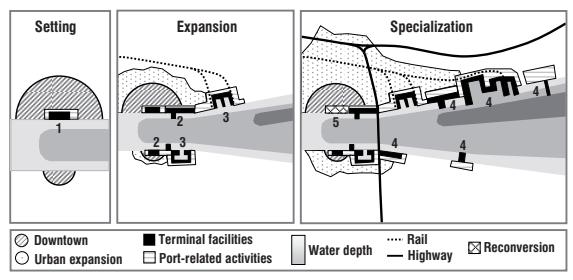
Figure 5.5 The evolution of a port (based on the Anyport model)
terminal facilities. Port-related activities were mainly focused on warehousing and wholesaling, located on sites directly adjacent to the port.
- Expansion. The industrial revolution triggered several changes that impacted on port activities. Quays were expanded, and jetties were constructed to handle the growing amounts of freight and passengers as well as larger ships (2). As the size of ships expanded, shipbuilding became an activity that required the construction of docks (3). Further, the integration of raillines with port terminals enabled access to vast hinterlands with a proportional growth in maritime traffi c. Port-related activities also expanded to include industrial activities. This expansion mainly occurred downstream.
- Specialization. The next phase involved the construction of specialized piers to handle freight such as containers, ores, grain, petroleumand coal (4), which expanded warehousing needs signifi cantly. Larger high-capacity ships often required dredging or the construction of long jetties, granting access to greater depths. This evolution implied for several ports a migration of their activities away from their original setting and an increase of their handling capacities. In turn, original port sites, commonly located adjacent to downtown areas, became obsolete and were abandoned. Numerous reconversion opportunities of port facilities to other uses (waterfront parks, housing and commercial developments) were created (5).
Bird suggested that Anyportwas intended not to display a pattern into which all ports must be forced, but to provide a base with which to compare the development of actual ports. The model has been tested in a variety of different conditions. While local conditions do produce differences in detail, there are suffi cient similarities to make the Anyport concept a useful description of portmorphological development. The emergence of new containerterminals continues the trend towards specialization and the search for sites adjacent to deeper water. A number of authors have amended the original Anyport model to include more recent developments (Charlier, 1992; McCalla, 2004).
One of the features that Anyport brings out is the changing relation between ports and their host cities. The model describes the growing repulsion by the rest of the urban milieu. This aspect has been worked upon over the last two decades by a number of geographers investigating the redevelopment of harbor land. Hoyle (1988) proposed an Anyport-type model, which instead of stressing the port infrastructure development, emphasizes the changing linkages between the port and the city. One of these urban linkages is the redevelopment of old port sites for other urban uses, such as Docklands in London and Harborfront in Baltimore.
Airport sites
Airports require very large sites. They need space for runways, terminal buildings, maintenance hangars and parking. While there are considerable variations in the scale of different airports, minimum sizes in excess of 500 hectares represent enormous commitments of urban land. Thus, airports are sited at the periphery of urban areas, because it is only there that suffi cient quantities of land are available. Many airports built in the 1940s and 1950s on the periphery now fi nd themselves surrounded by subsequent metropolitan development. Pearson Airport (Toronto) and O'Hare Airport (Chicago) are examples. These airports have served as growth poles, drawing commercial, industrial as well as residential developments to those sectors of the city (McCalla et al., 2001).
New site development today, in North America and Europe at least, is becoming very diffi cult because available sites are frequently so far from the urban core that even if
planning permission could be obtained, it would lead to very signifi cant diseconomies because of the distance from business and demographic cores. It is signifi cant that there have been few new large-scale airport developments in North America over the last 30 years, and the examples of Denver and Montreal illustrate how diffi cult and contentious development has been (Goetz and Szyliowicz, 1997). The result has been that most airports have to adjust to their existing sites, by reconfi guring runways and renovating existing terminal facilities, as for example Chicago and Toronto.
Rail terminal sites
Rail terminals, because they are not as space-extensive as airports and ports, suffer somewhat less from site constraints. Many railterminals were established in the nineteenth century during the heyday of rail development, and while the sites may have been on the edge of urban areas at the time, they now fi nd themselves surrounded by urban development. Individually, rail terminals may not be as extensive as airports or ports, but cumulatively the area of all the rail sites in a city may exceed those of the other modes. For example, in Chicago the combined area of rail freight yards exceeds that of the airports.
Passenger rail terminals are typically in the heart of downtown cores. At one time their sites may have been on the edge of the pre-industrial city, as is the case for London and Paris but today they are very much part of the CBD. The stations are typically imposing buildings refl ecting the power and importance represented by the railway in the nineteenth and early twentieth centuries. Grand Central Station in New York or St. Pancras station in London are impressive architectural achievements unmatched in any other type of transportation terminal. As rail passenger traffi c has declined, the need for many of these stations has diminished, and a rationalization has resulted in the conversion of many stations to other uses, sometimes with striking effects, such as the Musée d'Orsay in Paris and Windsor Station in Montreal.
Rail freight yards did not have to be quite so centrally located, and because they required a great deal of space for multiple tracks for marshalling they were more likely located on entirely greenfi eld sites than the passenger terminals. However, rail yards tended to attract manufacturing activities, and thus became important industrial zones.
By the end of the twentieth century many of the industries around rail freight yards had relocated or disappeared, and in many cities these former industrial parks have been targets of urban revitalization. This has been accompanied by closure of some of the rail yards, either because they were too small for contemporary operating activities, or because of shrinkage of traffi c base. However, in North America many older rail freight yards have been converted into intermodal facilities because of the burgeoning traffi c involving containers and road trailers. The ideal confi guration for these terminals, however, is different from the typical general freight facility with their need for multiple spurs to permit the assembling of wagons to form train blocks. Intermodal trains tend to serve a more limited number of cities and are more likely to be dedicated to one destination. The need here is for long but fewer rail spurs. The confi guration typically requires a site over three kilometers in length and over 100 hectares in area. In addition, good access to the highway system is a requisite as well as a degree of automation to handle the transshipment demands of modern intermodal rail operations.
In some cases, the existing stock of terminals has been found to be wanting in terms of confi guration or location with regards to expressways. Thus, new rail yards have been built on the fringe of metropolitan areas, such as Canadian Pacifi c's Vaughan terminal or Canadian National's Brampton facilities in Toronto.
Relative location
Geographers have long recognized situation, or relative location, as an important component of location. It refers to the position of places with regard to other places. Accessibility is relative, because the situation of places changes over time. For example, ports in the Mediterranean were in the heart of the western world during the Greek and Roman eras, and Genoa and Venice prospered during the Middle Ages. The exploitation of the Americas changed the location of these places, since the Mediterranean now became a backwater. The opening of the Suez Canal in the nineteenth century refocused the relative location of the Mediterranean again.
Spatial relationships between terminals are a vital element in competition, particularly for ports and rail terminals, and geographers have developed a number of concepts to explore these locational features (Fleming and Hayuth, 1994).
- Centrality. One of the most enduring concepts in urban geography is central place theory, with its emphasis on centrality as a feature of the urban hierarchy. Cities more centrally located to markets are larger with a wider range of functions. Transport accessibility is equated with size, and thus many large terminals arise out of centrality. Examples include Heathrow Airport, London, whose traffi c pre-eminence is related to the city's location in the heart of the most developed part of Britain, as well as Britain's functional centrality to its former empire. The port of New York owes its pre-eminence in part to the fact that it is at the heart of the largest market area in the USA.
- Intermediacy. This term is applied to the frequent occurrence of places gaining advantage because they are between other places. The ability to exploit transshipment has been an important feature of many terminals. Anchorage, for example, was a convenient airport located on the great circle air routes between Asia, Europe and Continental USA. For many years passengers alighted here while the planes refueled. The growth of long-haul jets has made this activity diminish considerably, and Anchorage now joins the list of once important airports, such as Gander, Newfoundland, that have seen their relative locations change because of technological improvements. It should be noted, however, that Anchorage continues to fulfi ll its intermediacy role for air freight traffi c. Other examples include Chicago, the dominant US railhub, that is not only a major market area in its own right (centrality) but also lies at the junction of the major eastern and western railroad networks. Ports too can exploit advantages of intermediate locations. The largest containerportin the Mediterranean is Giaoa Tauro, located on the toe of Italy. A few years ago the port did not exist, but because of its location close to the main East–West shippinglanes through the Mediterranean it has been selected as a hub, where the large mother ships can transfer containers to smaller vessels for distribution to the established markets in the northern Mediterranean, a classic hub-and-spoke network.
Hinterland and foreland
One of the most enduring concepts in transport geography, especially applied to ports, is the hinterland. It refers to the market area of ports, the land areas from which the portdraws and distributes traffi c. Two types of hinterland are sometimes noted. The term natural or primary hinterland refers to the market area for which the port is the closest terminal. It is assumed that this zone's traffi c will normally pass through the port, because of proximity. The competitive hinterland is used to describe the market areas over which the port has to compete with other terminals for business (see Figure 5.6).
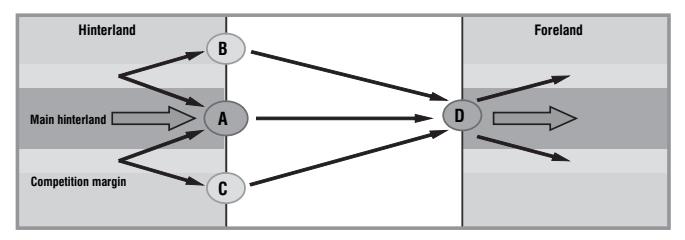
Figure 5.6 Port foreland and hinterland
The hinterland is a land space over which a transport terminal, such as a port, sells its services and interacts with its clients. It accounts for the regional market share that a terminal has relative to a set of other terminals servicing this region. It regroups all the customers directly bounded to the terminal. The terminal, depending on its nature, serves as a place of convergence for the traffi c coming by roads, railways or by sea/fl uvial feeders.
In recent years, the validity of the hinterland concept has been questioned, especially in the context of contemporary containerization (Slack, 1993). The mobility provided by the container has greatly facilitated market penetration, so that many ports compete over the same market areas for business. The notion of discrete hinterlands with well-defi ned boundaries is questionable therefore. Nevertheless, the concept is still widely employed, and portauthorities continue to emphasize their port's centrality to hinterland areas in their promotional literature.
The term foreland is the oceanward mirror of hinterland, referring to the ports and overseas markets linked by shipping services from the port. It is above all a maritime space with which a port performs commercial relationships. It includes overseas customers with which the port undertakes commercial exchanges. The provision of services to a wide range of markets around the world is considered to be an advantage.
In academic studies there have been far fewer assessments of foreland than hinterland, yet in port publicity documents the foreland is usually one of the elements stressed. Geographers have long criticized the distinction, arguing that foreland and hinterland should be seen as a continuum, rather than separate and distinct elements. This point has achieved greater weight recently, with the emergence of door-to-door services and networks, where the port is seen as one link in through transport chains (Notteboom and Winkelmans, 2001; Robinson, 2002).
Concept 3 – Terminals and security
A new context in transport security
As locations where passengers and freight are assembled and dispersed, terminals have always been a focus of concern about security and safety. Because railway stations and airports are some of the most densely populated sites anywhere, crowd control and safety have been issues that have preoccupied managers for a long time. Access is monitored and controlled, and movements are channeled along pathways that provide safe access to and from platforms and gates. In the freight industry, security concerns have been directed in two areas: worker safety and theft. Traditionally, freight terminals have been dangerous work places. With heavy goods being moved around yards and loaded onto vehicles using large mobile machines, accidents are systemic. Signifi cant improvements have been made over the years, through worker education and better organization of operations, but freight terminals are still comparatively hazardous. The issue of theft has been one of the most severe problems confronting all types of freight terminals, especially where high value goods are being handled. Docks, in particular, have been seen as places where organized crime has established control over local labor unions. Over the years access to freight terminals has been increasingly restricted, and the deployment of security personnel has helped control theft somewhat.
While issues of safety and security have concerned terminal planners and managers for many years, it is only recently that this has become an over-riding issue. Concerns were already being raised before the Millennium, but the tragic events of 9/11 thrust the issue of terminal security into the public domain as never before and set in motion responses that are reshaping transportation in unforeseen ways (Rodrigue and Slack, 2002).
Passengers
Airports have been the focus of security concerns for many decades. Hijacking aircraft came to the fore in the 1970s, when terrorist groups in the Middle East exploited the lack of security to commandeer planes for ransom and publicity. Refugees fl eeing dictatorships also found taking over aircraft a possible route to freedom. In response, the airline industry and the international regulatory body, ICAO, established screening procedures for passengers and bags. This process seems to have worked in the short run at least, with reductions in hijackings, although terrorists changed their tactics by placing bombs in unaccompanied luggage and packages, as for example in the Air India crash off Ireland in 1985 and the Lockerbie, Scotland, crash of Pan Am 103 in 1988.
The growth in passenger traffi c and the development of hub-and-spoke networks placed a great deal of strain on the security process. There were wide disparities in the effectiveness of passenger screening at different airports, and because passengers were being routed by hubs, the numbers of passengers in transit through the hub airports grew signifi cantly. Concerns were being raised by some security experts, but the costs of improving screening and the need to process ever larger numbers of passengers and maintain fl ight schedules caused most carriers to oppose tighter security measures.
The situation was changed irrevocably by the events of September 11, 2001. The US government created the Department of Homeland Security which in turn established a Transportation Security Authority to oversee the imposition of strict new security measures on the industry. Security involves many steps, from restricting access to airport facilities, fortifying cockpits, to the more extensive security screening of passengers. Screening now involves more rigorous inspections of passengers and their baggage at airports. For foreign nationals, inspection employs biometric identifi cation, which at present involves checking fi ngerprints, but in the future may include retinal scans and facial pattern recognition. A new system, the Computer Assisted Passenger Prescreening System (CAPPS II), is proposed that will require more personal information from travelers when they book their fl ights, which will lead to a risk assessment of each passenger. Passengers considered as high risk will be further screened.
The imposition of these measures has come at a considerable cost. In the USA alone, it is estimated that the expense of additional airport security is \$6 billion. A signifi cant factor has been the integration of screeners into the federal workforce, with important
increases in salaries and training costs. The purchase of improved screening machines, and the redesigning of airport security procedures have been important cost additions. These measures have also had a major infl uence on passenger throughputs. Clearing security has become the most important source of delays in the passenger boarding process. Passengers are now expected to arrive 2 hours before departure at the terminal in order to clear security.
The security issues have had a very negative effect on the air transport industry. As reviewed above, not only have costs increased, but also delays and inconveniences to passengers have produced a downturn in demand. Coming on top of a slowdown in the business cycle after the stock market downturns in the fi rst decade of the new century, most airlines have suffered considerable fi nancial reversals, with many of the largest seeking court protection from bankruptcy. Business travel, the most lucrative submarket for the airlines, has suffered a particularly sharp decline. Anecdotal evidence suggests that passengers are switching to other modes for shorter trips so as to avoid the time delays and aggravation caused by the security process.
Freight
Security in the freight industry has always been a major problem. Illegal immigrants, drug smuggling, piracy, and the deployment of sub-standard vessels have been some of the most important concerns. However, as in the air passenger business, the events of 9/11 highlighted a new set of security issues. The scale and scope of these problems in freight is of an even greater magnitude. The less regulated and greater international dimensions of the shipping industry, in particular, have made it a vulnerable target in an era of global terrorism. The number of ports, the vast fl eet of global shipping and the range of products carried in vessels, and the diffi culty of detection has made the issue of security in shipping an extremely diffi cult one to address. The container , which has greatly facilitated globalization , makes it extremely diffi cult to identify illicit and/or dangerous cargoes. In the absence of scanners that can X-ray the entire box, manual inspection becomes a time consuming and virtually impossible task. Hubbing compounds the problem, as large numbers of containers are required to be handled with minimum delays and inconvenience.
In the USA, the response was to enact the Maritime Transportation and Security Act in 2002. The basic elements of this legislation were adopted by the International Maritime Organization (IMO) in December 2002 as the International Ship and Port Security code (ISPS). There are three important features of these interventions. First, is the requirement of an automated identity system (AIS) for all vessels between 300 and 50,000 dwt. AIS requires vessels to have a permanently marked and visible identity number, and there must be a record maintained of its fl ag, port of registry and address of the registered owner. Second, each port must undertake a security assessment. This involves an assessment of its assets and facilities and of the effects of damage that might be caused. The port must then evaluate the risks, and identify weaknesses to its physical security, communication systems, utilities, etc. Third, is that all cargoes destined for the USA must receive customs clearance prior to the departure of the ship. In addition, it is proposed that biometric identifi cation for seafarers will be implemented and that national databases of sailors will be maintained.
The ISPS code is being implemented in ports around the world. Without certifi cation, a port would have diffi culty in trading with the USA. Security is thus becoming a factor in a port's competitiveness. The need to comply with ISPS has become an urgent issue in ports large and small around the world. The costs of securing sites, of undertaking risk assessments, and of monitoring ships all represent an additional cost of doing business, without any commercial return. US ports have been able to tap funding from the Department of Homeland Security, but foreign ports have to comply or risk the loss of business. Security has become an additional element in determining competitive advantage.
Method 1 – The Gini coeffi cient
Defi nition
The Gini coeffi cient was developed to measure the degree of concentration (inequality) of a variable in a distribution of its elements. It compares the Lorenz curve of a ranked empirical distribution with the line of perfect equality. This line assumes that each element has the same contribution to the total summation of the values of a variable. The Gini coeffi cient ranges between 0, where there is no concentration (perfect equality), and 1, where there is total concentration (perfect inequality).
Figure 5.7 is a graphical representation of the proportionality of a distribution (the cumulative percentage of the values). To build the Lorenz curve, all the elements of a distribution must be ordered, from the most important to the least important. Then, each element is plotted according to their cumulative percentage of X and Y, X being the cumulative percentage of elements. For instance, out of a distribution of 10 elements (N), the fi rst element would represent 10 percent of X and whatever percentage of Y it represents (this percentage must be the highest in the distribution). The second element would cumulatively represent 20 percent of X (its 10 percent plus the 10 percent of the fi rst element) and its percentage of Y plus the percentage of Y of the fi rst element.
The Lorenz curve is compared with the perfect equality line, which is a linear relationship that plots a distribution where each element has an equal value in its shares of X and Y. For instance, in a distribution of 10 elements, if there is perfect equality, the 5th element would have a cumulative percentage of 50 percent for X and Y. The perfect equality line forms an angle of 45 degrees with a slope of 100/N. The perfect inequality line represents a distribution where one element has the total cumulative percentage of Y while the others have none.
The Gini coeffi cient is defi ned graphically as a ratio of two surfaces involving the summation of all vertical deviations between the Lorenz curve and the perfect equality line (A) divided by the difference between the perfect equality and perfect inequality lines (A + B).
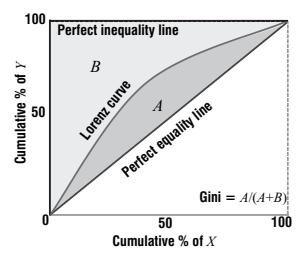
Figure 5.7 The Lorenz curve
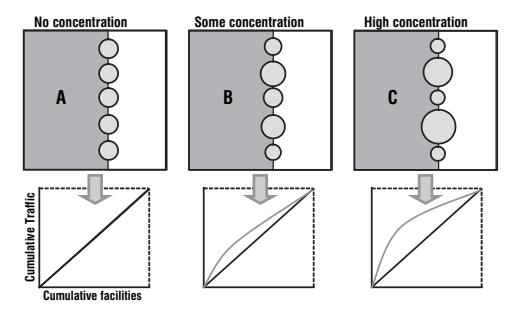
Figure 5.8 Traffi c concentration and Lorenz curves
Figure 5.8 shows a simple system of fi ve ports along a coast. In case A, the traffi c for each port is the same, so there is no concentration and thus no inequality. The Lorenz curve of this distribution is the same as the perfect equality line; they overlap. In case B, there is some concentration of the traffi c in two ports and this concentration is refl ected in the Lorenz curve. Case C represents a high level of concentration in two ports and the Lorenz curve is signifi cantly different to the perfect equality line.
Calculating the Gini coeffi cient (G)
The coeffi cient represents the area of concentration between the Lorenz curve and the line of perfect equality as it expresses a proportion of the area enclosed by the triangle defi ned by the line of perfect equality and the line of perfect inequality. The closer the coeffi cient is to 1, the more unequal the distribution.
$$G = 1 - \sum{i=0}^{N} (\sigma Y{i-1} + \sigma Yi) (\sigma X{i-1} - \sigma X_i)$$
Table 5.1 shows a hypothetical set of terminals with varying amounts of traffi c. X refers to the traffi c proportion if the traffi c was distributed evenly throughout all the terminals. Y refers to the actual proportion of traffi c at each terminal. σX and σY are cumulative percentages of *X*s and *Y*s (in fractions) and N is the number of elements (observations).
The Gini coeffi cient for this distribution is 0.427 (|1 – 1.427|).
Table 5.1 Calculating the Gini coeffi cient
| Terminal Traffi c | X | Y | σX | σY | σXi–1 – σXi (B) |
σYi–1 + σYi (A) |
A*B | |
|---|---|---|---|---|---|---|---|---|
| A | 25,000 | 0.2 | 0.438 | 0.2 | 0.438 | 0.2 | 0.438 | 0.088 |
| B | 18,000 | 0.2 | 0.316 | 0.4 | 0.754 | 0.2 | 1.192 | 0.238 |
| C | 9,000 | 0.2 | 0.158 | 0.6 | 0.912 | 0.2 | 1.666 | 0.333 |
| D | 3,000 | 0.2 | 0.053 | 0.8 | 0.965 | 0.2 | 1.877 | 0.375 |
| E | 2,000 | 0.2 | 0.035 | 1.0 | 1.000 | 0.2 | 1.965 | 0.393 |
| Total | 57,000 | 1.0 | 1.000 | 1.427 |
Geographers have used the Gini coeffi cient in numerous instances, such as assessing income distribution among a set of contiguous regions (or countries) or to measure other spatial phenomena such as racial segregation and industrial location. Its major purpose as a method in transport geography has been related to measuring the concentration of traffi c, mainly at terminals, such as assessing changes in port system concentration. Economies of scale in transportation favor the concentration of traffi c at transport hubs, so the Gini coeffi cient of maritime traffi c has tended to increase over recent decades, although perhaps not to the degree that has been expected (McCalla, 1999).
Method 2 – Delphi forecasting
Introduction
D elphi forecasting is a non-quantitative technique for forecasting. Unlike many other methods that use so-called objective predictions involving quantitative analysis, the Delphi method is based on expert opinions. It has been demonstrated that predictions obtained in this way can be at least as accurate as other procedures. The essence of the procedure is to use the assessment of opinions and predictions by a number of experts over a number of rounds in carefully managed sequences.
One of the most important factors in Delphi forecasting is the selection of experts. The persons invited to participate must be knowledgeable about the issue, and represent a variety of backgrounds. The number must not be too small to make the assessment too narrowly based, nor too large to be diffi cult to coordinate. It is widely considered that 10 to 15 experts can provide a good base for the forecast.
Procedure
The procedure begins with the planner/researcher preparing a questionnaire about the issue at hand, its character, causes and future shape. These are distributed to the respondents separately who are asked to rate and respond. The results are then tabulated and the issues raised are identifi ed.
The results are then returned to the experts in a second round. They are asked to rank or assess the factors, and justify why they made their choices. During a third or subsequent rounds their ratings along with the group averages, and lists of comments are provided, and the experts are asked to re-evaluate the factors. The rounds continue until an agreed level of consensus is reached. The literature suggests that by the third round a suffi cient consensus is usually obtained.
The procedure may take place in many ways. The fi rst step is usually undertaken by mail. After the initial results are obtained the subsequent round could be undertaken at a meeting of experts, assuming it would be possible to bring them together physically. Or, the subsequent rounds could be conducted again by mail. E-mail has greatly facilitated the procedure. The basic steps are as follows:
• Identifi cation of the problem. A researcher identifi es the problem for which some predictions are required, e.g. what is the traffi c of port X likely to be in 10 years time? The researcher prepares documentation regarding past and present traffi c activity. A questionnaire is formulated concerning future traffi c estimates and factors that might infl uence such developments. A level of agreement between the responses is selected, e.g. if 80 percent of the experts can agree on a particular traffi c prediction.
- Selection of experts. In the case of a port scenario this might include terminal managers, shipping line representatives, land transport company representatives, intermediaries such as freight forwarders, and academics. It is important to have a balance, so that no one group is overly represented.
- Administration of questionnaire. Experts are provided with background documentation and the questionnaire. Responses are submitted to the researcher within a narrow time frame.
- Researcher summarizes responses. Actual traffi c predictions are tabulated and means and standard deviations calculated for each category of cargo as in the case of a port traffi c prediction exercise. Key factors suggested by experts are compiled and listed.
- Feedback. The tabulations are returned to the experts, either by mail or in a meeting convened to discuss fi rst round results. The advantage of a meeting is that participants can confront each other to debate areas of disagreement over actual traffi c predictions or key factors identifi ed. The drawback is that a few individuals might exert personal infl uence over the discussion and thereby sway outcomes, a trend that the researcher must be alert to and seek to mitigate. Experts are invited to review their original estimates and choices of key factors in light of the results presented, and submit a new round of predictions.
- These new predictions are tabulated and returned to the experts either by mail or immediately to the meeting, if the level of agreement does not meet the pre-determined level of acceptance. The specifi c areas of disagreement are highlighted, and the experts are again requested to consider their predictions in light of the panel's overall views.
- The process is continued until the level of agreement has reached the predetermined value. If agreement is not possible after several rounds, the researcher must terminate the process and try to pinpoint where the disagreements occur, and utilize the results to indicate specifi c problems in the traffi c prediction process in this case.
This method could be applied in a classroom setting, with students serving as "experts" for a particular case study. The traffi c at the local airport or port might be an appropriate example. On the basis of careful examination of traffi c trends and factors infl uencing business activity, the class could be consulted to come up with predictions that could then be compared with those of some alternative method such as trend extrapolation.
References
Bird, J.H. (1963) The Major Seaports of the United Kingdom, London: Hutchinson.
Caves, R.E. and G.D. Gosling (1999) Strategic Airport Planning, Oxford: Pergamon.
Charlier, J. (1992) "The Regeneration of Old Port Areas for New Port Uses", in B.S. Hoyle and D. Hilling (eds) Seaport Systems and Spatial Change, Chichester: Wiley, pp. 137–54.
De Langen, P.W. (2004) "Analysing Seaport Cluster Performance", in D. Pinder and B. Slack (eds) Shipping and Ports in the Twenty-fi rst Century, London: Routledge, pp. 82–98.
Fleming, D.K. and Y. Hayuth (1994) "Spatial Characteristics of Transportation Hubs: Centrality and Intermediacy", Journal of Transport Geography, 2, 3–18.
Goetz, A.R and J.S. Szyliowicz (1997) "Revisiting Transport Planning and Decision Making: the Case of Denver International Airport", Transport Research, A 31, 263–80.
Haezendonck, E. (2001) Essays on Strategy Analysis for Seaports, Leuven: Garant.
Hoyle, B.S. (1988) "Development Dynamics at the Port–City Interface", in B.S. Hoyle, D.A. Pinder and M.S. Husain (eds) Revitalising the Waterfront, Chichester: Wiley.
- McCalla, R.J. (1999) "From St. John's to Miami: Containerisation at Eastern Seaboard Ports", GeoJournal, 48, 15–28.
- McCalla, R.J. (2004) "From 'Anyport' to 'Superterminal'", in D. Pinder and B. Slack (eds) Shipping and Ports in the Twenty-fi rst Century, London: Routledge, pp. 123–42.
- McCalla, R.J., B. Slack and C. Comtois (2001) "Intermodal Freight Terminals: Locality and Industrial Linkages", Canadian Geographer, 45, 404–13.
- Notteboom, T.E. and W. Winkelmans (2001) "Structural Changes in Logistics: How Will Port Authorities Face the Challenge?", Maritime Policy and Management, 28, 71–89.
- Porter, M.E. (1990) The Competitive Advantage of Nations, London: Macmillan.
- Robinson, R. (2002) "Ports as Elements in Value-driven Chain Systems: the New Paradigm", Maritime Policy and Management, 29, 241–55.
- Rodrigue, J.-P. and B. Slack (2002) "Logistics and National Security", in S.K. Majumdar et al. (eds) Science, Technology and National Security, Easton, PA: Pennsylvania Academy of Science, pp. 214– 25.
- Slack, B. (1989) "The Port Service Industry in an Environment of Change", Geoforum 20, 447–57.
- Slack, B. (1993) "Pawns in the game: ports in a global transportation system", Growth and Change, 24, 579–88.
International and regional transportation 6
International transportation is concerned with the highest scale in the mobility of freight and passengers with intercontinental and inter-regional movements. It is consequently subject to many geopolitical considerations such a control, competition and cooperation. Globalization processes have extended considerably the need for international transportation, notably because of economic integration, which grew on par with the fragmentation of production systems and the expansion of international trade . Both processes are interdependent and require an understanding of the transactional context in which multinational corporations are now evolving. There is thus a growing level of integration between production, distribution and consumption, whose effi ciency has been expanded by logistics .
Concept 1 – Transportation, globalization and international trade
Trade and the global economy
In a global economy , no nation is self-suffi cient. Each is involved at different levels in trade to sell what it produces, to acquire what it lacks and also to produce more effi ciently in some economic sectors than its trade partners. As supported by conventional economic theory, trade promotes economic effi ciency. The globalization of production is concomitant to the globalization of trade. Even though international trade took place centuries before the modern era, as ancient trade routes such as the Silk Road can testify, trade occurred at an ever increasing rate over the last 600 years to play an even more active part in the economic life of nations and regions. This process has been facilitated by signifi cant technical changes in the transport sector. The scale, volume and effi ciency of international trade have continued to increase over the last 30 years. As such, a point has been reached where a large amount of space can be traded for a decreased amount of time, and this at lower costs. It has become increasingly possible to trade between parts of the world that previously had limited access to international transportation systems. Further, the division and the fragmentation of production that went along with these processes also expanded trade. Trade thus contributes to lower manufacturing costs.
The economic benefi ts of international or inter-regional trade are numerous (Figure 6.1). Without trade, each unit must produce a set of basic goods to satisfy the requirements of the national economy. In the example in Figure 6.1, four countries are each producing four different goods. National markets tend to be small, impairing the potential economies of scale, which results in higher prices. Product diversity also tends to be limited because of the market size and standards (such as safety or component size) may even be different.
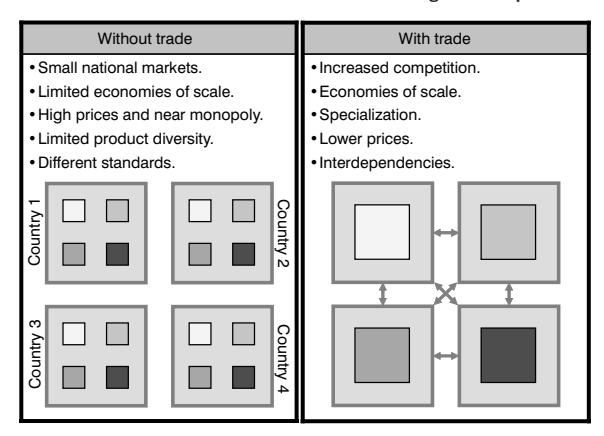
Figure 6.1 Economic rationale of trade
With trade, competition increases and a redistribution of production often takes place as comparative advantages are exploited. In the above example, the outcome of trade liberalization involves a specialization of production of one good in each country and the trade of other goods between them. Greater economies of scale that are achieved through specialization result in lower prices. A situation of interdependency is thus created.
Without international trade , few nations could maintain an adequate standard of living. With only domestic resources, each country could only produce a limited number of products and shortcomings would be prevalent. Global trade allows for an enormous variety of resources – from Persian Gulf oilto Chinese low-cost labor – to be made more widely accessible. It also facilitates the distribution of many different manufactured goods that are produced in different parts of the world. Wealth becomes increasingly derived through regional product specialization. In this way, production costs are lowered, productivity rises and surpluses are generated, which can be transferred or traded for commodities that would be too expensive to produce domestically. As a result, international trade decreases the overall costs of production worldwide. Consumers can buy more goods for the wages they earn, and standards of living should, in theory, increase. International trade consequently demonstrates the extent of globalization with increased spatial interdependencies between elements of the global economy and consequently their level of integration. Interdependencies imply numerous relationships where exchanges of capital, goods, raw materials and services are established between regions of the world. Trade has also been facilitated by growing levels of economic integration, the outcome of processes such as the European Union or the North American Free Trade Agreement.
Thus, the ability to compete in a global economyis dependent on the transport system as well as a vast array of supporting service activities. These activities include:
- Distribution-based. A multimodal and intermodal freight transport system composed of modes, infrastructures and terminals.
- Regulation-based. Customs procedures, tariffs, regulations and handling of documentation. •
- Transaction-based. Banking, fi nance and insurance activities where accounts can be settled.
The quality, cost, and effi ciency of these services infl uence the trading environment as well as the overall costs linked with the international trade of goods.
Global trade patterns
In the second half of the twentieth century, international tradeexperienced a notable growth, especially after the 1970s. The outcome has been a shift in global trade fl ows with many developing countries having a growing participation in international trade. This trend obviously refl ects the emergence of a more complex and interdependent global economy . The volume of exchanged goods and services between nations is playing a signifi cant part in the generation of wealth. By 2003, international trade was accounting for about 15 percent of the global GDP, a twofold increase since 1950. Three main factors can be linked to this process:
- Production systems are more fl exible and embedded, which encourages exchanges of commodities and services. Foreign direct investments are commonly linked with the globalization of production as corporations invest abroad in search of lower production costs and new markets. Chinais a leading example of such a process. There is a growing availability of goods and services that can be traded on the global market.
- Transport effi ciency has increased signifi cantly because of innovations and improvements in the modes and infrastructures. As a result, the transferability of commodities has improved.
- Integration processes, such as the emergence of economic blocs and the decrease of tariffs at a global scale, promoted trade. The higher the level of economic integration, the more likely the concerned elements are to trade. The transactional capacity is consequently facilitated with the development of transportation network s and the adjustment of trade fl ows that follows increased integration.
International trade, both in terms of value and tonnage, has been a growing trend in the global economy (Figure 6.2). While developed countries still accounted for 73 percent of the global trade in 2000, developing countries have seen their share climb to 27 percent, up from 23 percent in 1970. The dominant factor behind this growth has been an increasing share of manufacturing activities taking place in developing countries as manufacturers are seeking low-cost locations for many stages of the production chain. The evolution of international trade thus has a concordance with the evolution of production. There are however signifi cant fl uctuations in international trade that are linked with economic cycles of growth and recession, fl uctuations in the price of raw materials, as well as disruptive geopolitical events. The international division of production has been accompanied by growing fl ows of manufactured goods, which take a growing share of international trade (Figure 6.3).
Conventionally, international tradewas dominated by raw materials such as iron ore, oil and wheat. Over the last few decades, manufactured products have taken a growing
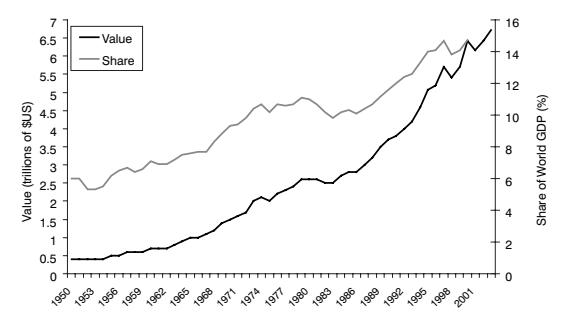
Figure 6.2 World exports of merchandises, 1950–2003 (Source: WTO)
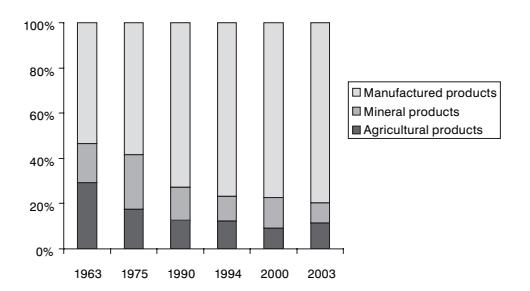
Figure 6.3 Global exports of merchandises, 1963–2003 (Source: WTO)
share of the value of international trade. While they accounted for 53.2 percent of all exports in 1963, this share climbed to 75.5 percent in 2003. Several factors can be associated to this change, such as technology and the globalization of the economy. Technological innovations in the transport sector, namely containerization, have enabled a fast and effi cient handling of manufactured goods. Also, the globalization of production is increasing trade of manufactured goods with a fragmentation of consumption and production functions. It is even possible that a part can be traded several times if it is used in the assembly of a more complex product.
The geography of international tradereveals a dominance of a small number of countries, mainly in North America and Western Europe. Alone, the United States , Germany and Japan account for about a third of all global trade. Further, G7 countries account for half the global trade. A growing share is being accounted for by the developing countries of Asia, with China accounting for the most signifi cant growth (both in absolute and relative terms). Those geographical and economic changes are also refl ected in trans-oceanic trade with trans-Pacifi c trade growing faster than trans-Atlantic trade.
Figure 6.4, depicting the value of exports and imports, underlines two geographical characteristics of international trade :
- Market size. Imports are a good indicator of the size of a national market as well as the fl ows of merchandises servicing the needs of an economy. The United States , Germany, China and Japan are the world's largest importers and consequently the world's largest economies. The integration of China to the global economyhas been accompanied by a growing level of participation in trade, both in absolute and relative terms, making China the seventh largest exporter in 2000 and the third largest in 2003.
- Trade imbalances. Some countries, notably the United States and the United Kingdom, have signifi cant trade defi cits which are refl ected in their balance of payments. This aspect is dominantly linked with service and technology-oriented economies that have experienced a relocation of labor-intensive production activities to lower cost locations. They are highly dependent on the effi cient distribution of goods and commodities. Conversely, countries with a positive trade balance tend to be export-oriented with a level of dependency on international markets. Germany, Japan, Canada and China are examples.
Regionalization has been one of the dominant features of global trade. The bulk of international trade has a regional connotation, promoted by proximity and the establishment of economic blocs such as NAFTA and the European Union. The growth of the amount of freight being traded, as well as a great variety of origins and destinations, promotes the importance of international transportation as a fundamental element supporting the global economy .
International transportation
With the growth of international trade and the globalization of production, international transportation systems have been under increasing pressure to support the growing demands of freight fl ows. This could not have occurred without considerable technical improvements permitting to transport larger quantities of freight and people, and this more quickly and more effi ciently. Since containers and intermodaltransportation
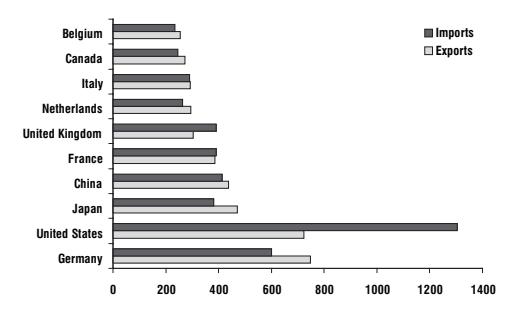
Figure 6.4 World's 10 largest exporters and importers, 2003 (Source: WTO)
improve the effi ciency of global distribution, a growing share of general cargo moving globally is containerized. Consequently, transportation is often referred as an enabling factor that is not necessarily the cause of international trade, but a means without which globalization could not have occurred. A common development problem is the inability of international transportation infrastructures to support fl ows, undermining access to the global market and the benefi ts that can be derived from international trade.
Because of the geographical scale, most international freight movements involve several modes, especially when origins and destinations are far apart. Transport chains must be established to service these fl ows, which reinforce the importance of international transportation modes and terminals at strategic locations. International trade requires distribution infrastructures that can support trade between several partners. Three components of international transportation facilitate trade:
- Transportation infrastructures. Concerns physical infrastructures such as terminals, vehicles and networks. Effi ciencies or defi ciencies in transport infrastructures will either promote or inhibit international trade .
- Transportation services. Concerns the complex set of services involved in the international circulation of goods and people. It includes activities such as warehousing, logistics, fi nance, insurance and marketing.
- Transactional environment. Concerns the complex legal, political and cultural setting in which international transport systems operate. It includes aspects such as regulations, quotas and tariffs, but also consumer preferences.
Figure 6.5 portrays a comparison between the notion of exchange brought by theories of international tradeand the transport chain which is derived from the realization of a transaction. International trade implies an exchange between an origin (A) and a destination (B) subject to a trade barrier. The major concerns of this perspective are related to the nature of merchandises being traded, the partners involved as well as the transactional environment in which trade takes place, namely tariff and non-tariff barriers.
The realization of international trade requires a transport chain that can provide a succession of modes and terminals, such as railway, maritime and road transportation systems. As discussed in the intermodaltransportation section, the fi rst stage in the transport chain is assembly where merchandises are assembled at the origin (A), often
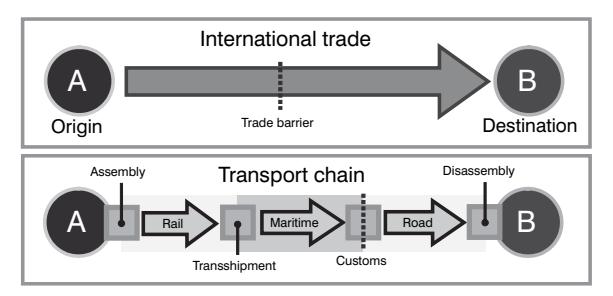
Figure 6.5 International trade and transportation chains
on pallets and/or containers. The cargo being traded then moves along the transport chain, transshipped at terminals from one mode to the other. Once it enters another country, the physical component and guarantor of a trade barrier, customs inspection, takes place. This activity is dominantly located at major terminals, or points of entry, namely ports and airports. The fi nal stage of the transport chain, disassembly, takes place at the destination (B).
Among the numerous transport modes, two are specifi cally concerned with international trade : maritime and air transportation . Indeed, the road and railway modes tend to occupy a marginal portion of international transportation since they are above all modes for national or regional transport services. However, a substantial share of the NAFTA trade between Canada , the United Statesand Mexico is supported by trucking, as well as a large share of Western European trade. In spite of these observations, these exchanges are a priori regional by defi nition, although intermodal transportation confers a more complex setting in the interpretation of these fl ows.
Economic development in Pacifi c Asia and in China in particular, has been the dominant factor behind the growth of international transportation in recent years. Since the trading distances involved are often considerable, this has resulted in increasing demands on the maritime shipping industry and on port activities. As its industrial and manufacturing activities develop, China is importing growing quantities of raw materials and energy and exporting growing quantities of manufactured goods. The outcome has been a surge in demand for international transportation. The ports in the Pearl River delta in Guangdong province now handle almost as many containers as all the ports in the United States combined.
Concept 2 – Commodity chains and freight transportation
Contemporary production systems
Production and consumption are the two core components of economic systems and are both interrelated through the conventional supply/demand relationship. Basic economic theory underlines that what is being consumed has to be produced and what is being produced has to be consumed. Any disequilibrium between the quantity being produced and the quantity being consumed can be considered as a market failure. On one side, insuffi cient production involves shortages and price increases, while on the other, overproduction involves waste, storage and price reduction. The realization of production and consumption cannot occur without fl ows of freight within a complex system of distribution.
Contemporary production systems are the outcome of signifi cant changes in production factors, distribution and industrial linkages:
• Production factors. In the past, the three dominant factors of production, land, labor and capital, could not be effectively used at the global level. For instance, a corporation located in one country had diffi culties taking advantage of cheaper labor and land in another country, notably because regulations would not permit full (and often dominant) ownership of a manufacturing facility by foreign interests. Facing integration processes and massive movements of capital coordinated by global fi nancial centers, factors of production have an extended mobility, which can be global in some instances. To reduce their production costs, especially labor costs, many fi rms have relocated segments (sometimes the entire process) of their industrial production systems to new locations. For instance, in 2003, American corporations were performing around 27 percent of their manufacturing activities abroad, while this fi gure was about 15 percent for their Japanese counterparts. This process has also been strengthened by economic integration and trade agreements. The European Union established a structure that facilitates the mobility of production factors, which in turn enabled better use of the comparative productivity of the European territory. Similar processes are occurring in North America (NAFTA), South America (Mercosur) and in Pacifi c-Asia (ASEAN), with varying degrees of success.
- Distribution. In the past, the diffi culties of overcoming distances were related to constraints in physical distribution as well as to telecommunications. Distribution systems had limited capabilities to ship merchandises between different parts of the world and it was diffi cult to manage fragmented production systems due to ineffi cient communication systems. In such a situation, freight alone could cross borders, while capital fl ows, especially investment capital, had more limited ranges. Trade could be international, but production systems were dominantly regionally focused. Production systems were thus mainly built through regional agglomeration economies with industrial complexes as an outcome. With improvements in transportation and logistics , the effi ciency of distribution has reached a point where it is possible to manage large-scale production and consumption.
- Industrial linkages. In the past, the majority of relationships between elements of the production system took place between autonomous entities, which tended to be small in size. As such, those linkages tended to be rather uncoordinated. The emergence of multinational corporations underlines a higher level of linkages within production systems, as many activities that previously took place over several entities are now occurring within the same corporate entity. About 30 percent of all global trade occurs within elements of the same corporation, with this share climbing to 50 percent for trade between developed countries.
The development of global telecommunication networks, ubiquitous information technologies, the liberalization of trade and multinational corporations are all factors that have substantially impacted production systems.
Commodity chains
The global economyand its production systems are highly integrated, interdependent and linked through commodity chain s.
Commodity chain. A functionally integrated network of production, trade and service activities that covers all the stages in a supply chain, from the transformation of raw materials, through intermediate manufacturing stages, to the delivery of a fi nished good to a market. The chain is conceptualized as a series of nodes, linked by various types of transactions, such as sales and intra-fi rm transfers. Each successive node within a commodity chaininvolves the acquisition or organization of inputs for the purpose of added value.
There are several stages through which a multinational corporation (or a group of corporations in partnership) can articulate its commodity chain . These stages are in large part conditioned by production costs and main markets. Commodity chains are also integrated by a transport chain routing goods, parts and raw materials from extraction and transformation sites to markets. Obviously, the nature of what is being produced and the markets where it is consumed will correspond to a unique geography of fl ows. Three major components can be considered within a commodity chain (Figure 6.6):
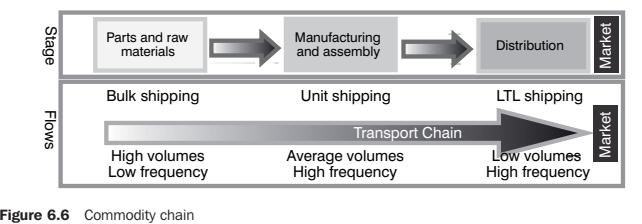
- Stage 1 (Parts and raw materials). The cost structure for parts and raw materials often imposes sourcing at the international level, a process which has accelerated in recent years. The fl ows occurring at this stage are mainly supported by international transportation systems in a wide variety of contexts, such as bulk cargo for raw materials and containers for parts. Distribution tends to involve high volumes and low frequency.
- Stage 2 (Manufacturing and assembly). Some capital intensive manufacturing and assembly activities will take place inside of the national economy while laborintensive activities will be out-sourced. Flows are either containerized or on pallets, with average volumes and a tendency to have rather high frequencies, notably for commodity chain s relying on timely deliveries.
- Stage 3 (Distribution). Distribution mainly takes place on the national market, although globally oriented distribution can take place, namely in the electronics sector. Depending on the scale of the distribution (international, national or regional), fl ows can be coordinated by distribution centers each having their own market areas. Flows are often low in volume (less than truckload; LTL), but high in frequency since they are related to retailing.
Commodity chains are thus a sequential process used by corporations within a production system to gather resources, transform them in parts and products and, fi nally, distribute manufactured goods to markets. Each sequence is unique and dependent on product types, the nature of production systems, market requirements as well as the current stage of the product life cycle. Commodity chains enable a sequencing of inputs and outputs between a range of suppliers and customers, mainly from a producer and buyer-driven standpoint. They also offer adaptability to changing conditions, namely an adjustment of production to adapt to changes in price and demand. The fl exibility of production and distribution is particularly important, with a reduction of production, transaction and distribution costs as the logical outcome. The major types of commodity chain s involve:
- Raw materials. The origin of these goods is linked with environmental (agricultural products) or geological (ores and fossil fuels) conditions. The fl ows of raw materials (particularly ores and crude oil) are dominated by a pattern where developing countries export towards developed countries. Transport terminals in developing countries are specialized in loading, while those of developed countries unload raw materials and often include transformation activities next to port sites.
- Semi-fi nished products. These goods have already had some transformation performed, conferring them an added value. They involve metals, textiles, construction materials and parts used to make other goods. The pattern of exchanges is varied
in this domain, but dominated by regional transport systems integrated to regional production systems.
• Manufactured goods. These include goods that are shipped towards large consumption markets and require a high level of organization of fl ows to fulfi ll the demand. The majority of these fl ows concerns developed countries, but a signifi cant share is related to developing countries, especially those specializing in export-based manufacturing. Containerization has been the dominant transport paradigm for manufactured goods, with production systems organized around terminals and their distribution centers.
Since interdependencies have replaced relative autonomy and self-suffi ciency as the foundation of the economic life of regions and fi rms, high levels of freight mobility have become a necessity. The presence of an effi cient distribution system supporting global commodity chain s (also known as global production networks) is sustained by:
- Functional integration. Its purpose is to link the elements of the supply chain in a cohesive system of suppliers and customers. A functional complementarity is then achieved through a set of supply/demand relationships, implying fl ows of freight, capital and information. Functional integration relies on distribution over vast territories where "just-in-time" and "door-to-door" strategies are relevant examples of interdependencies created by new freight management strategies. Intermodal activities tend to create heavily used transshipment points and corridors between them, where logistical management is more effi cient.
- Geographical integration. Large resource consumption by the global economy underlines a reliance on supply sources that are often distant, as for example crude oil and mineral products. The need to overcome space is fundamental to economic development and the development of modern transport systems has increased the level of integration of geographically separated regions. With improvements in transportation, geographical separation has become less relevant, as comparative advantages are exploited in terms of the distribution capacity of networks and production costs. Production and consumption can be more spatially separated without diminishing economies of scale, even if agglomeration economies are less evident.
Global production networks have various structures according to the nature of their production and the markets they service. Four major categories can be identifi ed (Figure 6.7):
- Centralized global production. The entire production occurs within only one nation (or region) and is exported thereafter on the global market. This is particularly the case for activities that are diffi cult to relocate, such as luxury goods, linked to the location of resources, or depending on massive economies of scale.
- Regional production. Takes place within each region that manufactures a good with the size of the production system related to the size of the regional market. This system depends more on regional accessibility than on economies of scale. It particularly applies to well-known manufacturing technologies and/or to products with high distribution costs (e.g. soft drinks).
- Regional specialization. This global production network involves a spatial division of the production based on the theory of comparative advantages. Each region specializes in the production of a specifi c good and imports from other regions what it requires.
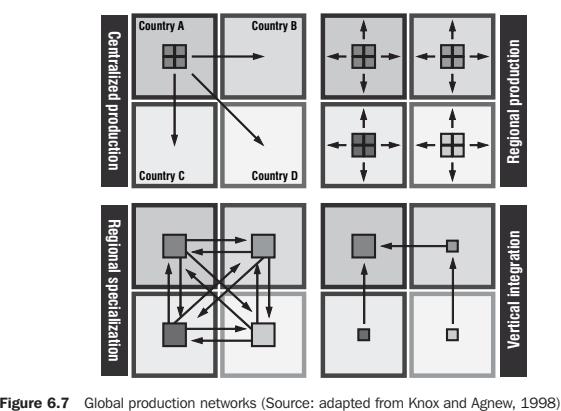
• Vertical transnational integration. This global production network is another variant of specialization. Different stages of the production occur at locations offering the best comparative advantages. Raw materials are extracted from locations where they are the most accessible, while assembly is performed in regions having low labor costs or high levels of expertise, depending on the type of product or the stage in its manufacturing.
Each production sector has a different production network. The automotive and electronics sectors are good examples of vertical integration. For instance, the manufacture of a television generally implies stages of research and development in the United Statesand Japan (as well as being important markets). Several nations, such as the UK, South Korea and Germany provide components. The assembly takes place in low-wage countries such as China , Mexico and Thailand. Labor costs are a key element of this system, as also is level of expertise.
Freight transport and commodity chains
As the range of production has expanded, transport systems have had to adapt to new realities in local, regional and international freight distribution. Freight transportation has consequently taken an increasingly important role in commodity chain s. Among the most important factors are:
- The improvement in transport effi ciency facilitated an expanded territorial range to commodity chain s.
- A reduction of telecommunication costs, enabling corporations to establish a better level of control over their commodity chain s.
- Technological improvements, notably for intermodal transportation, enabled an increased continuity between different transport modes (especially land/maritime) and thus within commodity chain s.
The results have been a decrease in the friction of distanceand a spatial segregation of production. This process is strongly imbedded with the capacity and effi ciency of international and regional transportation systems, especially maritime and land routes. It is becoming rare for all the production stages of a good to occur at the same location. Consequently, the geography of commodity chain s is integrated to the geography of transport systems. Among the main sectors of integration between transportation and commodity chains are:
- Agricultural commodity chain s. They include a sequence of fertilizers and equipment as inputs and cereal, vegetable and animal products as outputs. Several transportation modes are used for this production system, including railcars, trucks and grain ships. Since many food products are perishable, modes often have to be adapted to these specifi c constraints. Ports are playing an important role as points of warehousing and transshipment of agricultural commodities such as grain.
- Energy commodity chain s. Include the transport of fuels (oil , coal, natural gas, etc.) from where they are extracted to where they are transformed and fi nally consumed. They are linked to massive fl ows of bulk raw materials, notably by railway and maritime modes, but also by pipeline when possible.
- Metal commodity chain s. Similar to energycommodity chains, these systems include the transport of minerals from extraction sites, but also of metals towards the industrial sectors using them, such as shipbuilding, car making, construction materials, etc.
- Chemical commodity chain s. Include several branches such as petrochemicals and fertilizers. These commodity chains have linkages with the energy and agricultural sectors, since they are at the same time customers and suppliers.
- Wood and paper commodity chain s. Include collection over vast forest zones, such as Canada , Northern Europe, South America and Southeast Asia, towards production centers of pulp and paper and then to consumers.
- Construction industry. Implies movements of materials such as cement, sand, bricks and lumber, many of which are local in scale.
- Manufacturing industry. Involves a much diversifi ed set of movements of fi nished and semi-fi nished goods between several origins and destinations. Such fl ows are increasingly containerized.
Most commodity chain s are linked to regional transport systems, but with globalization , international transportation accounts for a growing share of fl ows within a commodity chain. The usage of resources, parts and semi-fi nished goods by commodity chains is an indication of the type of freight being transported. Consequently, transport systems must adapt to answer the needs of commodity chains. Within a commodity chain, freight transport services can be categorized by:
- Management of shipments. Refers to cargo transported by the owner, the manufacturer or a third party. The tendency has been for corporations to sub-contract their freight operations to specialized providers who provide more effi cient and costeffective services.
- Geographical coverage. Implies a wide variety of scales ranging from intercontinental, within economic blocs, national, regional or local. Each of these scales often involves specifi c modes of transport services and the use of specifi c terminals.
Time constraint. Freight services can have a time element ranging from express, where time is essential, to the lowest cost possible, where time is secondary.
Consignment size. Depending on the nature of production, consignments can be carried in full loads, partial loads (less than truck load: LTL), as general cargo, as container loads or as parcels.
Cargo type. Unitized cargo (containers, boxes or pallets) or bulk cargo requires dedicated vehicles, vessels and transshipment and storage infrastructures.
Mode. Cargo can be carried on a single mode (sea, rail, road or air) or in a combination of modes through intermodal transportation.
There is a direct relationship between the nature of production systems and the way freight transport ation systems are organized. Figure 6.8 provides hypothetical transport systems for the three stages of production.
- Raw materials. At this stage, most raw materials go through three major processes. The fi rst, extraction, is the process of gathering (harvesting, drilling, mining, cutting, depending on the nature of the material) raw materials. The second, transfer, is the process of collecting and storing large quantities of bulk freight, which mainly takes place at portand/or railterminals. The third, processing, is the transformation of raw materials to components that can be used for manufacturing. Processing activities tend to be closer to markets. For this stage, transportation modes and infrastructures tend to be specialized and of high capacity (tanker ships, pipelines, mineral or cereal bulk carriers, etc.) since economies of scale is a strong driving force at this stage. In this case, intra-industrial linkages are related to an enterprise seeking vertical integration. For instance, a steel mill (processing) could be involved in iron and coal mining, as well as owning transportation modes supporting its activities.
- Semi-fi nished products. This stage is strictly involved in the manufacturing and assembly of parts and products. Depending on the complexity of the product, an elaborate set of linkages and their associated fl ows takes place between several enterprises. Intra-industrial linkages tend to be horizontal as an enterprise seeks to control most of the stages in the manufacturing of a product or a group of products. The usage of transportation modes varies according to the products, ranging from air freight for high value goods to containerized or pallet traffi c for parts. Globalization has radically modifi ed this stage with the opportunity to use new manufacturing and assembly opportunities at low-cost locations.
- Manufactured goods. This stage is concerned with the distribution of fi nished products to consumption markets. The fi rst process, distribution, involves issues such as packaging, warehousing and transporting products to the market, which brings the second process, retailing. Retailing is commonly the fi nal stage of a production
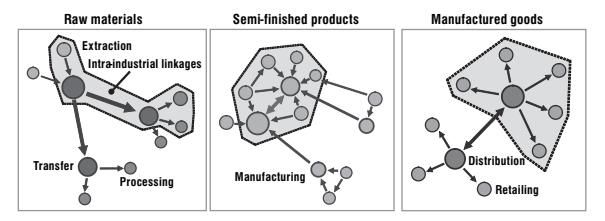
Figure 6.8 Production systems and types of transported freight
system where consumers (individuals and enterprises alike) have access to a product. For most retailing activities, the consumer is responsible to transport the product, once acquired, to its place of consumption but several retailers are also involved in deliveries. Most fl ows tend to be regional in scale, except for fl ows between distribution centers. Considering that a signifi cant share of the consumption takes place in urban areas, distribution and retailing fl ows tend to be increasingly an urban transportation problem. As such, trucking tends to be the dominant mode of the process of distribution. E-commerce has often helped the processes of distribution and retailing to merge in a single function.
The globalization of the production is also concomitant – a by-product – of a post-Fordist environment where just-in-time (JIT) and tense fl uxes are becoming the norm in production and distribution systems. International transportation is shifting to meet the increasing needs of organizing and managing its fl ows through logistics .
Concept 3 – Logistics1
The nature of logistics
The growing fl ows of freight have been a fundamental component of contemporary changes in economic systems at the global, regional and local scales. These changes are not merely quantitative (more freight), but structural and operational. Structural changes mainly involve manufacturing systems with their geography of production, while operational changes mainly concern freight transport ation with its geography of distribution. As such, the fundamental question does not necessarily reside in the nature, origins and destinations of freight movements, but how this freight is moving. New modes of production are concomitant with new modes of distribution, which brings forward the realm of logistics ; the science of physical distribution.
Logistics involves a wide set of activities dedicated to the transformation and distribution of goods, from raw material sourcing to fi nal market distribution as well as the related information fl ows. Derived from the Greek logistikos (to reason logically), the word is polysemic. In the nineteenth century the military referred to it as the art of combining all means of transport, revictualling and sheltering of troops. Today it refers to the set of operations required for goods to be made available on markets or to specifi c destinations.
Logistics is thus a multidimensional value-added activity, including (Figure 6.9):
- Production. Derived from the improved effi ciency of manufacturing with appropriate shipment size, packaging and limited inventory levels. Thus logistics contributes to the reduction of production costs.
- Location. Derived from taking better advantage of locations, implying expanded markets and lower distribution costs.
- Time. Derived from having goods and services available when required along the supply chain with better inventory and transportation management, and the strategic location of goods and services.
1 Dr. Markus Hesse (Free University of Berlin) is the coauthor of this section.
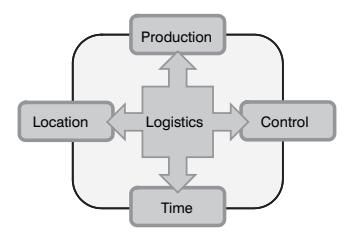
Figure 6.9 Value-added functions of logistics
• Control. Derived from controlling most, if not all, the stages along the supply chain. This enables better marketing and demand response, thus anticipating fl ows and allocating distribution resources accordingly.
Activities composing logistics are included into two major functions: physical distribution, the derived transport segment, and materials management, the induced transport segment.
- Physical distribution is the collective term for the range of activities involved in the movement of goods from points of production to fi nal points of sale and consumption. It must insure that the mobility requirements of supply chains are entirely met. Physical distribution includes all the functions of movement and handling of goods, particularly transportation services (trucking, freight rail, air freight, inland waterways, marine shipping, and pipelines), transshipment and warehousing services (e.g. consignment, storage, inventory management), trade, wholesale and, in principle, retail. Conventionally, all these activities are assumed to be derived from materials management demands.
- Materials management considers all the activities related to the manufacturing of commodities in all their stages of production along a supply chain. It includes production and marketing activities such as production planning, demand forecasting, purchasing and inventory management. Materials management must insure that the requirements of supply chains are met by dealing with a wide array of parts for assembly and raw materials, including packaging (for transport and retailing) and, ultimately, recycling discarded commodities. All these activities are assumed to induce physical distribution demands.
The close integration of physical distribution and materials management through logistics blurs the reciprocal relationship between the induced transport demand function of physical distribution and the derived demandfunction of materials management. This implies that distribution, as always, is derived from materials management activities (namely production), but also that these activities are coordinated within distribution capabilities. The functions of production, distribution and consumption are diffi cult to consider separately, thus recognizing the integrated transport demand role of logistics (Figure 6.10).
The more integrated a supply chain is, the harder it is to make a distinction between physical distribution and materials management, as distribution channels extend from
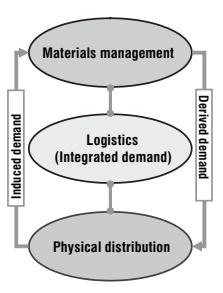
Figure 6.10 Logistics and integrated transport demand
suppliers to consumers and responsibility for transport and warehousing is shared between manufacturers, wholesalers and retailers. Logistics must be consistent with the products it supports as customers tend not to place any distinctions between a product and the distribution system that supplies it. Consequently, it is becoming increasingly diffi cult to consider transportation solely as a derived demand , or industrial production, manufacturing and consumption solely as factors inducing transport demand. It is thus argued that the classic transport geography concept of derived freight demand has been blurred by the diffusion and adaptation of logistics . Manufacturing and mobility requirements are both embedded as what is being produced has to be moved at a similar rate along the supply chain.
Distribution systems
The nature and effi ciency of distribution systems is strongly related to the nature of the economy in which they operate. In economies dependent on the extraction of raw materials, logistical costs are comparatively higher than for service economies since transport costs account for a larger share of the total added value of goods. Contemporary logistics was originally dedicated to the automation of production processes, in order to organize manufacturing as effi ciently as possible, with the least cost-intensive combination of production factors. A milestone that marked rapid changes in the entire distribution system was the invention of the concept of lean management, primarily in manufacturing. One of the main premises of lean management is eliminating inventories and organizing materials supply strictly on demand, replacing the former storage and stock keeping of inventory. The outcome is a specialization of production and a greater variety of products.
While cycle time requirements substantially decreased from the 1960s through the 1980s, this came at the expense of growing logistics costs, notably inventory (Figure 6.11). From that point on, the major achievements were related to productivity gains in distribution, accompanied by a reduction of cycle time requirements, but as importantly, of inventory costs. Another important requirement was containerization, which conferred substantial fl exibility to production systems in addition to the containerbeing its own storage unit. The expansion of classical infrastructure such as highways, terminals and airports was also essential for the development of modern logistics.
During the 1980s, the application of this "principle of fl ow" permitted to reduce inventories in time-sensitive manufacturing activities from several days' worth to
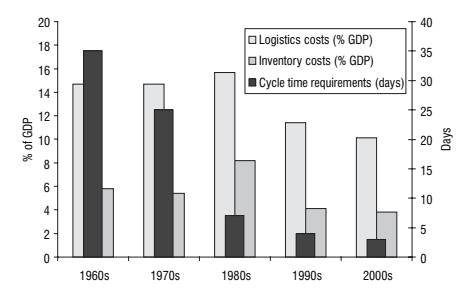
Figure 6.11 Logistical improvements, manufacturing sector, 1960–2000 (Source: Logistics Management & Distribution, 1999; T. Hsu, FedEx, 1998)
several hours. Much of these efforts initially took place within the factory, while supply and output fl owed as batches from suppliers and to distributors. In the 1990s, with the convergence of logisticsand information technologies, this principle was increasingly applied to the whole supply chain, particularly to the function of distribution. In some highly effi cient facilities, the warehousing function went down as far as 15 minutes' worth of parts in inventory. Service functions such as wholesale and retail are experiencing a diffusion of logistical management where inventory in stores are kept at a minimum and resupplied on a daily basis.
In a broader sense, distribution systems are embedded in a changing macro- and microeconomic framework, which can be roughly characterized by the terms of fl exibilization and globalization :
- Flexibilization implies a highly differentiated, strongly market- and customer-driven mode of creating added value. Contemporary production and distribution is no longer subject to single-fi rm activity, but increasingly practiced in networks of suppliers and subcontractors. The supply chain bundles together all this by information, communication, cooperation, and, last but not least, by physical distribution.
- Globalization means that the spatial frame for the entire economy has been expanded, implying the spatial expansion of the economy, more complex global economic integration, and an intricate network of global fl ows and hubs.
The fl ow-oriented mode affects almost every single activity within the entire process of value creation. The core component of materials management is the supply chain, the time- and space-related arrangement of the whole goods fl ow between supply, manufacturing, distribution and consumption. Its major parts are the supplier, the producer, the distributor (e.g. a wholesaler, a freight forwarder, a carrier), the retailer, the end consumer, all of whom represent particular interests. Compared with traditional freight transportsystems, the evolution of supply chain management and the emergence of the logistics industry are mainly characterized by four features:
• A fundamental restructuring of goods merchandising by establishing integrated supply chains with integrated freight transport demand.
- Whereas transport was traditionally regarded as a tool for overcoming space, logistics is critical in terms of time. This was achieved by shifts towards vertical integration, namely subcontracting and outsourcing, including the logistical function itself.
- According to macro-economic changes, demand-side oriented activities are becoming predominant. While traditional delivery was primarily managed by the supply side, current supply chains are increasingly managed by demand.
- The logistics services are becoming complex and time-sensitive to the point that many fi rms are now subcontracting parts of their supply chain management to thirdparty logistics providers. These providers benefi t from economies of scale and scope by offering integrated solutions to many freight distribution problems.
Distribution systems have become increasingly driven by demand instead of by supply (Figure 6.12):
- Supply driven. In a conventional situation, a supply driven distribution system is mainly based on the function of inventory. Production, often taking place in large batches, is simply "pushed" on the market with the hope that what is being produced will be consumed. Since elements of the supply chain are loosely integrated, parts and/or products must be stored to accommodate the chronology of the demand.
- Demand driven. Contemporary distribution systems show a remarkable change, as they are becoming increasingly demand driven. Under such circumstances, minimal inventories are maintained and most of it is circulating, thus the increasing importance of the transport component in distribution. The operational management of such a system relies heavily on information systems to insure that parts and/or products are delivered where and when they are required (on demand).
Geography of freight distribution
Logistics has a distinct geographical dimension, which is expressed in terms of fl ows, nodes and networks within the supply chain. Space/time convergence, a well-known concept in transport geography where time was simply considered as the amount of space that could be traded with a specifi c amount of time, including travel and transshipment,
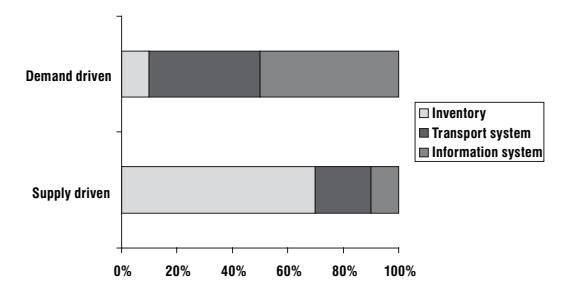
Figure 6.12 Changes in the relative importance of logistical functions in distribution systems (Source: Federal Highway Administration, Offi ce of Freight Management)
is being transformed by logistics . Activities that were not previously considered fully in space/time relationships, such as distribution, are being integrated. This implies an organization and synchronization of fl ows through nodes and network strategies:
- Flows. The traditional arrangement of goods fl ow included the processing of raw materials to manufacturers, with a storage function usually acting as a buffer. The fl ow continued via wholesaler and/or shipper to retailer, ending at the fi nal customer. Delays were very common on all segments of this chain and accumulated as inventories in warehouses. There was a limited fl ow of information from the consumer to the supply chain, implying the producers were not well informed (often involving a time lag) about the extent of consumption of their outputs. This procedure is now changing, mainly by eliminating one or more of the costly operations in the supply chain organization. Reverse fl ows are also part of the supply chain, namely for recycling and product returns. An important physical outcome of supply chain management is the concentration of storage or warehousing in one facility, instead of several. This facility is increasingly being designed as a fl ow- and throughput-oriented distribution center, instead of a warehouse holding cost-intensive large inventories. Recent freight fl ows tend to be of lower volumes, of higher frequency, often taking place over longer distances. These fl ows have been associated with modal adaptation, namely through containerization. The magnitude of these changes can be characterized by the growth of geographical areas of interaction, and by the temporal fl exibilization of freight fl ows, both resulting in a rising amount of freight transport . The distribution center thus becomes the core component of such a distribution system as it regulates the fl ows of a closer interaction between production and consumption (Figure 6.13).
- Nodes and locations. Due to new corporate strategies, a concentration of logistics functions in certain facilities at strategic locations is prevalent. Many improvements in freight fl ows are achieved at terminals. Facilities are much larger than before, the locations being characterized by a particular connection of regional and longdistance relations. Traditionally, freight distribution has been located at major places of production, for instance in the manufacturing belt on the North American east coast and in the Midwest, or in the old industrialized regions of England and continental
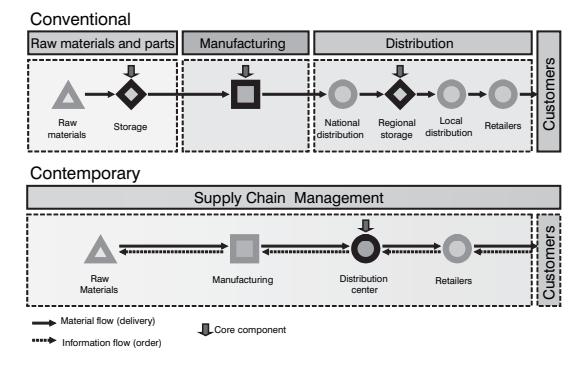
Figure 6.13 Conventional and contemporary arrangement of goods fl ow (Source: Hesse and Rodrigue, 2004)
Europe. Today, particularly the large-scale goods fl ows are directed through major gateways and hubs, mainly large ports and major airports, also highway intersections with access to a regional market. The changing geography of manufacturing and industrial production has been accompanied by a changing geography of freight distribution.
• Networks. The spatial structure of contemporary transportation network s is the expression of the spatial structure of distribution. The setting of networks leads to a shift towards larger distribution centers, often serving signifi cant trans-national catchments. However, this does not mean the demise of national or regional distribution centers, with some goods still requiring a three-tier distribution system, with regional, national and international distribution centers. The structure of networks has also adapted to fulfi ll the requirements of an integrated freight transport demand, which can take many forms and operate at different scales.
Figure 6.14 illustrates fi ve main network strategies:
- Point-to-point distribution is common when specialized and specifi c one-time orders have to be satisfi ed, which often creates less-than-full-load as well as empty return problems. The logistical requirements of such a structure are minimal, but at the expense of effi ciency.
- Corridor structures of distribution often link high density agglomerations with services such as the landbridgewhere container trains link seaboards. Traffi c along the corridor can be loaded or unloaded at local/regional distribution centers, acting as sub-hubs in this distribution system.
- Hub-and-spoke networks have mainly emerged with air freight distribution and with high throughput distribution centers favored by parcel services. Such a structure is made possible only if the hub has the capacity to handle large amounts of timesensitive consignments. The logistical requirements of a hub-and-spoke structure are consequently extensive as effi ciency is dominantly derived at the hub's terminal. Commonly, a major distribution center located at the hub will have privileged access to a terminal.
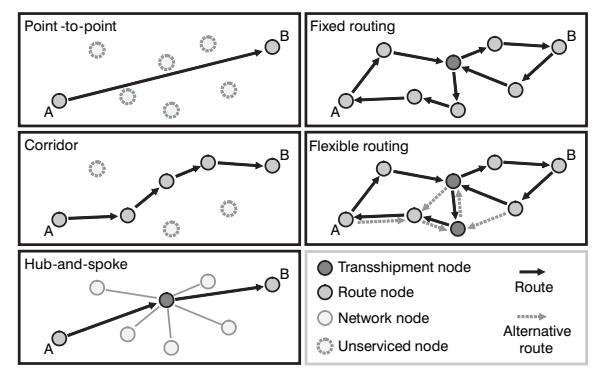
Figure 6.14 Freight distribution and network strategies (Source: adapted from Woxenius 2002)
• Routing networks tend to use circular confi gurations where freight can be transshipped from one route to the other at specifi c hubs. Pendulum networks characterizing many containershipping services are relevant examples of relatively fi xed routing distribution networks. Achieving fl exible routing is a complex network strategy requiring a high level of logistical integration as routes and hubs are shifting depending on anticipated variations of the integrated freight transport demand.
Method 1 – Spatial interactions
Overview
One methodology of particular importance to transport geography relates to how to estimate fl ows between locations, since these fl ows, known as spatial interaction s, enable to evaluate the demand (existing or potential) for transport services.
A spatial interaction is a realized movement of people, freight or information between an origin and a destination. It is a transport demand/supply relationship expressed over a geographical space. Spatial interactions cover a wide variety of movements such as journeys to work, migrations, tourism, the usage of public facilities, the transmission of information or capital, the market areas of retailing activities, international trade and freight distribution.
Economic activities are generating (supply) and attracting (demand) fl ows. The simple fact that a movement occurs between an origin and a destination underlines that the costs incurred by a spatial interactionare lower than the benefi ts derived from such an interaction. As such, a commuter is willing to drive one hour because this interaction is linked to an income, while international tradeconcepts, such as comparative advantages, underline the benefi ts of specialization and the ensuing generation of trade fl ows between distant locations. Figure 6.15 underlines three interdependent conditions necessary for a spatial interaction to occur:
• Complementarity. There must be a supply and a demand between the interacting locations. A residential zone is complementary to an industrial zone because the fi rst is supplying workers while the second is supplying jobs. The same can be said concerning the complementarity between a store and its customers and between an
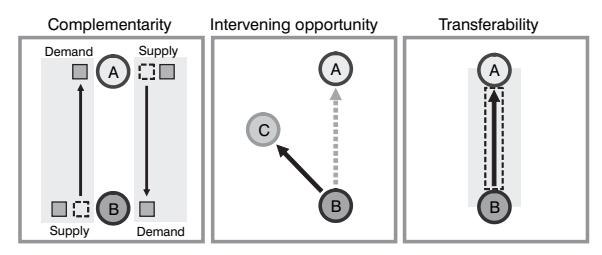
Figure 6.15 Conditions for the realization of a spatial interaction
industry and its suppliers (movements of freight). If location B produces/generates something that location A requires, then an interaction is possible because a supply/ demand relationship has been established between those two locations; they have become complementary to one another. The same applies in the other direction (A to B), which creates a situation of reciprocity common in commuting or international trade.
- Intervening opportunity. There must not be another location that may offer a better alternative as a point of origin or as a point of destination. For instance, in order to have an interaction of a customer to a store, there must not be a closer store that offers a similar array of goods. If location C offers the same characteristics (namely complementarity) as location A and is also closer to location B, an interaction between B and A will not occur and will be replaced by an interaction between B and C.
- Transferability. Freight, persons or information being transferred must be supported by transport infrastructures, implying that the origin and the destination must be linked. Costs to overcome distance must not be higher than the benefi ts of related interaction, even if there is complementarity and no alternative opportunity. Transport infrastructures (modes and terminals) must be present to support an interaction between B and A. Also, these infrastructures must have a capacity and availability which are compatible with the requirements of such an interaction.
The goal of spatial interaction s is to explain spatial fl ows. They provide ways to measure fl ows and predict the consequences of changes in the conditions generating them. When such attributes are known, it is possible to better allocate transport resources such as highways, buses, airplanes or ships.
Origin/destination matrices
Each spatial interaction , as an analogy for a set of movements, is composed of an origin/ destination pair. Each pair can itself be represented as a cell in a matrix where rows are related to the locations (centroids) of origin, while columns are related to locations (centroids) of destination. Such a matrix is commonly known as an origin/destination matrix, or a spatial interaction matrix.
Figure 6.16 represents movements (O/D pairs) between fi ve locations (A, B, C, D and E). From this graph, an O/D matrix can be built where each O/D pair becomes a cell. A value of 0 is assigned for each O/D pair that does not have an observed fl ow. In the O/D matrix the sum of a row (Ti ) represents the total outputs of a location (fl ows originating from), while the sum of a column (Tj ) represents the total inputs of a location (fl ows bound to). The summation of inputs is always equal to the summation of outputs. Otherwise, there are movements that are coming from or going to outside the considered system. The sum of inputs or outputs gives the total fl ows taking place within the system (T). It is also possible to have O/D matrices according to the age group, income, gender, etc. Under such circumstances they are labeled sub-matrices since they account for only a share of the total fl ows.
In many cases where spatial interaction s are relied on for planning and allocation purposes, origin/destination matrices are not available or are incomplete, requiring surveys. With economic development, the addition of new activities and transport infrastructures, spatial interactions have a tendency to change very rapidly as fl ows adapt to a new spatial structure. The problem is that an origin/destination survey is very expensive in terms of effort, time and cost. In a complex spatial system such as a region, O/D matrices tend to be quite large. For instance, the consideration of 100 origins and
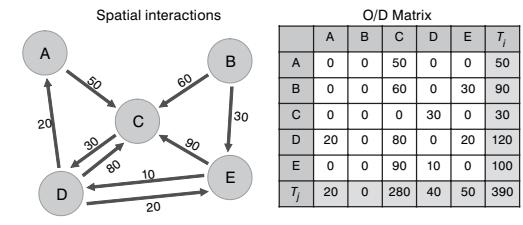
Figure 6.16 Constructing an O/D matrix
100 destinations would imply 10,000 separate O/D pairs. In addition, the data gathered by spatial interaction surveys are likely to become obsolete quickly as economic and spatial conditions change. It is therefore important to fi nd a way to estimate spatial interactions as precisely as possible, particularly when empirical data is lacking or is incomplete. A possible solution depends on the use of a spatial interaction model to complement and even supplant empirical observations.
The spatial interaction model
The basic assumption concerning many spatial interactionmodels is that fl ows are a function of the attributes of the locations of origin, the attributes of the locations of destination and the friction of distancebetween the concerned origins and destinations. The general formulation of the spatial interaction model is as follows (Figure 6.17):
$$Tij = f(Vi, Wj, Sij)$$
• Tij = interaction between location i (origin) and location j (destination). Its units of measurement are varied and can involve people, tons of freight, traffi c volume, etc. It also concerns a time period such as interactions by the hour, day, month, or year.
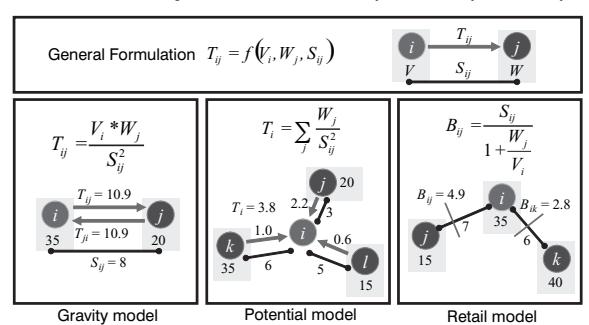
Figure 6.17 Three basic types of interaction models
- Vi = attributes of the location of origin i. Variables often used to express these attributes are socio-economic in nature, such as population, number of jobs available, industrial output or gross domestic product.
- Wj = attributes of the location of destination j. It uses similar socio-economic variables to the previous attribute.
- Sij = attributes of separation between the location of origin i and the location of destination j. Also known as transport friction. Variables often used to express these attributes are distance, transport costs, or travel time.
The attributes of V and W tend to be paired to express complementarity in the best possible way. For instance, measuring commuting fl ows (work-related movements) between different locations would likely consider a variable such as working age population as V and total employment as W. From this general formulation, three basic types of interaction models can be constructed:
- Gravity model. Measures interactions between all the possible location pairs. The level of interaction between two locations is measured by multiplying their attributes, which is then divided by their level of separation. Separation is often squared to refl ect the growing friction of distance. On Figure 6.17, two locations (i and j) have respective "weights" (importance) of 35 and 20 and are at a distance (degree of separation) of 8. The resulting interaction is 10.9, which is reciprocal.
- Potential model. Measures interactions between one location and every other location. The level of interaction between one location and all the others is measured by the summation of the attributes of each other location divided by their level of separation (again squared to refl ect the friction of distance) . On Figure 6.17, the potential interaction of location i (Ti) is measured by adding the ratio "weight" / squared distance for each other location (j, k and l). The potential interaction is 3.8, which is not reciprocal.
- Retail model. Measures the boundary of the market areas between two locations competing over the same market. This model deals with boundaries, instead of interactions (see Chapter 3, Market Area Analysis). It assumes that the market boundary between two locations is a function of their separation divided by the ratio of their respective weights. If two locations have the same importance, their market boundary would be halfway between. On Figure 6.17, the market boundary between locations i and j (Bij) is at a distance of 4.9 from i (and consequently at a distance of 2.1 from j).
Method 2 – The gravity model
Formulation
The gravity model is one of the most important spatial interaction methods. It is named as such because it uses a similar formulation to Newton's gravitation model. Accordingly, the attraction between two objects is proportional to their mass and inversely proportional to their respective distance. Consequently, the general formulation of spatial interactions can be adapted to refl ect this basic assumption to form the elementary formulation of the gravity model:
$$Tij = k \frac{Pi \ Pj}{dij}$$
- Pi and Pj = the importance of the location of origin i and the location of destination j.
- dij = the distance, or any measure related to the friction of space, between the location of origin and the location of destination.
- k = a proportionality constant related to the temporal rate of the event being measured. For instance, if the same system of spatial interactions is considered, the value of k will be higher if interactions are considered for a year instead of a week.
Thus, spatial interactions between locations i and j are proportional to their respective importance divided by their distance.
Extension
The gravity model c an be extended to include several parameters:
$$Tij = k \frac{P_i^{\lambda} Pj^{\alpha}}{d{ij}^{\beta}}$$
- P, d and k refer to the variables previously discussed.
- β (beta) = a parameter of transport friction related to the effi ciency of the transport system between two locations. This friction is rarely linear as the further the movement the greater the friction of distance. F or instance, a highway between two locations will have a weaker beta index than a road.
- λ (lambda) = potential to generate movements (emissiveness). For movements of people, lambda is often related to an overall level of welfare. For instance, it is logical to infer that for retailing fl ows, a location having higher income levels will generate more movements.
- α (alpha) = potential to attract movements (attractiveness). Related to the nature of economic activities at the destination. For instance, a center having important commercial activities will attract more movements.
Calibration
A signifi cant challenge related to the usage of spatial interaction mo dels, notably the gravity model, i s related to their calibration. Calibration consists in fi nding the value of each parameter of the model (constants and exponents) to insure that the estimated results are similar to the observed fl ows. If this is not the case, the model is almost useless as it predicts or explains little. It is impossible to know if the process of calibration is accurate without comparing estimated results with empirical evidence.
In the two formulations of the gravity model th at have been introduced, the simple formulation offers a good fl exibility for calibration since four parameters can be modifi ed. Altering the value of beta, alpha and lambda will infl uence the estimated spatial interactions. Furthermore, the value of the parameters can change in time due to factors such as technological innovations and economic development. For instance, improvements in transport effi ciency generally have the consequence of reducing the value of the beta exponent (friction of distance). Economic development is likely to infl uence the values of alpha and lambda, refl ecting a growth in the mobility.
Variations of the beta, alpha and lambda exponents have different impacts on the level of spatial interactions ( Figure 6.18). For instance, the relationship between distance and spatial interactions will change according to the beta exponent. If the value of beta
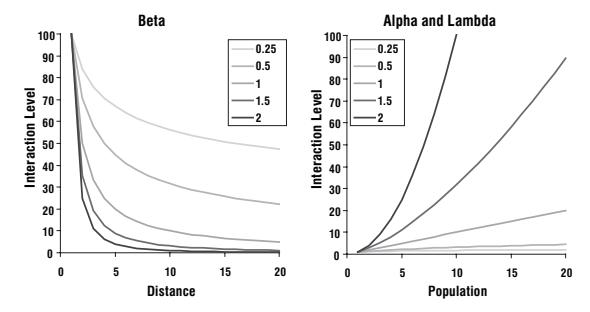
Figure 6.18 Effects of beta, alpha and lambda on spatial interactions
is high (higher than 0.5), the friction of distance wi ll be much more important (steep decline of spatial interactions) than with a low value of beta (e.g. 0.25). A beta of 0 means that distance has no effects and that interactions remain the same whatever the distance concerned. Alpha and lambda exponents have the same effect on the interaction level. For a value of 1, there is a linear relationship between population (or any attribute of weight) and the level of interactions. Any value higher than 1 implies an exponential growth of the interaction level as population grows.
Often, a value of 1 is given to the parameters, and then they are progressively altered until the estimated results are similar to observed results. Calibration can also be considered for different O/D matrices according to age, income, gender, type of merchandise and modal choice. A great part of the scientifi c research in transport and regional planning aims at fi nding accurate parameters for spatial interaction mo dels. This is generally a costly and time consuming process, but a very useful one. Once a spatial interaction model has been validated for a city or a region, it can then be used for simulation and prediction purposes, such as how many additional fl ows would be generated if the population increased or if better transport infrastructures (lower friction of distance) w ere provided.
Bibliography
Bowersox, D., E. Smykay and B. LaLonde (1968) Physical Distribution Management: Logistics Problems of the Firm, New York and London: Macmillan.
Bowersox, D., D. Closs and T. Stank (2000) "Ten Mega-Trends that will Revolutionize Supply Chain Logistics", Journal of Business Logistics, 21, 1–16.
Braudel, F. (1982) The Wheels of Commerce: Civilization and Capitalism 15th–18th Century, Vol. II. New York: Harper & Row.
Coyle, J.J., E.J. Bardi and R.A. Novack (1994) Transportation, 4th edn, New York: West Publishing.
Daniels, J.D. and L.H. Radebaugh (2000) International Business: Environments and Operations, 9th edn, New York: Prentice Hall.
Dicken, P. (1992) Global Shift: The Internationalization of Economic Activity, 2nd edn, New York: Guilford.
Hesse, M. and J.-P. Rodrigue (2004) "The Transport Geography of Logistics and Freight Distribution", Journal of Transport Geography, 12(3), 171–84.
- Knox, P. and J. Agnew (1998) The Geography of the World Economy, 3rd edn, London: Arnold.
- Lakshmanan, T.J., U. Subramanian, W. Anderson and F. Leautier (2001) Integration of Transport and Trade Facilitation: Selected Regional Case Studies, Washington, DC: World Bank.
- McKinnon, A. (1988) "Physical Distribution", in J.N. Marshall (ed.) Services and Uneven Development, Oxford: Oxford University Press, pp. 133–59.
- Ullman, E.L. (1956) "The Role of Transportation and the Bases for Interaction", in W.L. Thomas Jr. (ed.) Man's Role in Changing the Face of the Earth, Chicago, IL: University of Chicago Press.
- Woxenius, J. (2002) Conceptual Modelling of an Intermodal Express Transport System, Delft: International Congress on Freight Transport Automation and Multimodality.
Urban transportation 7
Urbanization has been one of the dominant contemporary processes as a growing share of the global population lives in cities. Considering this trend, urban transportation issues are of foremost importance to support the passengers and freight mobility requirements of large urban agglomerations. Transportation in urban areas is highly complex because of the modes involved, the multitude of origins and destinations, and the amount and variety of traffi c. Traditionally, the focus of urban transportation has been on passengers as cities were viewed as locations of utmost human interactions with intricate traffi c patterns linked to commuting, commercial transactions and leisure/cultural activities. However, cities are also locations of production, consumption and distribution, activities linked to movements of freight. Conceptually, the urban transport system is intricately linked with urban form and spatial structure. Urban transit is an important dimension of urban transportation, notably in high density areas. To understand the complex relationships between transportation and land use and to help the urban planning process, several models have been developed.
Concept 1 – Transportation and urban form
Elements of the urban form
Urbanization has been one of the dominant trends of economic and social change of the twentieth century, especially in the developing world. Urban mobility problems have increased proportionally with urbanization, a trend refl ected in the growing size of cities and in the increasing proportion of the urbanized population. Since 1950, the world's urban population has more than doubled, to reach nearly 3 billion in 2000, about 47 percent of the global population. This is in part due to demographic growth and rural to urban migration, but more importantly to a fundamental change in the socioeconomic environment of human activities. Current trends indicate a growth of about 50 million urbanites each year, roughly a million a week. More than 90 percent of that growth occurs in developing countries. By 2050, 6.2 billion people, about two-thirds of humanity, are likely to be urban residents.
At the urban level, demographic and mobility growth have been shaped by the capacity and requirements of urban transport infrastructures, be they roads, transit systems or simply walkways. Consequently, there is a wide variety of urban form s, spatial structures and associated urban transportation systems.
Urban form. This refers to the spatial imprint of an urban transport system as well as the adjacent physical infrastructures. Jointly, they confer a level of spatial arrangement to cities.
Urban (spatial) structure. This refers to the set of relationships arising out of the urban form and its underlying interactions of people, freight and information.
Considering that each city has different socio-economic and geographical characteristics, the spatial imprint of transportation varies accordingly (Figure 7.1). For instance, while North American cities tend to have an urban formthat has been shaped by the automobile, cities in other parts of the world, because of different modal preferences and infrastructure developments, have different urban forms. Even if the geographical setting of each city varies considerably, the urban form and its spatial structure are articulated by two structural elements:
- Nodes. These are refl ected in the centrality of urban activities, which can be related to the spatial accumulation of economic activities or to the accessibility to the transport system. Terminals, such as ports, railyards and stations, and airports, are important nodes around which activities agglomerate at the local or regional level. Nodes have a hierarchy related to their importance and contribution to urban functions, such as production, management, retailing and distribution.
- Linkages. These are the infrastructures supporting fl ows from, to and between nodes. The lowest level of linkages includes streets, which are the defi ning elements of the urban spatial structure. There is a hierarchy of linkages moving up to regional roads and railways and international connections by air and maritime transport systems.
Urban transportation is organized in three broad categories of collective, individual and freight transportation. In several instances, they are complementary to one another, but sometimes they may be competing for the usage of available land and/or transport infrastructures:
- Collective transportation (public transit). The purpose of collective transportation is to provide publicly accessible mobility over specifi c parts of a city. Its effi ciency is based upon transporting large numbers of people and achieving economies of scale. It includes modes such as tramways, buses, trains, subways and ferryboats.
- Individual transportation. Includes any mode where mobility is the outcome of a personal choice and means such as the automobile, walking, cycling and the motor-
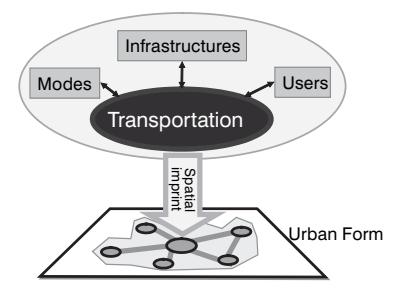
Figure 7.1 Transportation and urban form
- cycle. The majority of people walk to satisfy their basic mobility, but this number varies according to the city considered. For instance, walking accounts for 88 percent of all movements inside Tokyo while this fi gure is only 3 percent for Los Angeles.
- Freight transportation. As cities are dominant centers of production and consumption, urban activities are accompanied by large movements of freight. These movements are mostly characterized by delivery trucks moving between industries, distribution centers, warehouses and retail activities as well as from major terminals such as ports, railyards, distribution centers and airports.
Historically, movements within cities tended to be restricted to walking, which made medium- and long-distance urban linkages rather ineffi cient and time consuming. Thus, activity nodes tended to be agglomerated and urban form s compact. Many modern cities have inherited an urban form created under such circumstances, even though they are no longer prevailing. The dense urban cores of many European, Japanese and Chinese cities, for example, enable residents to make between one-third and two-thirds of all trips by walking or cycling. At the other end of the spectrum, the dispersed urban forms of most Australian, Canadian and American cities which were built recently, encourage automobile dependency.
Urban transportation is thus associated with a spatial form which varies according to the modes being used. In an age of motorization and personal mobility, an increasing number of cities are developing a spatial structure that increases reliance on motorized transportation, particularly the privately owned automobile. Dispersion, or urban sprawl, is taking place in many different types of cities, from dense, centralized European metropolises such as Madrid, Paris, and London, to rapidly industrializing metropolises such as Seoul, Shanghai, and Buenos Aires, to those experiencing recent, fast and uncontrolled urban growth, such as Bombay and Lagos.
For a commuter, the relationship between space and travel time changes dramatically with the transportation mode used (Figure 7.2):
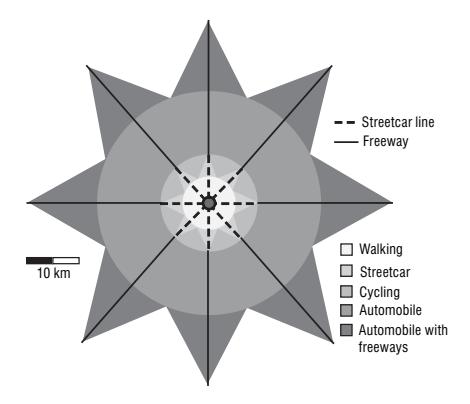
Figure 7.2 One-hour commuting according to different urban transportation modes (Source: adapted from Hugill, 1993, p. 213)
- Walking. Assuming a willingness to commutefor one hour, a pedestrian walking at 5 km per hour could cross about 5 km. The space/time relationship of such a commute would be a circle of 10 km in diameter.
- Streetcar. A streetcar, like those operating in the fi rst half of the twentieth century, could travel around 15 km per hour along fi xed lines. In this case, the space/time relationship would be star shaped and 15 km in diameter along the lines.
- Cycling. With approximately the same speed of a streetcar, but with no fi xed line limitations, the space/time relationship of commuting by bicycle would be a circle of 15 km in diameter.
- Driving (no freeways). With a driving speed of about 30 km per hour (taking into account of stops, lights, congestion and parking), an automobile creates a spherical space/time relationship of about 30 km in diameter.
- Driving (with freeways). Along a freeway, a fi xed infrastructure, the driving speed is doubled to 60 km per hour. The space/time relationship is then star shaped with 60 km diameter along its axis.
Evolution of transportation and urban form
The evolution of transportation has generally led to changes in urban form . The more radical the changes, the more the urban form has been altered. Among the most fundamental changes in urban form is the emergence of new clusters expressing new urban activities and new relationships between elements of the urban system. In many cities, the central business district (CBD), once the primary destination of commuters and serviced by public transportation, has been changed by new manufacturing, retailing and management practices. Whereas traditional manufacturing depended on centralized workplaces and transportation, technological and transportation developments rendered modern industry more fl exible. Retail and offi ce activities too are suburbanizing, producing changes in the urban form.
Each city has its own history, but it is possible to establish a general common process behind the evolution of the urban spatial structure (Figure 7.3):
• Pre-industrial era (A). For cities that existed before the industrial revolution, the CBD was limited to a small section of the city generally near the waterfront, the
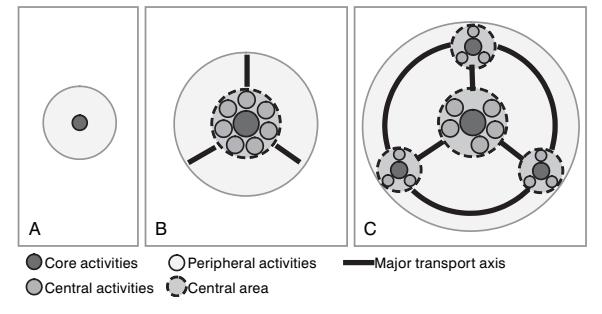
Figure 7.3 Evolution of the spatial structure of a city
market and/or a site of religious or political importance. These were locations where major transactions took place and thus required fi nancial, insurance, warehousing and wholesale services.
- Industrial revolution (B). With the industrial revolution came mass production and mass consumption. This permitted the emergence of a distinct retailing and wholesaling part of the CBD while manufacturing located outside the core. Managing these expanding activities also created an increasing need for offi ce space located near traditional places of fi nancial interaction. As the industrial revolution matured, major transportation axes spurred from the central area towards the periphery.
- Contemporary era (C). In the contemporary era, industries massively relocated away from the CBD to suburban areas, leaving room for the expansion of administrative and fi nancial activities. The CBD was thus the object of an important accumulation of fi nancial and administrative activities as several corporations became multinational enterprises. These activities were even more willing to pay higher rents than retailing, thereby pushing some retail activities out of the CBD. New retailing sub-centers emerged in suburban areas because of road accessibility and because of the needs to service these new areas. Warehousing and transportation, no longer core area activities, have also relocated to new peripheral locations.
From the 1950s, the growth of suburbs was mainly taking place adjacent to major road corridors, leaving a lot of vacant/farm land in between. Later, intermediate spaces were gradually fi lled up, more or less coherently. Highways and ring roads, which circled and radiated from cities, have favored the development of suburbs and the emergence of important sub-centers that compete with the central business district for the attraction of economic activities. As a result, many new job opportunities have shifted to the suburbs (if not to entirely new locations abroad) and the activity system of cities has been considerably modifi ed. Different parts of a city have a different dynamism depending on its spatial pattern. These changes have occurred differently according to the variety of geographical and historical contexts, notably in North America and Europe. In addition, North American and European cities have seen different changes in urban density. However, two processes have a substantial impact on contemporary urban form s:
- Dispersed urban land development patterns have been dominant over the last 50 years in North America, where land is abundant, transportation costs are low, and the economy has become dominated by service and technology industries. Under such circumstances, it is not surprising to fi nd that there is a strong relationship between urban density and car use. For many cities their built up areas have grown at a faster rate than their populations. In addition, commutinghas become relatively inexpensive compared with land costs, so households have an incentive to buy lower-priced housing at the urban periphery. Similar patterns can be found in many European cities, but this change is occurring at a slower pace and involving a smaller range.
- Decentralization of activities resulted in two opposite effects. First, commuting time has remained relatively stable in duration. Second, commuting increasingly tends to be longer and to be made using the automobile rather than by public transit, a trend occurring in developing as well as in developed countries. Most transit and road systems were developed to facilitate suburb-to-city, rather than suburb-tosuburb, commuting. As a result, suburban highways are often as congested as urban highways.
Although transportation systems and travel patterns have changed considerably over time, one enduring feature remains that most people travel less than 30–40 minutes in one direction. Globally, people are spending about 1.2 hours per day commuting, wherever this takes place in a low or a high mobility setting. Different transport technologies, however, are associated with different travel speeds and capacity. As a result, cities that rely primarily on non-motorized transport tend to be different than auto-dependent cities. Transport technology thus plays a very important role in defi ning urban formand the spatial pattern of various activities.
Because of its high level of motorization, the United Stateshas the lowest average commutingtime in the world, around 25 minutes in 1990 (Figure 7.4). The commuters of Western Europe and Japan, who are more dependent on walking and public transit and in spite of more compact cities, have longer commuting times. However, the last decade has shown growing commuting times, mainly due to increasing congestion levels in metropolitan areas.
The spatial imprint of urban transportation
The amount of urban land allocated to transportation is often correlated with the level of mobility. In the pre-automobile era, about 10 percent of urban land was devoted to transportation. As the mobility of people and freight increased, a growing share of urban areas is allocated to transport and the infrastructures supporting it. Large variations in the spatial imprint of urban transportation are observed between different cities as well as between different parts of a city, such as between central and peripheral areas. The major components of the spatial imprint of urban transportation are:
- Pedestrian areas. The amount of space devoted to walking. This space is often shared with roads as sidewalks may use between 10 and 20 percent of a road's right of way. In central areas, pedestrian areas tend to use a greater share of the right of way and in some instances, whole areas are reserved for pedestrians. However, in a motorized context, most pedestrian areas are for servicing people's access to parked automobiles.
- Roads and parking areas. The amount of space devoted to road transportation, which has two states of activity: moving or parked. In a motorized city, on average
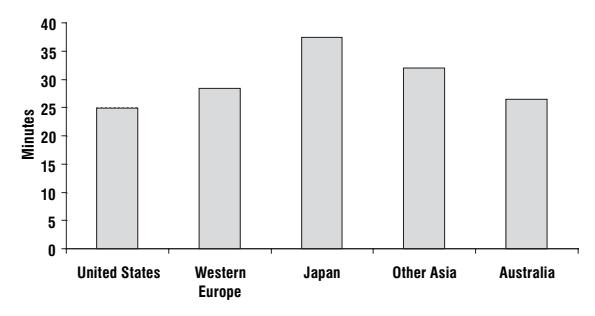
Figure 7.4 Average journey to work travel time, 1990 (Source: Wendell Cox Consultancy (2001), www.demographia.com)
30 percent of the surface is devoted to roads while another 20 percent is required for off-street parking. This implies for each car about two off-street and two on-street parking spaces. In North American cities, roads and parking lots account for between 30 and 60 percent of the total surface.
- Cycling areas. In a disorganized form, cycling simply shares access to road space. However, many attempts have been made to create spaces specifi cally for bicycles in urban areas, with reserved lanes and parking facilities.
- Transit systems. Many transit systems, such as buses and tramways, share road space with automobiles, which often impairs their respective effi ciency. Attempts to mitigate congestionhave resulted in the creation of road lanes reserved for buses. Other transport systems such as subways and rail have their own infrastructures and, consequently, their own rights of way.
- Transport terminals. The amount of space devoted to terminal facilities such as ports, airports, transit stations, railyards and distribution centers. Globalization has increased the amount of people and freight circulation and consequently the amount of urban space required to support those activities. Many major terminals are located in the peripheral areas of cities, which are the only locations where suffi cient amounts of land are available.
The spatial importance of each transport mode varies according to a number of factors, density being the most important. If density is considered as a gradient, rings of mobility represent variations in the spatial importance of each mode at providing urban mobility. Further, each transport mode has unique performance and space consumption characteristics. The most relevant example is the automobile. It requires space to move around (roads) but it also spends 98 percent of its existence stationary in a parking space. Consequently, a signifi cant amount of urban space must be allocated to accommodate the automobile, especially when it does not move and is thus economically and socially useless. At an aggregate level, measures reveal a signifi cant spatial imprint of road transportation among developed countries. In the United States , more land is thus used by the automobile than for housing. In Western Europe, roads account for between 15 and 20 percent of the urban surface while for developing countries, this fi gure is about 10 percent (6 percent on average for Chinese cities).
Transportation and the urban structure
Rapid and expanded urbanization occurring around the world involves an increased number of trips in urban areas. Cities have traditionally responded to growth in mobility by expanding the transportation supply, by building new highways and/or transit lines. In the developed world, that has mainly meant building more roads to accommodate an ever-growing number of vehicles, therefore creating new urban structures. Several urban spatial structures have accordingly emerged, with the reliance on the automobile being the most important discriminatory factor. Four major types can be identifi ed at the metropolitan scale (Figure 7.5):
• Type I – completely motorized network. Represents an automobile-dependent city with a limited centrality. Characterized by low to average land use densities, this automobile-oriented city assumes free movements between all locations. Public transit has a residual function while a signifi cant share of the city is occupied by structures servicing the automobile, notably highways and large parking lots. This type of urban structure requires a massive network of high capacity highways to the point that urban effi ciency is based on individual transportation. Secondary
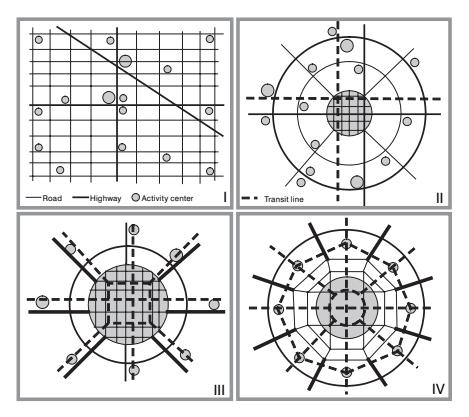
Figure 7.5 Four main types of urban spatial structures
roads converge at highways, along which small centers are located, notably near interchanges. This system characterizes recent cities in a North American context where urban growth occurred in the second half of the twentieth century, such as Los Angeles, Phoenix, Denver and Dallas.
- Type II weak center. Represents the spatial structure of many American cities where many activities are located in the periphery. These cities are characterized by average land use densities and a concentric pattern. The central business district is relatively accessible by the automobile. The result is an under-used public transit system, which is unprofi table in most instances and thus requires subsidies. It is also impossible to serve all the territory with the transit system, so services are often oriented along major corridors. In many cases, ring roads favored the emergence of a set of small centers in the periphery, notably at the convergence of radial lines, some of them effectively competing with the downtown area for the location of economic activities. This system is often related to older cities, which emerged in the fi rst half of the twentieth century, such as Melbourne, San Francisco and Montreal, and were then substantially impacted by motorization.
- Type III strong center. Characterizes cities having a high land use density and high levels of accessibility to urban transit. There are thus limited needs for highways and parking space in the central area, where a set of high capacity public transit lines service most of the mobility needs. The productivity of this urban area is thus mainly related to the effi ciency of the public transport system. The convergence of radial roads and ring roads favors the location of secondary centers, where activities that were no longer able to afford a central location have located. This system characterizes cities with important commercial and fi nancial functions and which grew in the nineteenth century, such as Paris, New York and Tokyo.
- Type IV traffi c limitation. Represents those urban areas that have effi ciently implemented traffi c control and modal preference in their spatial structure. Commonly the central area is dominated by public transit. They have a high land use density and were planned to limit the usage of the automobile in central zones for a variety of
reasons, such as to preserve its historical character or to avoid congestion. Through a "funnel" effect, the capacity of the road transport system is reduced the closer one gets to the central area. Public transit is used in central areas, while individual transportation takes a greater importance in the periphery. Between suburbs and the central city are places of interface between individual (automobile) and collective transportation or between low capacity collective transportation (bus) to high capacity collective transportation (metro, rail). Several cities are implementing this strategy, as it keeps cars from the central areas while giving mobility in the suburbs. This system typifi es cities with a long planning history favoring public transit, particularly in socialist economies. London, Singapore, Hong Kong, Vienna and Stockholm are good examples of this urban transport structure.
There are different scales on which transportation systems infl uence the structure of communities, districts and the whole metropolitan area. For instance, one of the most signifi cant impacts of transportation on the urban structure has been the clustering of activities near areas of high accessibility. The impact of transport on the spatial structure is particularly evident in the emergence of suburbia. Although many other factors are important in the development of suburbia, including low land costs, available land (large lots), the environment (clean and quiet), safety, and car-oriented services (shopping malls), the spatial imprint of the automobile is dominant. Initially an American invention, suburban developments have occurred in many cities worldwide, although no other places have achieved such a low density and high automobile dependency as in the United States .
Facing the expansion of urban areas, congestionproblems and the increasing importance of inter-urban movements, ring roads have been built around several major cities. They became an important attribute of the spatial structures of cities, notably in North America (Figure 7.6). Ring roads impact on spatial structure by favoring a radial pattern (doughnut effect) and the development of commercial, residential and industrial activities near highwayinterchanges. The decreasing dynamism of central areas is often linked with the emergence of centers in the periphery. Ring roads also improved accessibility within a metropolitan area, especially at the periphery. As indicated in Figure 7.6, prior to the construction of a ring road, going from point A to point B would take 30 minutes, with delays mainly imposed by having to go through
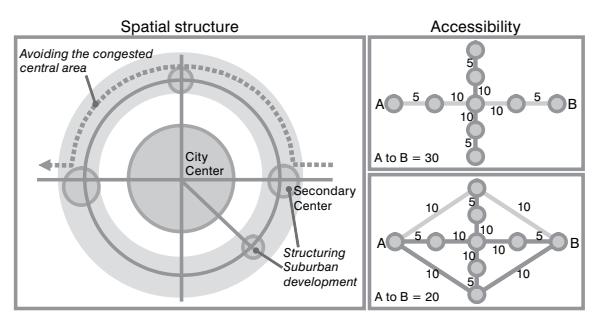
Figure 7.6 The rationale of a ring road
the central area. Once a ring road has been established, travel time between point A and point B is reduced to 20 minutes.
Concept 2 – Urban land use and transportation
The land use – transport system
Urban land use comprises two elements: the nature of land use which relates to what activities are taking place where, and the level of spatial accumulation, which indicates their intensity and concentration. Most economic, social or cultural activities imply a multitude of functions, such as production, consumption and distribution. These functions take place at specifi c locations and are part of an activity system. Activities have a spatial imprint, therefore. Some are routine activities, because they occur regularly and are thus predictable, such as commuting and shopping. Others are institutional activities that tend to be irregular and are shaped by lifestyle (sports, leisure, etc.) or by special needs (health, etc.). Still others are production activities that are related to manufacturing and distribution, whose linkages may be local, regional or global. The behavioral patterns of individuals, institutions and fi rms have an imprint on land use. The representation of this imprint requires a typology of land use, which can be formal or functional:
- Formal land use representations are concerned with qualitative attributes of space such as its form, pattern and aspect and are descriptive in nature.
- Functional land use representations are concerned with the economic nature of activities such as production, consumption, residence, and transport, and are mainly a socio-economic description of space.
Land use, both in formal and functional representations, implies a set of relationships with other land use s. For instance, commercial land use involves relationships with its supplier and customers. While relationships with suppliers will dominantly be related to movements of freight, relationships with customers would include movements of passengers. Since each type of land use has its own specifi c mobility requirements, transportation is a factor of activity location, which in turn is associated with specifi c land uses. Transportation and land use interactions have often been described as a chicken-and-egg problem since it is diffi cult to identify the triggering cause of change.
Urban transportation aims at supporting transport demands generated by the diversity of urban activities in a diversity of urban contexts. A key for understanding urban entities thus lies in the analysis of patterns and processes of the transport/land use system. This system is highly complex and involves several relationships between the transport system, spatial interaction s and land use:
- Transport system. Considers the set of transport infrastructures and modes that support urban movements of passengers and freight. It generally expresses the level of accessibility.
- Spatial interactions. Consider the nature, extent, origins and destinations of urban movements of passengers and freight. They take into consideration the attributes of the transport system as well as the land use factors that generate and attract movements.
- Land use. Considers the level of spatial accumulation of activities and their associated levels of mobility requirements. Land use is commonly linked with demographic and economic attributes.
Transportation and economic systems have a reciprocal relationship (Figure 7.7). In other words, transport supply and demand are mutually interdependent. For instance, the construction of a highway interchange favors the concentration of commercial and service activities, which will generate additional transport demand, which in turn will favor the location of new activities and a reorganization of the regional spatial structure. A transportation/land usesystem can be divided into three subcategories of models. 1) Land use models are generally concerned about the spatial structure of macro- and micro-economic components, which are often correlated with transportation requirements. For instance, by using a set of economic activity variables, such as population and level of consumption, it becomes possible to calculate the generation and attraction of passengers and freight fl ows. 2) Spatial interactions models are mostly concerned about the spatial distribution of movements, a function of land use (demand) and transportation infrastructure (supply). They produce fl ow estimates between spatial entities, symbolized by origin–destination pairs, which can be disaggregated by nature, mode and time of day. 3) Transportation network models try to evaluate how movements are allocated over a transportation network , often of several modes, notably private and public transportation. They provide traffi c estimates for any given segment of a transportation network.
Urban land use models
Several descriptive and analytical models of urban land usehave been developed. All involve some consideration of transport in the explanations of urban land use structure:
• Von Thunen 's regional land use model is probably one of the oldest relationships found between transportation, urban areas and regional land use. It was initially developed in the early nineteenth century (1826) for the analysis of agricultural land
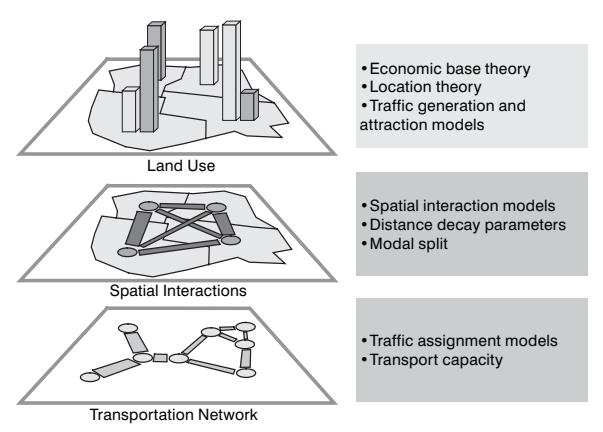
Figure 7.7 Transportation/land use relationships
use patterns in Germany. It used the concept of economic rent to explain a spatial organization where different agricultural activities are competing for the usage of land (Figure 7.8). Although this model has conceptually little relevance to urban land use, its underlying principles have been the foundation of many models where economic considerations, namely land rent and distance-decay, shape urban land use. The core assumption of this functional land use model is that agricultural land use is segregated in concentric circles around a market. Many concordances of this model with reality have been found, notably in North America.
- The Burgessconcentric model was among the fi rst attempts to investigate spatial patterns at the urban level (1925). Although the purpose of the model was to analyze social classes, it recognized that transportation and mobility were important factors behind its spatial organization. The formal land userepresentation of this model is derived from commuting distance from the CBD, creating concentric circles (Figure 7.9). Each circle represents a specifi c socio-economic urban landscape. This model is conceptually a direct adaptation of the Von Thunenmodel to urban land use since it deals with a concentric representation.
- Sector and nuclei land use models were developed to take into account numerous factors overlooked by the concentric models, namely the infl uence of transport axes (1939) and multiple nuclei (1945) on land use and growth. Both representations consider the emerging impacts of motorization on the urban spatial structure. The sector model is based on the recognition that communication axes, such as rail lines and major roads, guide development and thus transport has a directional effect on land use (Figure 7.10). Cities grow along major axes. The multiple nuclei model is based upon empirical evidence that many towns and nearly all large cities do not grow around one CBD, but are formed by the progressive integration of a number of separate nuclei in the urban pattern. These nodes become specialized and differentiated in the growth process and are not located in relation to any distance attribute.
- Hybrid models tried to include the concentric, sector and nuclei behavior of different processes in explaining urban land use . They are an attempt to integrate the strengths
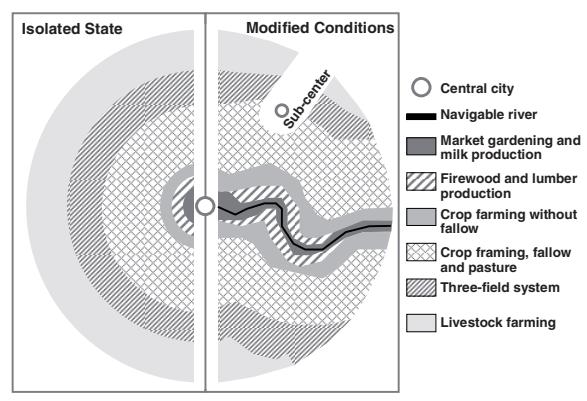
Figure 7.8 Von Thunen's regional land use model
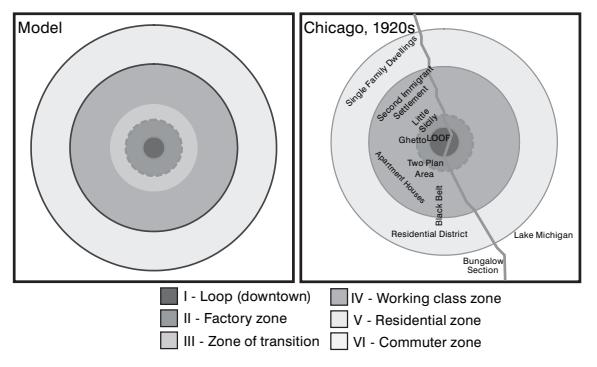
Figure 7.9 The Burgess urban land use model
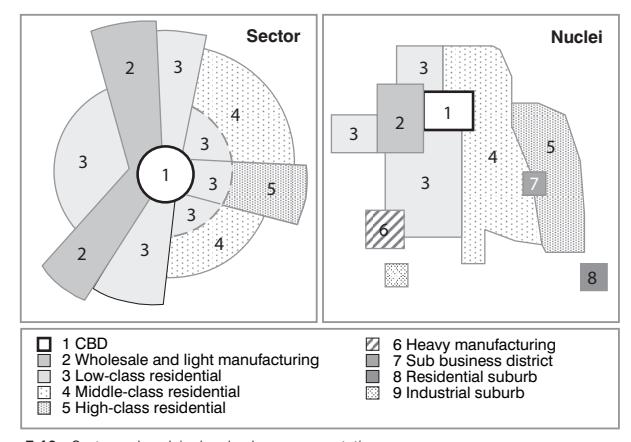
Figure 7.10 Sector and nuclei urban land use representations
of each approach since none of these appear to provide a completely satisfactory explanation. Thus, hybrid models, such as that developed by Isard (1956), consider the concentric effect of nodes (CBDs and sub-centers) and the radial effect of transport axes, all overlain to form a land use pattern (Figure 7.11).
• Land rent theory was also developed to explain land useas a market where different urban activities compete for land usage at a location. The more desirable the location, the higher its rent value. Transportation, through accessibility and distance-decay,
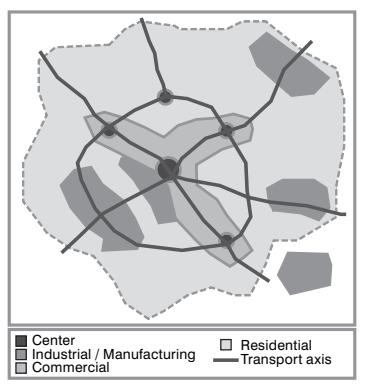
Figure 7.11 Hybrid land use representation
is a strong explanatory factor in the land rent and its impacts on land use. However, conventional representations of land rent are being challenged by structural modifi cations of contemporary cities. Figure 7.12 illustrates the basic principles of the land rent theory. It assumes a center which represents a desirable location with a high level of accessibility. The closest area, within a radius of 1 km, has about 3.14 square kilometers of surface (S = πD2 ). Under such circumstances, the rent is a function of the availability of land, which can be expressed in a simple fashion as 1/S. As we move away from the center the rent drops substantially since the amount of available land increases exponentially.
Most of these models are essentially static as they explain land use patterns. They do not explicitly consider the processes that are creating or changing them.
Transportation and urban dynamics
Both land use and transportation are part of a dynamic system that is subject to external infl uences. Each component of the system is constantly evolving due to changes in technology, policy, economics, demographics and even culture/values, among others. As a result, the interactions between land use and transportation are played out as the result of the many decisions made by residents, businesses and governments. The fi eld of urban dynamics has expanded the scope of conventional land use models, which tended to be descriptive, by trying to consider the many relationships behind the evolution of the urban spatial structure. This has led to a complex modeling framework including a wide variety of components. Among the concepts supporting urban dynamics representations are retroactions, where as one component infl uences others. The changes will infl uence the initial component as feedback, either positively or negatively. The most signifi cant components of urban dynamics are:
• Land use. The most stable component of urban dynamics as changes are likely to modify the land usestructure over a rather long period of time. This comes as
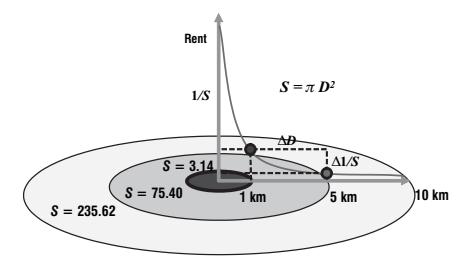
Figure 7.12 Land rent theory
little surprise since most real estate is built to last at least several decades. The main impact of land use on urban dynamics is its function as a generator and attractor of movements.
- Transport network. Also considered to be a rather stable component of urban dynamics as transport infrastructures are built for the long term. This is particularly the case for large transport terminals and subway systems that can operate for a very long period of time. For instance, many railway stations are more than 100 years old. The main impact of the transport networkon urban dynamics is by providing accessibility. Changes in the transport network will impact accessibility and movements.
- Movements. The most dynamic component of the system, since movements of passengers or freight refl ect changes almost immediately. Movements thus tend to be an outcome of urban dynamics rather than a factor shaping them.
- Employment and workplaces. They account for signifi cant inducement effects over the urban dynamics since many models often consider employment as an exogenous factor. This is specifi cally the case for employment labeled as basic, or export oriented, which is linked with specifi c economic sectors such as manufacturing. Commuting is a direct outcome of the number of jobs and the location of workplaces.
- Population and housing. They act as a generator of movements as residential areas account for the origin of commuting . Since there are a wide variety of incomes, standards of living, preferences and ethnicity, this diversity is refl ected in the urban spatial structure.
The issue about how to articulate these relations remains and has been the focus of substantial research.
Concept 3 – Urban mobility
Evolution of urban mobility
Rapid urban development occurring across much of the globe implies increased quantities of passengers and freight moving within urban areas. Movements also tend to involve longer distances, but evidence suggests that commutingtimes have remained relatively stable in the twentieth century, approximately 1.2 hours per day. This means that commuting has gradually shifted to faster transport modes and consequently greater distances could be traveled using the same amount of time. Different transport
technologies and infrastructures have been implemented, resulting in a wide variety of urban transport systems around the world. In developed countries, there have been three general eras of urban development, and each is associated with a different form of urban mobility:
- The walking/horse-car era (1800–1890). Even during the onslaught of the industrial revolution, the dominant means of getting around was on foot. Cities were typically less than 5 kilometers in diameter, making it possible to walk from the downtown to the city edge in about 30 minutes. Land use was mixed and density was high (e.g. 100 to 200 people per hectare). The city was compact and its shape was more or less circular. The development of the fi rst public transit in the form of omnibus service extended the diameter of the city but did not change the overall urban structure. The railroad facilitated the fi rst real change in urban morphology. These new developments, often referred to as trackside suburbs, emerged as small nodes that were physically separated from the city itself and from one another. The nodes coincided with the location of rail stations and stretched out a considerable distance from the city center, usually up to a half-hour train ride. Within the city proper, rail lines were also laid down and horse-cars introduced mass transit.
- The electric streetcar or transit era (1890–1920s). The invention of the electric traction motor created a revolution in urban travel. The fi rst electric trolley line opened in 1888 in Richmond. The operating speed of the electric trolley was three times faster than that of horse-drawn vehicles. The city spread outward 20 to 30 kilometers along the streetcar lines, creating an irregular, star-shaped pattern. The urban fringes became areas of rapid residential development. Trolley corridors became commercial strips. The city core was further entrenched as a mixed-use, high density zone. Overall densities were reduced to between 50 and 100 people per hectare. Land use patterns refl ected social stratifi cation where suburban outer areas were typically middle class while the working class continued to concentrate in the central city.
- The automobile era (1930 onward). The automobile was introduced in European and North American cities in the 1890s, but only the wealthy could afford this innovation. From the 1920s, ownership rates increased dramatically, with lower prices made possible by Henry Ford's revolutionary assembly-line production techniques. As automobiles became more common, land development patterns changed. Developers were attracted to green-fi eld areas located between the suburban rail axes, and the public was attracted to these single-use zones, thus avoiding the evils of the industrial city. Suburban home building companies were no longer willing to subsidize privately owned streetcar companies to provide cheap access to their trolley-line neighborhoods. Transit companies ran into fi nancial trouble, and eventually transit services throughout North America and Europe became subsidized, publicly owned enterprises. As time went on, commercial activities also began to suburbanize. Within a short time, the automobile was the dominant mode of travel in all cities of North America. The automobile has reduced the friction of distanceconsiderably which has led to urban sprawl.
Urban transit
Transit is predominantly an urban transportation mode, particularly in large urban agglomerations. The urban environment is particularly suitable for transit because it provides conditions fundamental to its effi ciency, namely high density and high short distance mobility demands. Since transit is a shared public service, it potentially benefi ts from economies of agglomeration related to high densities and from economies of scale related to high mobility demands. The lower the density in which a transit system operates, the lower the demand, with the greater likelihood that it will be run at a loss and may have to be subsidized. Transit systems are made up of many types of services. Different modes are used to provide complementary services within the transit system and in some cases between the transit system and other transport systems.
Figure 7.13 represents a hypothetical urban transitsystem. Each of its components is designed to provide a specifi c array of services. Among the defi ning factors of urban transit are frequency, fl exibility, costs and distance between stops:
- Metro system. A heavy railsystem, often underground in central areas (parts above ground at more peripheral locations), with fi xed routes, services and stations. Transfers between lines or to other components of the transit system (mainly buses and light rail) are made at connected stations. The service frequency tends to be uniform throughout the day, but increases during peak hours. Fares are commonly access driven and constant, implying that once a user has entered the system the distance traveled has no impact on the fare. However, with the computerization of many transit fare systems, zonal/distance driven fares are becoming more common.
- Bus system. Characterized by scheduled fi xed routes and stops serviced by motorized multiple-passenger vehicles (45–80 passengers). Services are often synchronized with other heavy systems, mainly metro and transit rail , where they act as feeders. Express services, using only a limited number of stops, can also be available, notably during peak hours. Since metro and bus systems are often managed by the same transit authority, the user's fare is valid for both systems.
- Transit rail system. Fixed rail comes into two major categories. The fi rst is the tram rail system, which is mainly composed of streetcars (tramways) operating in central areas. They can consist of up to four cars. The second is the commuter rail system, which is composed of passenger trains mainly developed to service peripheral/ suburban areas through a heavy (faster and longer distances between stations) or light rail system (slower and shorter distances between stations). Frequency of services is
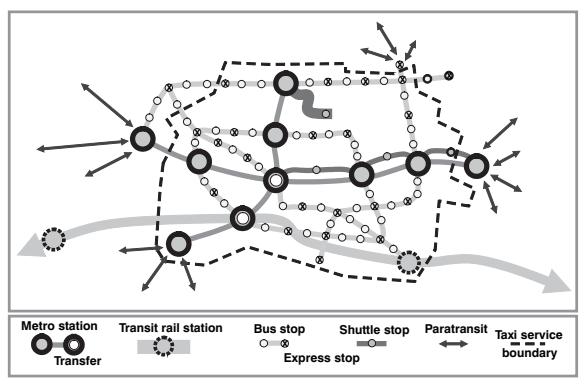
Figure 7.13 Components of an urban transit system
- strongly linked with peak hours and traffi c tends to be imbalanced. Fares tend to be separate from the transit system and proportional to distance or service zones.
- Shuttle system. Composed of a number of privately (dominantly) owned services using small buses or vans. Shuttle routes and frequencies tend to be fi xed, but can be adapted to fi t new situations. They service numerous specifi c functions such as expanding mobility along a corridor during peak hours, linking a specifi c activity center (shopping mall, university campus, industrial zone, hotel, etc.) or aimed at servicing the elderly or people with disabilities.
- Paratransit system. A fl exible and privately owned collective demand–response system composed of minibuses, vans or shared taxis commonly servicing peripheral and low density zones. Their key advantage is the possibility of a door-to-door service, less loading and unloading time, less stops and more maneuverability in traffi c. In many cities in developing countries, this system is informal, dominant and often services central areas because of inadequacies or high costs of the formal transit system.
- Taxi system. Comprises privately owned cars or small vans offering an on-call, individual demand–response system. Fares are commonly a function of a metered distance/time, but sometimes can be negotiated. A taxi system has no fi xed routes, but is rather servicing an area where a taxi company has the right (permit) to pick up customers. Commonly, rights are issued by a municipality and several companies may be allowed to compete on the same territory. When competition is not permitted, fares are set up by regulations.
Contemporary transit systems tend to be publicly owned, implying that many decisions related to their development and operation are politically motivated. This is a sharp contrast to the past when most transit systems were private and profi t driven initiatives. With the fast diffusion of the automobile in the 1950s, many transit companies faced fi nancial diffi culties, and the quality of their service declined. They were purchased by public interests, mainly for the sake of providing mobility. As such, public transit often serves more a social function of public service and a tool of social equity than any sound economic role. Transit has become dependent on government subsidies, with little if any competition permitted as wages and fares are regulated. Transit systems tend to have limited relationships with economic activities, particularly in suburban areas.
Reliance on urban transitas a mode of urban transportation tends to be high in Asia, intermediate in Europe and low in North America. Since their inception in the early nineteenth century, comprehensive urban transit systems had signifi cant impacts on the urban formand spatial structure. Three major classes of cities can be found in terms of the relationships they have with their transit systems (Cervero, 1998):
- Adaptive cities. True transit-oriented cities where urban form and urban land use developments are coordinated with transit developments. While central areas are adequately serviced by a metro system and are pedestrian friendly, peripheral areas are oriented along transit rail lines.
- Adaptive transit. Cities where transit plays a marginal and residual role and where the automobile accounts for the dominant share of movements. The urban formis decentralized and of low density.
- Hybrids. Cities that have sought a balance between transit development and automobile dependency. While central areas have an adequate level of service, peripheral areas are automobile-oriented.
Contemporary land development tends to precede the introduction of urban transit services, as opposed to concomitant developments in earlier phases of urban growth. Transit authorities operate under a service warrant. This has led to a set of considerations aimed at a higher integration of transit in the urban planning process, especially in North America, where such a tradition is not well established. Local land use impacts can be categorized in three dimensions of relationships with transit systems, including accessibility to the transit system, the convergence of local movements to transit stations and the integration of local land use with urban transit (Figure 7.14):
- Accessibility. The sole purpose of a transit stop is to provide accessibility to the transit system, such as stops along a bus route. Land use impacts for the stop are often minimal, if non-existent, with basic facilities to accommodate waiting time such as shelters. Accessibility defi nes the local market area of a transit service. For instance, for a new residential area, a minimum catchment area of 400 dwelling units or 1,000 residents within a 450-meter walk distance to a transit stop is often required for an extension of service. In a low transit use environment, accessibility to a transit stop has little if no impact on land use as access is a mere matter of convenience to a marginal segment of the population. As the level of transit use increases, accessibility has a signifi cant impact on local land use by favoring band-like developments along transit lines, since a growing share of the local population uses transit as a factor of urban mobility.
- Convergence. This generally applies to more important transit stops, notably rail and subway stations with terminal structures, including waiting areas and basic services. The transit station is a point of convergence of local traffi c and often serves more than one mode. The impacts on land use are varied, ranging from park-and-ride facilities to activities that take advantage of fl ows, such as restaurants and convenience stores, and possibly offi ce activities. The stations have to consider the nature and scale of movements generated. Convergence in a low level of transit use implies walking from the vicinity, basic park-and-ride possibilities and occasional drops and pickups by passenger vehicles. Transit subsystems, such as local buses, rarely converge to stops/terminals in a low transit use environment, since the demand would not justify them. As transit use increases, the convergence function may become signifi cant,
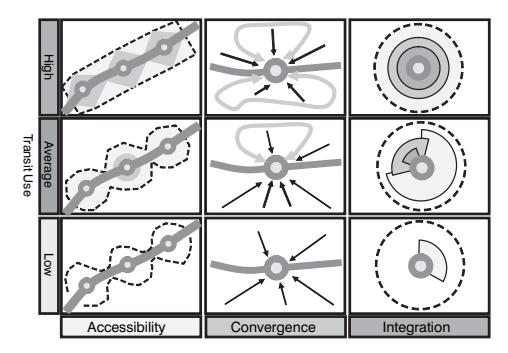
Figure 7.14 Transit and urban land use impacts
- with substantial park-and-ride facilities and dedicated local transit routes collecting passengers for the stop/terminal.
- Integration. Large, multi-level terminals with well-integrated high-density planning designs. Local land use is consequently highly linked with the transit system, which supports a large share of the mobility. The terminal acts as a local central place with its implied hierarchy of land uses with adjacent commercial activities. Medium and low density residential areas are located further away. There are different possible levels of integration, from simple terminal design with little local impact to high integration to local land use where transit is dominant. Signifi cant transit terminals offer opportunities to integrate local land use to transit accessibility.
From a transportation perspective, the potential benefi ts of better integration between transit and local land uses are reduced trip frequency and increased use of alternative modes of travel (i.e. walking, biking and transit). Evidence is often lacking to support such expectations. Community design can consequently have a signifi cant infl uence on travel patterns. Land use initiatives should be coordinated with other planning and policy initiatives to cope with automobile dependence. However, there is a strong bias against transit in the general population because of negative perceptions, especially in North America, but increasingly globally. As personal mobility is a symbol of status and economic success, the users of public transit are perceived as the least successful segment of the population. This bias may prevent transit use by a segment of the population.
Types of urban movements
Movements are linked to specifi c urban activities and their land use. Each type of land use involves the generation and attraction of a particular array of movements. This relationship is complex, but is linked to factors such as recurrence, income, urban form , spatial accumulation, level of development and technology. Urban movements are either obligatory, when they are linked to scheduled activities (such as home-to-work movements), or voluntary, when those generating it are free to decide their scheduling (such as leisure). The most common types of urban movements are:
- Pendular movements. These are obligatory movements involving commuting between locations of residence and work. They are highly cyclical since they are predictable and recur on a regular basis, most of the time a daily occurrence.
- Professional movements. These are movements linked to professional, work-based activities such as meetings and customer services, dominantly taking place during work hours.
- Personal movements. These are voluntary movements linked to the location of commercial activities, which includes shopping and recreation.
- Touristic movements. Important for cities with historical and recreational features, they involve interactions between landmarks and amenities such as hotels and restaurants. They tend to be seasonal in nature or to occur at specifi c moments. Major sport events such as the World Cup or the Olympics are important generators of urban movements.
- Distribution movements. These are concerned with the distribution of freight to satisfy consumption and manufacturing requirements. They are linked to distribution centers and retail outlets.
Dense cities, which also tend to be older (such as Western European cities), are generally more transit oriented, while younger cities (such as those in the USA and Australia) tend to rely more on the automobile as the major mode for urban travel (Figure 7.15). In developing countries, cycling and walking are dominant modes, obviously because of their low costs and the lack of modern transport infrastructures. Within the United States , a greater share of work trips are made by the automobile in sprawling cities such as Phoenix and Houston than in denser cities such as New York and San Francisco.
The share of the automobile in urban trips varies in relation to location, social status, income, quality of public transit and parking availability. Mass transit is often affordable, but several social groups, such as students, the elderly and the poor are a captive market. There are important variations in mobility according to age, income, gender and disability. The so-called gender gap in mobility is the outcome of socioeconomic differences as access to individual transportation is dominantly a matter of income. Consequently, in some instances modal choice is more a modal constraint linked to economic opportunities.
In central locations, there are generally few transport availability problems because private and public transport facilities are present. However, in locations outside the central core that are accessible only by the automobile, a signifi cant share of the population is isolated if they do not own an automobile. Limited public transit and high automobile ownership costs have created a class of spatially constrained (mobility deprived) people. They neither have access to the services in the suburb nor, more importantly, to the jobs that are increasingly concentrated in those areas.
Concept 4 – Urban transport problems
Geographical challenges facing urban transportation
Cities are locations with a high level of accumulation and concentration of economic activities and are complex spatial structures that are supported by transport systems. The most important transport problems are often related to urban areas, when transport systems, for a variety of reasons, cannot satisfy the numerous requirements of urban mobility. Urban productivity is highly dependent on the effi ciency of its transport system to move labor, consumers and freight between multiple origins and destinations. Some problems are ancient, like congestion (which plagued cities such as Rome), and
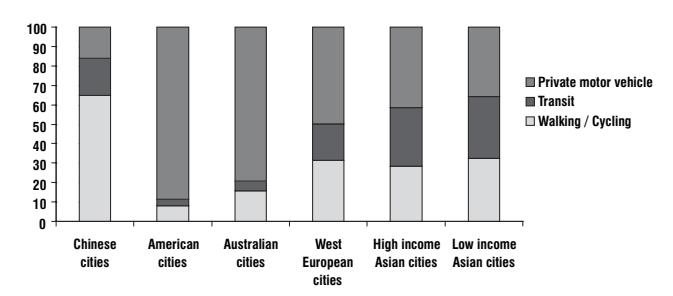
Figure 7.15 Modal split for global cities, 1995 (Source: Kenworthy and Laube, 2001)
others are new, like urban freight distribution or environmental impacts, notably CO2 emissions linked with the diffusion of the internal combustion engine. Among the most notable urban transport problems are:
- Traffi c congestionand parking diffi culties. Congestion is one of the most prevalent transport problems in large urban agglomerations. It is particularly linked with the diffusion of the automobile, which increases the demand for transport infrastructure, which has often not been able to keep up with the growth of mobility.
- Public transport inadequacy. Many public transit systems, or parts of them, are either over or under used. During peak hours, overcrowdedness creates discomfort for users, while low ridership makes many services fi nancially unsustainable, particularly in suburban areas.
- Diffi culties for pedestrians. These diffi culties are either the outcome of intense traffi c, where the mobility of pedestrians and vehicles are impaired, or because of a blatant lack of consideration for pedestrians in the physical design of facilities.
- Loss of public space. The majority of roads are publicly owned and access to them is free. Increased traffi c has adverse impacts on public activities which once crowded the streets such as markets, agoras, parades and processions, games, and community interactions. These have gradually disappeared to be replaced by automobiles. In many cases these activities have shifted to shopping malls, while in other cases they have been abandoned altogether. Traffi c fl ows infl uence the life and interactions of residents and their usage of street space. More traffi c impedes social interactions and street activities. People tend to walk and cycle less when traffi c is heavy.
- Environmental impacts and energyconsumption. Pollution, including noise, generated by circulation has become a serious impediment to the quality of life and even the health of urban populations. Further, energy consumption by urban transportation has dramatically increased and so also has the dependency on petroleum.
- Accidents and safety. Growing traffi c in urban areas is linked with a growing number of accidents and fatalities, especially in developing countries. As traffi c increases, people feel less safe to use the streets.
- Land consumption. Between 30 and 60 percent of a metropolitan area may be devoted to transportation, an outcome of the over-reliance on some forms of urban transportation.
- Freight distribution. The materialization of the economy has produced growing quantities of freight moving within metropolitan areas. As freight traffi c commonly shares infrastructures with passenger circulation, the mobility of freight in urban areas has become increasingly problematic.
There are several dimensions to the urban transport problem, most of them linked with the dominance of the automobile.
Automobile dependency
Automobile use obviously produces a variety of advantages such as performance, comfort, status, speed, and convenience. These advantages jointly illustrate why automobile ownership continues to grow worldwide, especially in urban areas. Several factors infl uence the growth of the total vehicle fl eet, such as sustained economic growth (increase in income and quality of life), complex individual urban movement patterns (many households have more than one automobile), more leisure time and suburbanization. The acute growth in the total number of vehicles also gives rise to congestion at peak traffi c hours on major thoroughfares, in business districts and often throughout the metropolitan area.
Over time, a state of automobile dependency has emerged which results in a diminution in the role of other modes, thereby limiting still further alternatives to urban mobility. Two major factors contributing to automobile dependency are:
- Underpricing and consumer choices. Most road infrastructures are subsidized as they are considered a public service. Consequently, drivers do not bear the full cost of automobile use. Like the "tragedy of the commons", when a resource is free to access (road), it tends to be overused and abused (congestion ). This is also refl ected in consumer choice, where automobile ownership is a symbol of status, freedom and prestige, especially in developing countries. Single home ownership also reinforces automobile dependency.
- Planning and investment practices. Planning and the ensuing allocation of public funds aim towards improving road and parking facilities in an ongoing attempt to avoid congestion . Other transportation alternatives tend to be disregarded. In many cases, zoning regulations impose minimum standards of road and parking services and de facto impose a regulated automobile dependency.
There are several levels of automobile dependency, with their corresponding land use patterns and alternatives to mobility. Among the most relevant indicators of automobile dependency are the level of vehicle ownership, per capita motor vehicle mileage and the proportion of total commutingtrips made using an automobile. A situation of high automobile dependency is reached when more than three-quarters of commuting trips are done using the automobile. For the United States , this proportion has remained around 88 percent over recent years. Automobile dependency is also served by a cultural and commercial system promoting the automobile as a symbol of status and personal freedom, namely through intense advertising and enticements to purchase new automobiles.
There are many alternatives to automobile dependency such as intermodality (combining the advantages of individual and collective transport), carpooling (strengthened by policy and regulation by the US government), and a range of planning initiatives discussed in Chapter 9. These alternatives, however, can only be partially executed in the absence of properly organized administrative structure and public awareness.
Congestion
Congestion occurs when transport demand exceeds transport supply in a specifi c section of the transport system. Under such circumstances, each vehicle impairs the mobility of others.
Recent decades have seen the extension of roads in rural but particularly in urban areas. Those infrastructures were designed for speed and high capacity, but the growth of urban circulation occurred at a rate higher than often expected. Investments came from diverse levels of government with a view to providing accessibility to cities and regions. There were strong incentives for the expansion of road transportation by providing high levels of transport supply. This has created a vicious circle of congestionwhich supports the construction of additional road capacity and automobile dependency. Urban congestion mainly concerns two domains of circulation, often sharing the same infrastructures:
- Passengers. In many regions of the world, incomes have signifi cantly increased to the point that one automobile per household or more is a common ownership fi gure. Access to an automobile conveys fl exibility in terms of the choice of origin, destination and travel time. The automobile is favored at the expense of other modes for most trips, notably for single occupancy commuting . For instance, automobiles account for the bulk of commuting trips in the United States .
- Freight. Several industries have shifted their reliance on trucking, increasing the usage of road infrastructure by trucks. Since cities are the main destination for freight fl ows (either for consumption or for transfer to other locations) trucking is linked with congestion in urban areas.
Infrastructure provision was not able to keep up with the growth in the number of vehicles, even more with the total number of vehicle/km. During infrastructure improvement and construction, capacity impairment (fewer available lanes, closed sections, etc.) favors congestion . Important travel delays occur when the capacity limit is reached or exceeded, which is the case for almost all metropolitan areas. In the largest cities such as London, road traffi c is actually slower than it was 100 years ago. Marginal delays are thus increasing. Large cities have become congested most of the day, and congestion is getting more acute. Another important consideration concerns parking, which consumes large amounts of space. In automobile-dependent cities, this can be very constraining as each economic activity has to provide an amount of parking space proportional to their level of activity. Parking has become a land use that greatly infl ates the demand for urban land.
Daily trips can be either "mandatory" (workplace–home) or "voluntary" (shopping, leisure, visits). The former is often performed within fi xed schedules while the latter comply with variable schedules. Mandatory trips are mainly responsible for the peaks in circulation fl ows, implying that about half the congestionin urban areas recurs at specifi c times of the day and on specifi c segments of the transport system. The other half is caused by random events such as accidents and unusual weather conditions (rain, snowstorms, etc.). As far as accidents are concerned, their randomness is infl uenced by the level of traffi c as the higher the traffi c on specifi c road segments the higher the probability of accidents. The spatial convergence of traffi c causes a surcharge of transport infrastructures up to the point where congestion can lead to the total immobilization of traffi c. Not only does the massive use of the automobile have an impact on traffi c circulation and congestion, but it also leads to a decline in public transit effi ciency when both are sharing the same roads.
The urban transit challenge
As cities continue to become more dispersed, the cost of building and operating public transportation systems increases. For instance, only about 80 large urban agglomerations have a subway system, the great majority of them being in developed countries. Furthermore, dispersed residential patterns characteristic of automobile-dependent cities makes public transportation systems less convenient for the average commuter. In many cities, additional investments in public transit did not result in signifi cant additional ridership. Unplanned and uncoordinated land development has led to rapid expansion of the urban periphery. Residents may become isolated in outlying areas without access to affordable and convenient public transportation. Over-investment (when investments do not appear to imply signifi cant benefi ts) and under-investment (when there is a substantial unmet demand) in public transit are both complex challenges.
Urban transit is often perceived as the most effi cient transportation mode for urban areas, notably large cities. However, surveys reveal a stagnation or a decline of public transit systems, especially in North America. The economic relevance of public transit is being questioned. Most urban transit developments had little, if any, impacts to alleviate congestion (Cox, 1998). This paradox is partially explained by the spatial structure of contemporary cities which are oriented to servicing the needs of the individual, not necessarily the needs of the collectivity. Thus, the automobile remains the preferred mode of urban transportation. In addition, public transit is publicly owned, implying that it is a politically motivated service that provides limited economic returns. Even in transitoriented cities such as in Europe, transit systems depend on government subsidies. Little or no competition is permitted as wages and fares are regulated, undermining any price adjustments to changes in ridership. Thus public transit has a social function ("public service") as it provides accessibility and social equity, but with limited relationships with economic activities. Among the most diffi cult challenges facing urban transit are:
- Decentralization. Public transit systems are not designed to service low density and scattered urban areas that increasingly dominate the landscape. The greater the decentralization of urban activities, the more diffi cult and expensive it becomes to serve urban areas with public transit.
- Fixity. The infrastructures of several public transit systems, notably rail and metro systems, are fi xed, while cities are dynamic entities. This implies that travel patterns tend to change and that a transit system built to service a specifi c pattern may eventually face "spatial obsolescence".
- Connectivity. Public transit systems are often independent from other modes and terminals. It is consequently diffi cult to transfer passengers from one system to another.
- Competition. In view of cheap and ubiquitous road transport systems, public transit faces strong competition. The higher the level of automobile dependency, the more inappropriate the public transit level of service. The public service being offered is simply outpaced by the convenience of the automobile.
Method 1 – Traffi c counts and traffi c surveys
Traffi c counting methods
Transport planning at all levels requires understanding of actual conditions. This involves determination of vehicle or pedestrian numbers, vehicle types, vehicle speeds, vehicle weights, as well as more substantial information such as trip length, trip purpose and trip frequency. The fi rst group of data dealing with the characteristics of vehicle or people movement is obtained by undertaking traffi c counts. Those related to measuring trips involving knowledge of origin and destination require more detailed surveys.
A wide range of counting methods are available. It is useful to distinguish between intrusive and non-intrusive methods. The former include counting systems that involve placing sensors in or on the roadbed; the latter involve remote observational techniques. In general, the intrusive methods are used most widely because of their relative ease of use and because they have been employed for decades. The only widely used nonintrusive method is manual counting, which enjoys wide application because of its ease. Intrusive methods, however, have evolved little over the last decade, but in the USA, with federal transport policy emphasis on IT solutions to traffi c management, progress is being made in the development of non-intrusive methods.
Intrusive methods include:
- Bending plate. A weight pad is attached to a metal plate embedded in the road to measure axle weight and speed. It is an expensive device and requires alteration to the road ed.
- Pneumatic road tube. A rubber tube is placed across the lanes and uses pressure changes to record the number of axle movements in a counter placed on the side of the road. The drawback is that it has limited lane coverage, may become displaced, and can be dislodged by snow ploughs.
- Piezo-electric sensor. A device is placed in a groove cut into the roadbed of the lane(s) being counted. This electronic counter can be used to measure weight and speed. Cutting into the roadbed can affect the integrity of the roadbed and decrease the life of the pavement.
- Inductive loop. A wire is embedded in the road in a square formation which creates a magnetic fi eld that relays the information to a counting device at the side of the road. This has a generally short life expectancy because it can be damaged by heavy vehicles, and is also prone to installation errors.
Non-intrusive methods include:
- Manual observation. A traditional method which involves placing observers at specifi c locations to record vehicle or pedestrian movements. At its simplest, observers use tally sheets to record numbers; on the other hand mechanical and electronic counting boards are available that the observer can punch in each time an event is observed. Traffi c numbers, type and directions of travel can be recorded. Manual counts give rise to safety concerns, either from the traffi c itself or the neighborhoods where the counts are being undertaken.
- Passive and active infra-red. A sensor detects the presence, speed and type of vehicles by measuring infra-red energy radiating from the detection area. Typically the devices are mounted overhead on a bridge or pylon. The major limitation is the performance during inclement weather, and limited lane coverage.
- Passive magnetic. Magnetic sensors that count vehicle numbers, speed, and type are placed under or on top of the roadbed. In operating conditions the sensors have diffi culty differentiating between closely spaced vehicles.
- Microwave-doppler/radar. Mounted overhead, the devices record moving vehicles and speed. With the exception of radar devices, they have diffi culty in detecting closely spaced vehicles and do not detect stationary vehicles. They are not affected by weather.
- Ultrasonic and passive acoustic. The devices use sound waves or sound energy to detect vehicles. Those using ultrasound are placed overhead to record vehicle presence but can be affected by temperature and turbulence; the acoustic devices are placed alongside the road and can detect numbers and vehicle type.
- Video image detection. Overhead video cameras record vehicle numbers, type and speed. Various software is available to analyze the video images. Weather may limit accuracy.
A recent study which examined the use of the various traffi c count methods by State Departments of Transport in the USA found that less than half use any non-intrusive techniques. Part of the reason is the level of technical expertise required to operate the devices. Inductive loops are in use in all states, with very high levels of use (> 90 percent) for pneumatic rubber tubes and piezo-electronic road sensors. Manual counts were used by 82 percent of the states. In terms of satisfaction with the methods, manual counts and inductive loops were rated highest. Despite the poor acceptance of the non-intrusive devices, their cost-effectiveness was shown to be higher than the inductive loops. This suggests that the newer devices may gain wider use once their cost-effectiveness becomes more widely appreciated.
Surveys
Traffi c counts may provide some precise information about numbers of vehicles, their type, weight or speed, but they cannot provide other data that are essential in transport planning , such as trip purpose, routing, duration, etc. Collecting these data requires more extensive survey instruments. These instruments include:
- Mailed questionnaires. These can include a wide range of questions; are relatively cheap to administer to large numbers of people, although preparation can be expensive. The main problem is the generally low response rate.
- Travel diaries. Respondents are asked to keep a diary of the trips undertaken, times, purposes, modes, etc. An extremely useful instrument constrained largely by the number of people willing to complete such a detailed inventory.
- Telephone surveys. With automated dialing this can achieve extensive coverage, but response rates are usually low.
- Face-to-face home interviews. These can overcome many of the errors based on mis understanding of questions in mail surveys, but are extremely time-consuming and costly.
Extensive traffi c surveys began to be developed in the 1950s. One of the earliest was the Chicago Area Transportation Study (CATS), undertaken in 1956, providing detailed O/D data on trip length, purposes, modes of travel, and travel patterns. This was followed in 1960 with the US Census's fi rst attempt to collect journey to work (JTW) travel data in urban areas. Other metropolitan areas in the USA and Canada , including Detroit and Toronto, copied and extended the scope of these surveys in the 1960s. The growth of surveys was encouraged by the results which provided the fi rst comprehensive snapshots of urban travel activities in a society rapidly adopting the automobile and undertaking new types of travel behavior. This was a boon to transport planning . Furthermore, much of the academic understanding of travel activity in cities has been drawn from these surveys. Since then national censuses in many countries have included travel surveys in their decennial inventories, and many planning agencies update and extend the results from the national surveys with local investigations (see below).
All survey techniques represent a compromise between the objectives of the survey, the resources available, the coverage that is feasible, and the amount of data to be collected. The surveys instrument(s) that are employed depend largely on the resources available. Even national agencies fi nd the costs of conducting national surveys are onerous. For example, it is estimated that the next daily trip survey to be undertaken in 2007 by the National Household Transport Survey (NHTS) in the USA will cost \$14 million. The mail-back questionnaire is very common. CATS, for example, uses a questionnaire along with a travel diary, which involves sending out a letter of introduction to selected households, distributing the questionnaire and instructions, mailing out reminder letters, and a telephone follow-up to selected individuals to verify their information. The NHTS will be based on a national telephone survey.
The degree of detail required in most travel surveys means that even the largest agencies have to rely on sampling. It is usual to target households rather than
individuals, since the household is a good predictor of travel behavior. Fixing the size of the sample is an extremely important issue. Sample size determines the degree of reliability of the results, but these have to be conditioned by the resources available and the survey instruments to be employed. In its household surveys, CATS determined that 400 completed household responses would be suffi cient to provide a statistically signifi cant sample for each of the geographic units, and because it expected a 20 percent rate of response, it could plan for the distribution of 2,000 questionnaires in each zone. A clustered random sample of approximately 2,000 addresses in each zone was taken. For national surveys in the USA, samples of 26,000 households are sought. Because national surveys may not provide a suffi ciently reliable or detailed set of data for the needs of individual states or planning agencies, these agencies frequently "back-on" additional counts in their areas when national surveys are undertaken.
Problems of traffi c surveys
The major issues concerning traffi c surveys involve:
- Comparability between surveys. It is usually very important to compare survey results over time. This is frequently very diffi cult because of different sample sizes, different questions, different response rates, and different geographical collection units. These are usually major problems for studies trying to compare the results from different agencies.
- Non-response bias. There are signifi cant variations in the response rates achieved by surveys. The larger the non-response rate, the less reliable will be the results. A 60 percent response rate is sometimes considered as a threshold. Many surveys fail to achieve high rates of response; for example, the 2001 NHTS survey only achieved 41 percent.
- Coverage bias. The survey instruments frequently contain hidden biases. For example, automatic telephone surveys exclude cell phone users and those without a land line connection.
- Unreporting of trips. Research is now showing that surveys and travel diaries may be undercounting trips made. Some test surveys are using GPS devices to record trips and indicate that in the Kansas City survey 10 percent of trips were unreported and in the case of Laredo the fi gure was as high as 60 percent.
Method 2 – Transportation/land use modeling
Types of models
To gain a better understanding of the behavior of urban areas, several operational transportation/land usemodels (TLUM) have been developed. The reasons behind using TLUM are numerous, including the ability to forecast future urban patterns or to evaluate the potential impacts of legislation pertaining to environmental standards. Other uses of TLUM relate to testing theories and practices about urban systems. With a simulation model, urban theories can be evaluated and the impacts of policy measures, such as growth management and congestion pricing, can be measured. It is not surprising that since TLUM are planning tools per se, their development and application has mainly been done by various government agencies related to transportation and the environment.
Broadly, a model is an information construct used to represent and process relationships between a set of concepts, ideas, and beliefs. Models have a language, commonly mathematics, an intended use and a correspondence to reality. There are four levels of complexity related to the modeling of transportation/land use relationships:
- Static modeling. Expresses the state of a system at a given point in time through the classifi cation and arithmetic manipulation of representative variables. Measuring accessibility can be considered as static modeling.
- System modeling. Expresses the behavior of a system with a given set of relationships between variables. The gravity model is an example of system modeling as it tries to evaluate the generation and attraction of movements.
- Modeling interactions between systems. Tries to integrate several models to form a meta-system (a large and complex system). A transportation/land use model offers such a perspective.
- Modeling in a decision-taking environment. This implies not only the application of a transportation/land use model, but also the analysis and reporting of its results in order to fi nd strategies and recommendations. Geographic Information Systems are useful tools for this purpose.
To provide a comprehensive modeling framework, all these models must share information to form an integrated transportation/land use model. For instance, a land use model can calculate traffi c generation and attraction, which can be inputted to a spatial interactionmodel. The origin–destination matrix provided by a spatial interaction model can be inputted to a traffi c assignment model, resulting in fl ows on the transportation network. On average, models tend to be relevant for constrained and well-structured problems with a specifi ed number of variables, well-defi ned goals, and fi rmly established technical solutions. This in itself limits signifi cantly the applicability of TLUM.
Four-stage transportation/land use modeling
Most TLUM have been applied regionally, mainly at the urban level, as a larger scale would be prohibitively complex to model. Most of the modeling is divided into four stages for the estimation of travel demand, from where movements originate, how they are allocated, what modes are used and fi nally what segments of the transport network are being used (Figure 7.16):
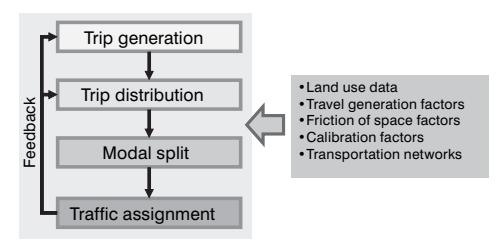
Figure 7.16 Four-stage transportation/land use model
- The fi rst stage is called trip generation and deals with trip rate estimates, usually at the zonal level. The most common methods for trip generation are cross-classifi cation (also referred to as category analysis) and multiple regression analysis.
- The second stage is referred to as trip distribution and deals with spatial movement patterns: the links between trip origins and destinations. The most common technique for estimating trip distribution is the gravity model . There are various forms of the gravity model and various calibration techniques.
- The third stage is modal split: the proportion of trips made by automobile drivers and passengers, transit patrons, cyclists, and walkers. Logit modeling is commonly used as it evaluates the preference of each user.
- Finally, once the spatial patterns of movements by various modes are estimated, trips are assigned to the various road links. This is done mostly by using operations research methods aimed at minimizing travel costs or time over a transport network .
This procedure is consequently iterative and converges to a solution, often measured as the minimal transportation cost considering a given travel demand and the characteristics of the existing transportation network . It relies on an extensive array of data.
Data requirements
Applying TLUM obviously requires an extensive range of data, most of it related to spatial divisions, land use , spatial interaction s and the transportation network. Data availability and limitation is an important factor behind the applicability of such models and there is a constant trade-off between the costs of fulfi lling the data requirements and the benefi ts supplementary data may offer. This is the major reason why the transportation/land use modeling process, although theoretically and conceptually sound, has not been applied comprehensively. Among the major types of variables, it is possible to identify:
- Land use data. These include socio-economic variables pertaining to the area under investigation, such as population, employment, income level, commercial activity, etc. Such data are used to estimate or calibrate the amount of travel generated and attracted by each zone.
- Travel generation factors. Considering the available land usedata, these factors estimate the number of trips, people and/or freight, that each level of economic activity generates. They consider a multitude of issues such as income, modal preferences and consumption levels. Most of this information can be gathered using surveys or inferred from observations made elsewhere.
- Friction of space factors. These represent the diffi culty of traveling between different parts of the area under investigation, commonly measured in terms of time, distance or cost. There is a signifi cant variance according to mode and purpose of travel. Friction of distance factors enable to assess trip distribution and modal split .
- Calibration factors. It is uncommon for the results produced by an uncalibrated model to correspond to the reality. Calibration factors thus try to match the results produced by the model with data based on observations, surveys or common sense. Calibration can often be an obscure process, because it tries to incorporate factors that are not explained by the model itself.
- Transportation networks. A representation of the structure and geometry of transportation within the area under investigation, mainly composed of nodes and links. Transportation networks are commonly divided by modes. For road transportation, a node could represent an intersection, a stop or a parking lot, while
a segment could be linked with attributes such as permitted speed, distance and capacity. For public transit, a node could represent a bus stop or a metro station, while a segment could have attributes such as capacity and frequency of service. Transportation networks, along with origin–destination matrices, are fundamental elements of the traffi c assignment procedure.
Major models
There are a wide variety of TLUM, most of them developed during the quantitative revolution that transformed geography in the 1960s and 1970s. Among the best known are:
- Lowry model. Considered to be the fi rst transportation/land usemodel (1964), it links two spatial interaction components. The fi rst calculates spatial interactions between basic employment activities and zones of residence, while the second calculates spatial interactions between service employment activities and zones of residence (Figure 7.17). The core of the model is exogenous, derived from a regional economic model, where the location of basic (industrial) employment is inputted.
- ITLUP. The Integrated Transportation and Land Use Package is composed of a residential allocation model, an employment allocation model, and a travel demand model.
- MEPLAN. This model is a derivative of the Lowry model, since it is based on the economic base theory. It considers the two components of the transportation/land use system as markets, one market for land use and one market for transportation.
The core of most transportation/land usemodels is some kind of regional economic forecast that predicts and assigns the location of the basic employment sector. As such, they are dependent on the reliability and accuracy of macro- and micro-economic forecasting.
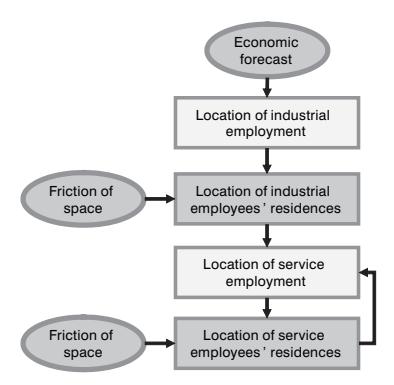
Figure 7.17 Lowry-type transportation/land use model
Bibliography
Abraham, J. (1998) Review of the MEPLAN Modelling Framework from a Perspective of Urban Economics, Civil Engineering Research Report CE98–2, University of Calgary, http://www.acs. ucalgary.ca/~jabraham/MEPLAN_and_Urban_Economics.PDF.
Barry, M. (1991) Through the Cities: The Revolution in Light Rail Transit, Dublin: Frankfort Press.
BTS (2001), Special Issue on Methodological Issues in Accessibility, Journal of Transportation and Statistics, 4(2/3), Bureau of Transportation Statistics (http://www.bts.gov), Sept/Dec.
Carter, H. (1995) The Study of Urban Geography, 4th edn, London: Arnold.
Cervero, R. (1998) The Transit Metropolis: A Global Inquiry, Washington, DC: Island Press.
Cox, W. (1998) "Light Rail in Minneapolis: A Bridge to Nowhere", The Public Purpose, Urban Transport Fact Book. http://www.publicpurpose.com/ut-mspsp.htm.
Dimitriou, H. (1993) Urban Transport Planning, New York: Routledge.
Environmental Protection Agency (1997) Evaluation of Modeling Tools for Assessing Land Use Policies and Strategies, EPA420-R-97-007, Ann Arbor, MI: EPA.
Ewing, R. (1993) "Transportation Service Standards – As If People Matter", Transportation Research Record, 1400 (www.trb.org), pp. 10–17.
FDOT (2002) Quality/Level of Service Handbook, Florida Department of Transportation, http://www11. myfl orida.com/planning/systems/sm/los/default.htm.
Foot, D. (1996) Boom, Bust, and Echo: How to Profi t from the Coming Demographic Shift, Toronto: MacFarlane Walter and Ross.
Gwilliam, K. (ed) (2001) Cities on the Move: A World Bank Urban Transport Strategy Review, Strategy Paper, Washington, DC: World Bank. http://wbln0018.worldbank.org/transport/utsr.nsf.
Hanson, S. (ed) (1995) The Geography of Urban Transportation, 2nd edn, New York: Guilford.
Harvey, J. (1996) Urban Land Economics, Basingstoke: Macmillan.
Hugill, P.J. (1993) World Trade Since 1431, Baltimore, MD: The Johns Hopkins University Press.
Isard, W. (1956) Location and Space–Economy, Cambridge, MA: MIT Press.
Kenworthy, J. and E.F.B. Laube (2001) The Millennium Cities Database for Sustainable Transport, Perth, Australia: International Union (Association) of Public Transport, Brussels, Belgium and ISTP (CD-ROM publication).
Litman, T. (2001) "What's It Worth? Life Cycle and Benefi t/Cost Analysis for Evaluating Economic Value", Presented at Internet Symposium on Benefi t-Cost Analysis, Transportation Association of Canada (www.tac-atc.ca), available at VTPI (www.vtpi.org).
Litman, T. (2002) Evaluating Transportation Land Use Impacts, Victoria Transport Policy Institute, http://www.vtpi.org/landuse.pdf.
Moore, T. and P. Thorsnes (1994) The Transportation/Land Use Connection, Planning Advisory Service Report 448/449, Washington, DC: American Planning Association (www.planning.org).
Muller, P.O. (1995) "Transportation and Urban Form: Stages in the Spatial Evolution of the American Metropolis", in Hanson, S. (ed.) The Geography of Urban Transportation, 2nd edn, New York: Guilford, pp. 26–52.
Newman, P. and J. Kenworthy (1996) "The Land Use–Transport Connection", Land Use Policy, 1, 1– 12.
Newman, P. and J. Kenworthy (1999) Sustainability and Cities: Overcoming Automobile Dependence, Washington, DC: Island Press.
Rietveld, P. (2000), "Nonmotorized Modes in Transport Systems: A Multimodal Chain Perspective for The Netherlands", Transportation Research D, 5(1), 31–6.
Schafer, A. (2000) "Regularities in Travel Demand: An International Perspective", Journal of Transport Statistics, 3(3), http://www.bts.gov/jts/V3N3/schafer.pdf.
Skszek S. (2001) "State of the Art" on non-Traditional Traffi c Counting Methods, Arizona Department of Transportation, Report FHWA-AZ-01-503.
Stutz, R. and A. de Souza (1998) The World Economy: Resources, Location, Trade and Development, 3rd edn, Toronto: Prentice Hall.
- Texas Transportation Institute (2002) The 2003 Urban Mobility Study, College Station, TX. http:// mobility.tamu.edu/.
- Thomson, J.M. (1977) Great Cities and Their Traffi c, London: Victor Gollancz.
- Torrens, P.M. (2000) How Land Use Transportation Models Work, Working Paper 20, Centre for Advanced Spatial Analysis, University College London, http://www.casa.ucl.ac.uk/how_lutms_ work.pdf.
- Transportation Research Board (1994), Highway Capacity Manual, Special Report 209, Transportation Research Board (www.trb.org).
- Transportation Research Board (2005) Data for Understanding Our Nation's Travel, Transportation Research Circular, E-CO71.
- Victoria Transport Policy Institute (2002) "Automobile Dependency", Transport Demand Management Encyclopedia, http://www.vtpi.org/tdm/tdm100.htm.
8 Transport and environment 8
Until the 1990s, environmental concern played a small role in transport infrastructure planning and operations. This situation has changed. The future of the transport industry is likely to be compromised without an understanding of environmental sustainability. The opportunities to participate in the sustainable development of transportation are likely to be manifold in the future. Paradoxically, geographers' capacity for understanding the rapidly changing environment has not been growing at the same pace as the provision of a knowledge base which the transport industry requires. Thus, there is a pressing need to re-equip a new generation of transport geographers with the necessary skills to apply sustainability issues to transportation. Three concepts are at the heart of the relationship between transport and the environment: transport and energy , the reciprocal infl uence of transport and the physical environment, and sustainable transport .
Concept 1 – Transport and energy
Energy
Human activities are closely dependent on the use of several forms and sources of energy to perform work. Energy is the potential that allows movement and/or modifi cation of matter (Attali, 1975). Energy content is the available energy per unit of weight or volume from an energy source. Thus, the more energy consumed the greater the amount of work realized. Wood, coal, petroleum oils, and natural gas are fossil fuels, whereas human and animal power, wind and water power, and solar radiation are actual sources of energy. There are enormous reserves of energy able to meet the future needs of mankind. Unfortunately, one of the main contemporary issues is that many of these reserves cannot be exploited at reasonable costs or are unevenly distributed around the world. From the earliest times, man's choice of energy source has depended on a number of utility factors. Since the industrial revolution, man has used fuels to provide steam power and electrical power. This has considerably improved industrial productivity by having as much work as possible performed by machines. The development of the steam engine and the generation and distribution of electric energy over considerable distances have also altered the spatial pattern of manufacturing industries by liberating production from direct connection to a fi xed power system. Industrial development generates enormous demands for fossil fuels. At the turn of the twentieth century, the invention and commercial development of the internal combustion engine, notably in transport equipment, made possible the effi cient movement of people, freight and information and stimulated the development of a global trade network. With globalization, transportation is accounting for a growing share of the total amount of energy spent for implementing, operating and maintaining the international range and scope of human activities. At the beginning of the twenty-fi rst century, despite growing supply and pricing uncertainties, fossil fuels, notably petroleum, remain the world's chief sources of energy with a production level estimated at 85 million barrels per day. Out of the world's power consumption of about 12 trillion watts a year, 85 percent is derived from fossil fuels.
Transportation and energy consumption
Energy consumption has become a major focus of the global economy . A strong correlation exists between energy consumption and level of economic development. Historically, high per capita energy consumption is associated with high income, relatively low energy prices and the need to move people, commodities and information. Among developed countries, transportation now accounts for 20–25 percent of all the energy being consumed. With less than 5 percent of the world's population, the United States consumes approximately 65 percent of all the transportation energy among G8 countries. The increasing motorization and the concomitant rise in land and air traffi c in countries such as China and Russia are stimulating growth in all aspects of the transportation industry.
The impact of transport on energyconsumption is diverse, including many factors necessary for the provision of transport facilities:
- Vehicle manufacture, maintenance and disposal. The energyspent for manufacturing and recycling vehicles is a direct function of vehicle complexity, material used, fl eet size and vehicle life cycle.
- Vehicle operation. Mainly involves the energy used to provide power for vehicles.
- Transportation infrastructure construction and maintenance. The building of roads, railways, bridges, tunnels, terminals, ports and airports and the provision of lighting and signaling equipment require a substantial amount or energy . They have a direct relationship with vehicle operations since extensive networks are associated with large amounts of traffi c.
- Administration of transport business. The expenses involved in planning, developing and managing transport infrastructures and operations involves time, capital and skill that must be included in the total energy consumed by the transport sector.
- Energy production and trade. The processes of exploring, extracting, refi ning and distributing fuels or generating and transmitting energy also require power sources. Any changes in transport energy demands infl uence the pattern and fl ows of the world energy market.
This close relationship between transport and energy is subject to different interpretations. As a generalization, it is possible to compare the costs of hauling passengers or commodities by ships, rail, roads, and air by expressing their costs to a common unit such as energy use per unit of transport production. Such comparison must be handled with care however as the actual passenger or ton-kilometers cost of an individual transport operation is infl uenced by a variety of factors such as distance, route characteristics, load factors, cargo value or value of service, rate structures, terminal charges, etc. Further, in these comparisons note has to be taken of the fuel effi ciency, congestion level and environmental externalities .
• Land transportation accounts for the great majority of energy consumption. Road transportation alone consumes on average 85 percent of the total energy used by the transport sector in developed countries. Fuel costs for the North American trucking industry account for a third of its expenses. In land transport, road is the mode mainly responsible for additional energy demands over the last 25 years because its market
share of freight and passenger transport has increased. Despite a falling market share, railtransport, on the basis of 1 kg of oilequivalent, remains four times more effi cient for passenger movement and twice as effi cient for freight as road transport (Bonnafous and Raux, 2003).
- Maritime transportation accounts for 80 percent of world trade by volume (UNCTAD, 2003). The nature of water transport and its economies of scale make it the most energyeffi cient mode. This mode uses approximately 3–5 percent of all the energy consumed by transport activities.
- Air transportation plays an integral part in the globalization of the transportation network. The aviation industry accounts for about 5 percent of the energyconsumed by transportation. Air transport has high energy consumption levels, linked to high speeds. Fuel is the second most important budget for the air transport industry accounting for 13–20 percent of total expenses (Vellas, 1991).
Further distinctions in the energyconsumption of transport can be made between passenger and freight movement:
- Passenger transportation accounts for 60–70 percent of energyconsumption from transportation activities. The private car is the dominant mode. There is a close relationship between rising income, automobile ownership and distance traveled by vehicle. The United States has one of the highest levels of car ownership in the world with 488 cars per 1,000 persons in 1999. About 60 percent of all American households owned two or more cars, with 19 percent owning three or more. A more disturbing trend has been the increasing rise in ownership of minivans, sport utility vehicles and light-duty trucks for personal use and the corresponding decline in fuel economy (Schipper and Fulton, 2003).
- Freight transportation is dominated by rail and shipping, the two most energy effi cient modes. Coastal and inland waterways provide an energy effi cient method of transporting passengers and cargoes. A tow boat moving a typical 15-barge tow holds the equivalent of 225 rail car loads or 870 truck loads. The grounds for favoring coastal and inland navigation are also based on lower energy consumption rates of shipping and the general overall smaller externalities of water transportation. The United States Marine Transportation System National Advisory Council has measured the distance that one ton of cargo can be moved with 3.785 liters of fuel. A tow boat operating on the inland waterways can move one ton of barge cargo 857 kilometers. The same amount of fuel will move one ton of rail cargo 337 kilometers or one ton of highway cargo 98 kilometers (MTSNAC, 2001).
A powerful trend that emerged in the 1950s is the growing share of transportation in the total oil consumption of developed countries. It now accounts for more than 55 percent of all the oil used each year. Transportation is almost completely reliant (95 percent) upon petroleum products (Lenzen, Dey and Hamilton, 2003). While the use of petroleum products from other economic sectors, such as industrial and electricity generation, has remained relatively stable, the growth in oil demand is mainly attributed to the growth in transportation demand.
Transportation and alternative fuels
All other things being equal, the energywith the lowest cost will always be sought. The dominance of petroleumfuels is a result of the relative simplicity with which they can be stored and effi ciently used in internal combustion engine vehicles. The transportation sector is heavily dependent on the use of petroleum fuels. Other fossil fuels (natural gas, propane, and methanol) can be used as transportation fuels but require a more complicated storage system. The main issue concerning the large-scale uses of these alternative vehicle fuels is the large capital investments required in distribution facilities as compared with conventional fuels. Another issue is that in terms of energy density, these alternative fuels have lower effi ciency than gasoline and thus require a greater volume of on-board storage to cover the equivalent distance as a gasoline propelled vehicle.
Alternative fuels in the form of non-crude oil resources are drawing considerable attention as a result of shrinking oil reserves, increasing petroleum costs and the need to reduce pollutant emissions. Biogas such as ethanol and biodiesel can be produced from the fermentation of energy crops (sugar cane, corn, cereals, etc.). Their production however requires large harvesting areas that may compete with other types of land use. Besides, it is estimated that one hectare of wheat produces less than 1,000 liters of transportation fuel per year which represents the amount of fuel consumed by one passenger car traveling 10,000 kilometers per year. This limit is related to the capacity of plants to absorb solar energy and transform it through photosynthesis. This low productivity of the biomass does not meet the energy needs of the transportation sector.
Hydrogen is often mentioned as the energysource of the future. Hydrogen is produced by the electrolysis of water forming natural gas, or oxidation and steam forming other fossil fuels (Khare and Sharma, 2003). Hydrogen fuel cells are two times more effi cient than gasoline. But hydrogen suffers from several problems. A lot of energy is wasted in the production, transfer and storage of hydrogen. Hydrogen manufacturing requires electricity production. A hydrogen-powered vehicle requires 2–4 times more energy for operation than an electric car which does not make it cost-effective. Besides, hydrogen is highly infl ammable and diffi cult to store.
Electricity is being considered as an alternative to petroleum fuels as an energy source. The main barrier to the development of electric cars is the lack of storage systems capable of providing driving ranges and speeds comparable to those of conventional vehicles. An electric car has a maximum range of 100 kilometers and speed of less than 100 kph, requiring 4–8 hours to recharge (Sperling, 2003). The recent development of hybrid vehicles (internal combustion engine and batteries) provides interesting opportunities, combining the effi ciency of electricity with a long driving range.
The extent to which conventional non-renewable fossil fuels will continue to be the primary resources for nearly all transportation fuels is subject to debate. Some studies estimate global resources for oil at about a trillion barrels. This represents 30 years of reserves at the present rate of consumption. But the gap between demand and supply, once considerable, is narrowing. The steady surge in demand from Chinaand India requires a further output of 2–3 million barrels a day. This raises concerns about the capacity of major oil producers to meet this rising world demand. The producers are not running out of oil, but the existing reservoirs may not be capable of producing on a daily basis the increasing volumes of oil that the world requires. Reservoirs do not exist as underground lakes from which oil can easily be extracted. There are geological limits to the output of existing fi elds. This suggests that an additional 4–5 million barrels a day need to be found to compensate for the declining production of existing fi elds. Additional reserves in Alaska, off-shore West Africa and the Caspian Sea basin are not enough to offset this growing demand (Mass, 2005).
Other studies argue that the history of the oil industry is marked by cycles of shortages and surpluses (Johansson, 2003). The rising price of oil will render cost-effective oil recovery in diffi cult areas. Deep water drilling or extraction from tar sands should
increase the supply of oil that can be recovered and extracted from the surface. But there is a limit to the capacity of technological innovation to fi nd and extract more oil around the world. Technological development does not keep pace with surging demand. The construction of drilling rigs, power plants, refi neries and pipelines designed to increase oil exploitation is a complex and slow process. The main concern is the amount of oil that can be pumped to the surface on a daily basis.
The penetration of non-fossil fuels in the transportation sector has serious limitations. As a result, the price of oilwill certainly continue to increase as more expensive fuelrecovery technologies will have to be utilized with the soaring demand for gasoline. But high oil prices are infl ationary, leading to recession in economic activity and the search for alternative sources of energy . Already, the peaking of conventional oil production is leading to the implementation of coal-derived oil projects. Coal liquefaction technology allows the transformation of coal into refi ned oil after a series of processes in an environment of high temperature and high pressure. While the cost-effectiveness of this technique has yet to be demonstrated, coal liquefaction is an important measure in the implementation of transportation fuel strategies in coal-rich countries, such as China .
The costs of alternative energy sources to fossil fuels are higher in the transportation sector than in other types of economic activities. This suggests higher competitive advantages for the industrial, household, commercial, electricity and heat sectors to shift away from oiland to rely on solar, wind or hydro-power. Transportation fuels based on renewable energy sources might not be competitive with petroleum fuels unless future price increases are affected by different fuel taxes based on environmental impacts.
Concept 2 – Transport and environment
The relationships between transport and the environment are complex. In this section the relationships are explored by fi rst briefl y considering the impacts of the environment on transport and then by reviewing the impacts of transport on the environment. It is clear that over time the impacts of transport on the environment have been increasing, and this brings into question how the relationships may be better managed.
The impacts of the environment on transport
The environment has always played a constraining effect on the mobility of people and goods (Barke, 1986). The main elements are physical distance, topography, hydrology, climate and natural hazards.
- Physical distance has had a paramount effect limiting spatial interactions. The cost of overcoming the friction of distance is one of the most important features of transport geography (see Chapter 1). As has been discussed elsewhere, human progress has been marked by technological developments in transport that have shrunk distance barriers, while never completely overcoming them, except for telecommunications.
- Topography continues to play an important role in shaping transportation. Several transport modes, such as rail and canals, are still very constrained by slopes, and while other land modes, such as roads and pipelines, have the capacity to adjust to gradients, their routings are infl uenced by topography. Transport systems seek the paths of least resistance, and for this reason valleys and plains usually have the most dense networks. Topography also infl uences water transport, since the confi guration of river basins may or may not coincide with trade fl ows; and port sites may not be
available where needed. Historically, mountains and deserts have served as barriers to interaction, serving to isolate regions.
- Hydrology has a particular effect on water transport. The depth of channels may not be adequate to support the size of vessels required. Fluctuations in water levels because of seasonality may interrupt navigation. Tidal conditions infl uence access to ports and impede loading operations in ports where the tidal ranges are large. Land transport modes may also be infl uenced by hydrological conditions. Rivers and estuaries may serve as barriers to interactions between the different shores, requiring transfers to ferries or necessitating long detours to bridgeheads. Permafrost makes construction of routes and transport infrastructures extremely diffi cult in arctic and sub-arctic regions.
- Climate affects transport systems in both direct and subtle ways. In the days of sailing ships, trade patterns were dictated by prevailing winds. Among many examples, there was the triangular trade between Europe, Africa and the Americas during the seventeenth to nineteenth centuries. Contemporary air travel is very much infl uenced by the air circulation of the upper atmosphere. Winter conditions, particularly the freezing of water bodies, such as the St. Lawrence Seaway and the Baltic Sea, interrupt regular shipments. Climate also has many more subtle impacts that are of shorter duration. Snow, fog, wind and rain events may cause delays and disruptions. Air transport is particularly prone to such impacts, although other modes may also be affected by such events.
- Natural hazards have the potential to impact greatly on transport systems, as indeed they affect all human activities. Geological events such as earthquakes, tsunamis, and volcanic eruptions can be catastrophic in their human impacts and along with more localized occurrences such as landslides affect the operations of all modes. The 1995 Kobe earthquake in Japan brought about such a disruption to the port that shipping lines transferred their business to other ports, and Kobe has still not recovered this lost business. Hurricanes and tornadoes have the power to at least disrupt activities and at worse to destroy infrastructures. Exceptional rain storms can produce fl ooding, and because transport routes tend to follow low-level paths, severe dislocations to transport systems can occur. Freezing rain events are particularly disruptive, with the 1998 ice storm in the St. Lawrence Valley in Eastern Canada bringing the entire region to a halt for two weeks. In 2005, Hurricane Katrina led to the closure of the port of New Orleans, the main transit for United States grain export.
Overcoming the environment
Rapid scientifi c and technological developments have and continue to permit to overcome the environment (Vance, 1990). Before the Middle Ages, road locations were adapted to topography. Since then, efforts have been made to pave roads, bridge rivers and cut paths over mountain passes. Engineering measures such as arches and vaults used in Byzantine and Gothic church constructions in the twelfth century permitted bridge building across wide streams or deep river valleys. Road building has been at the core of technological efforts to overcome the environment. Roads have always been the support for local and even long-distance travel. From the efforts to mechanize individual transport to the development of integrated highways, road building has transformed the environment (Rubenstein, 2004). Land transportation was further facilitated with the development of technical solutions for preventing temporary interruptions in road transport provision through routeway protection. In the late twentieth century, the development of road transport and the growth in just-in-time and door-to-door services
have increased engineering demands for constructing multi-level and high-speed highways.
Innovations in maritime transportcan be found around the world. The earliest developments came in the transformation of waterways for transportation purposes through the development of canal locks. Adverse natural gradients in inland waterways can be overcome through the use of locks. Further improvements in navigation came with the cutting of artifi cial waterways. Some of the earliest examples can be found in the Dutch canals, the Martesana canals of Lombardy, the Canal de Briare in France or the Imperial Canal of China . Further improvements in navigation technology and the nature of ships permitted to increase the speed, range and capacity of ocean transport. But the increasing size of ships has resulted in excluding canals such as Panama and Suez from servicing the largest, modern and effi cient world maritime carriers. Several canal authorities have thus embarked on expansion programs that have severe environmental consequences. Increasing attention has also been paid to creating new passages between semi-enclosed seas. In Canada and Russia , the growing competition between the sea and land corridors is not only reducing tariffs and encouraging international trade but prompting the governments to reassess traditional ocean connections. Passages through the Arctic Ocean are being investigated with a view to creating new international connections. Artifi cial islands are also being created with a view to permit port installations in deep waters. In China, it had become clear that dredgingthe Yangzi River Delta was insuffi cient to insure the competitiveness of the port of Shanghai (Comtois and Rimmer, 2004). The development of a new port site in Hangzhou Bay and the modifi cation of the Yangshan islands landscape have become necessary.
As level ground over long distances is important for increasing the effi ciency of railway routes, the transport industry has modifi ed the Earth's features by building bridges and tunneling, by embanking and drainage. From medieval Germany to France's high-speed TGV , increasing motive power has permitted physical obstacles to be overcome.
The role of technology has been determinant in the development of the air transport sector (Leinbach and Bowen, 2004). From the experiments of the Montgolfi er brothers to the advent of jet aircraft, aerial crossing of rugged terrain over considerable distances became possible. Technical innovation in the aeronautic industry has permitted planes to avoid adverse atmospheric conditions, improve speed, increase stage length and raise carrying capacity. With the rapid rise in air passenger and freight transport, emphasis has been given to the construction of airport terminals and runways. As airports occupy large areas, their environmental imprint is important. The construction of Chep Lap Kok airport in Hong Kong led to leveling mountainous land for the airport site. Kansai airport in Osaka has been built on an artifi cial island.
Environmental conditions can complicate, postpone or prevent the activities of the transport industry. Technological developments have permitted to overcome the obstacles of the physical environment. The physical relief had to accept changes. These changes are generating costs. Environments have been transformed, destroyed or even artifi cially created to such an extent that it is extremely diffi cult to identify a pristine reference. More importantly, transport operations, freight and passenger movements, maintenance activities and the construction of equipment, have led to major environmental impacts.
The impacts of transport on the environment
The issue of transportation and the environment is paradoxical in nature. Transportation activities support increasing mobility demands for passengers and freight, notably in urban areas. But transport activities have resulted in growing levels of motorization and congestion. As a result, the transportation sector is becoming increasingly linked to environmental problems (OECD, 1988). The most important impacts of transport on the environment relate to climate change, air quality, noise, water quality, soil quality, biodiversity and land take.
- Climate change. The activities of the transport industry release several million tons of pollutants each year into the atmosphere. These include the emission of lead (Pb), carbon monoxide (CO), carbon dioxide (CO2 ), methane (CH4 ), nitrogen oxides (NOx ), nitrous oxide (N2 O), chlorofl uorocarbons (CFCs), perfl uorocarbons (PFCs), silicon tetrafl ouride (SF6 ), benzene and volatile components (BTX), heavy metals (zinc, chrome, copper and cadmium) and particulate matters (ash, dust). Numerous scientifi c studies attest that transportation contributes to climate change (Lenzen, Dey and Hamilton, 2003). Concentrations of CO2 , CH4 and N2 O from combustion of fuels in vehicles are the main producers of greenhouse gases. The road transport sector is responsible for 74 percent of global CO2 emissions, while aviation, shipping and railways account for 12 percent, 10 percent and 4 percent respectively. These greenhouse gases prevent electromagnetic radiation from leaving the Earth's surface and thus contribute to global warming. This is leading to an increase in the average temperature at the Earth's surface, reducing snow cover of polar regions, which in turn is contributing to sea level rise and an increase in ocean heat content. Some of these gases also participate in depleting the stratospheric ozone (O3 ) layer which naturally screens the Earth's surface from ultraviolet radiation.
- Air quality. Highway vehicles, marine engines, locomotives and aircraft are sources of pollution in the form of gas and particulate matter emissions that affect air quality, causing damage to human health (Holmen and Niemeier, 2003). Toxic air pollutantsare associated with cancer, cardiovascular, respiratory and neurological diseases. Carbon monoxide (CO) when inhaled affects the bloodstream, reduces the availability of oxygen and can be extremely harmful to public health. The emission of nitrogen dioxide (NO2 ) from transportation sources reduces lung function, affects the respiratory immune defense system and increases the risk of respiratory problems. The emissions of sulfur dioxide (SO2 ) and nitrogen oxides (NOx ) in the atmosphere form various acidic compounds that when mixed with cloud water create acid rain. Acid precipitation has detrimental effects on the built environment, reduces agricultural crop yields and causes forest decline (Delucchi, 2003). The reduction of natural visibility by smog has a number of adverse impacts on the quality of life and the attractiveness of tourist sites. Particulate emissions in the form of dust emanating from vehicle exhausts as well as from non-exhaust sources such as vehicle and road abrasion, have an impact on air quality. The physical and chemical properties of particulates are associated with health risks such as respiratory problems, skin irritation, eye infl ammation, blood clotting and various types of allergies.
- Noise. Noise represents the general effect of irregular and chaotic sounds. It is traumatizing for the hearing organ and that may affect the quality of life by its unpleasant and disturbing character. Long-term exposure to noise levels above 75 dB seriously hampers hearing and affects human physical and psychological wellbeing (Valcic, 1980). Transport noise emanating from the movement of vehicles and the operations of ports, airports and railyards affects human health, through an increase in the risk of cardiovascular diseases. Increasing noise levels have a negative impact on the urban environment refl ected in falling land values and loss of productive land uses.
- Water quality. Transport activities have an impact on hydrological conditions. Fuel, chemical and other hazardous particulates discarded from aircraft, cars, trucks and
trains or from port and airport terminal operations, such as de-icing, can contaminate rivers, lakes, wetlands and oceans. Globally, world seaborne trade grew from 2.6 billion tons of loaded goods in 1970 to 5.9 billion tons in 2002 (UNCTAD, 2003). Because demand for shipping services is increasing, marine transport emissions represent the most important segment of water quality inventory of the transportation sector. The main effects of marine transport operations on water quality predominantly arise from dredging , waste, ballast waters and oil spills. Dredging is the process of deepening harbor channels by removing sediments from the bed of a body of water. Dredging is essential to create and maintain suffi cient water depth for shipping operations and port accessibility. Dredging activities have a two-fold negative impact on the marine environment. They modify the hydrology by creating turbidity that can affect the marine biological diversity. The contaminated sediments and water raised by dredging require spoil disposal sites and decontamination techniques. Waste generated by the operations of vessels at sea or at ports causes serious environmental problems, since it can contain a very high level of bacteria that can be hazardous for public health as well as marine ecosystems when discharged in waters. Besides, various types of garbage containing metals and plastic are not easily biodegradable. They can persist on the sea surface for long periods of time and can be a serious impediment for maritime navigation in inland waterways and at sea, also affecting berthing operations. Ballast waters are required to control ships' stability and draught and to modify their center of gravity in relation to cargo carried and the variance in weight distribution. Ballast waters acquired in a region may contain invasive aquatic species that, when discharged in another region, may thrive in a new marine environment and disrupt the natural marine ecosystem. There are about 100 non-indigenous species recorded in the Baltic Sea. Invasive species have resulted in major changes in nearshore ecosystems, especially in coastal lagoons and inlets (Leppäkoski et al., 2002). Major oil spills from oil cargo vessel accidents are one of the most serious problems of pollution from maritime transport activities. The Erika, Prestige, and Sea Empress oil spills that occurred in the European Atlantic generated a signifi cant amount of pollution that destroyed aquatic species including algae, mollusks, crustaceans, marine mammals, fi sh and invertebrates (Talley, 2003).
- Soil quality. The environmental impact of transportation on soil consists of soil erosion and soil contamination. Coastal transport facilities have signifi cant impacts on soil erosion. Shipping activities are modifying the scale and scope of wave actions leading to serious damage in confi ned channels such as river banks. The removal of the Earth's surface for highway construction or lessening surface grades for port and airport developments have led to important loss of fertile and productive soils. Soil contamination can occur through the use of toxic materials by the transport industry. Fuel and oil spills from motor vehicles are washed off road sides and enter the soil. Chemicals used for the preservation of railroad ties may enter into the soil. Hazardous materials and heavy metals have been found in areas contiguous to railroads, ports and airports.
- Biodiversity. Transportation also infl uences natural vegetation. The need for construction materials and the development of land-based transportation has led to deforestation. Many transport routes have required draining land, thus reducing wetland areas and driving out water plant species. The need to maintain road and rail right-of-way or to stabilize slopes along transport facilities has resulted in restricting the growth of certain plants or has produced changes in plants with the introduction of new species different from those which originally grew in the area. Many animal species are becoming extinct as a result of changes in their natural habitats and reduction of ranges.
• Land take. Transportation facilities have an impact on the urban landscape. The development of port and airport infrastructure is a signifi cant feature of the urban and peri-urban built environment. Social and economic cohesion can be severed when new transport facilities such as elevated train and highway structures cut across an existing urban community. Arteries or transport terminals can defi ne urban borders and produce segregation. Major transport facilities can affect the quality of urban life by creating physical barriers, increasing noise levels, generating odors, reducing the urban aesthetic and affecting the built heritage.
A comprehensive assessment of the environmental impacts of the transportation system is not restricted to these issues. Additional effects such as accidents and the movement of hazardous material s need to be included. It is also possible to break down the total environmental impact of the transport industry into contribution from downstream and upstream requirements for the provision of transport infrastructures. Another issue is that the scale of the impacts may vary from the local to the global. Transportation impacts can fall within three categories:
- Direct impacts. The immediate consequence of transport activities such as pollutant emissions and respiratory diseases. The cause-and-effect relationship is generally clear and well understood.
- Indirect impacts. These are the secondary (or tertiary) effects of transport activities. They are often of higher consequence than direct impacts, but the involved relationships are often misunderstood and diffi cult to establish, such as congested traffi c and stress.
- Cumulative impacts. These are the additive, multiplicative or synergetic consequences of transport activities. They take into account of the varied effects of direct and indirect impacts on an ecosystem, often unpredicted such as physical barriers and the migration of exotic species.
As shown in Figure 8.1, the environmental dimensions of transportation include:
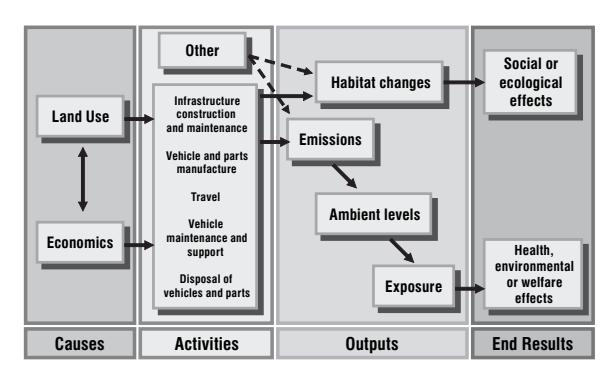
Figure 8.1 Environmental dimensions of transportation (Source: adapted from EPA)
- Causes. Two major factors contribute to the level of transport activities. Land use refers to the spatial structure and location of the transport demand. The most important driving factor for transport pollution emission is economic growth which is in turn related to higher incomes, increase motorization and travel activity expressed in passenger-kilometers or ton-kilometers.
- Activities. A wide array of factors are involved in the use of transportation infrastructures and related services. All these activities have environmental outputs.
- Outputs. Several factors are to be considered. The fi rst outcome of transportation activities is pollutant emissions. According to the geographical characteristics of the area where emissions are occurring (e.g. wind patterns), ambient levels are created. Once these levels are correlated with population proximity, a level of exposure to harmful pollutants can be calculated. This exposure is likely to have negative consequences.
- End results. They include all the health, environmental and welfare effects of the exposure to emissions from transportation activities.
The relationships between transport and the environment are complex and multidimensional. The spatial accumulation of transportation has become a dominant factor behind the emission of most pollutants and their impacts on the environment. With growth in transport and an unbalanced modal split , business as usual in the transport sector is no longer a viable option. Controlling the negative externalitiesof transportation facilities and operations is likely to be compromised without an understanding of the challenges and policy implications of sustainability.
Concept 3 – Transport and sustainability
The relationships between the environment and the transport industry are strong. With the rapid expansion of the world economy, concerns over the environmental impacts of transportation are increasing. The reduction of negative environmental externalities has become a central theme for transport development strategies. The main dilemma in environmental protection is the confl ict between the top-down and bottom-up approaches. Top-down decision making recognizes the leadership of the international community and governments in focusing efforts on international regulations and their implementation. Bottom-up decision making acknowledges the role of transport fi rms in reducing the environmental impact of their activities based on their analysis of operating conditions, environmental assessment, established priorities and organizational capabilities. The two approaches are not mutually exclusive as they are infl uenced by the concept of sustainability.
Top-down approach to sustainable transport
Since the mid-1980s, many of the changes that have occurred in transport systems have been undertaken in parallel with the search for a balance between the economic, social and environmental dimensions of development. The concept of sustainable development was popularized in 1987 with the publication of the Bruntland report which defi ned sustainable development as the ability to meet the needs of the current generation without compromising the needs of future generations. In June 1992, the Rio Earth Summit declared that sustainable development involves the equitable sharing of the benefi ts of economic progress by focusing on the conservation and preservation of natural resources, and by tackling the reciprocal infl uences of environmental, social and economic issues. Efforts to promote sustainable development were further enhanced with the Johannesburg Summit in 2002, with commitments on poverty reduction, and on protecting the Earth's biodiversity and ecosystems. Sustainable development is concerned with seeking an optimal balance between environmental, economic and social objectives.
The emergence of a consensus on the necessity of implementing strategies of sustainable development applied to the evolution, performance and organization of transport systems led to the recognition of the concept of environmentally sustainable transport . In 1996, the OECD designated environmentally sustainable transport as one that does not endanger public health and ecosystems and meets access needs, while using renewable resources below their rate of generation, and using non-renewable resources below the development rates of renewable substitutes (OECD, 2002).
Sustainable development applied to transport systems requires the promotion of linkages between environmental protection, economic effi ciency and social progress. Under the environmental dimension, the objective consists in understanding the reciprocal infl uences of the physical environment and the practices of the industry, and that environmental issues be addressed by all aspects of the transport industry. Under the economic dimension, the objective consists of orienting progress in the sense of economic effi ciency. Transport must be cost-effective and capable of adapting to changing demands. Under the social dimension, the objective consists in upgrading standards of living and quality of life.
The environmental, economic and social dimensions of sustainable transportare interdependent and lead to various trade-offs and opportunities for transport decision makers. Policies to improve accessibility will increase motorization and environmental externalities . Economic policies increasing transport tariffs to refl ect real costs, will affect individual incomes and be detrimental to the poor. Social policies favoring the informal transport sector with a view to answering the mobility needs of the poor may give rise to a signifi cant increase in polluting emissions. Solutions to achieve a relative balance between these trade-offs can be found in health and safety improvements, effi cient transport pricing, infrastructure maintenance, and land use design (Gwilliam and Shalizi, 1996).
In 2001, the United Nations proposed that sustainable development when applied to transport refers to its role in securing a balance between equity, effi ciency and the capacity to answer the needs of future generations. More specifi cally, this implies: 1) securing energy supply; 2) refl ecting the costs of non-renewable resources in transport vehicle operations; 3) creating responsive and effective markets; and 4) adopting production processes respective of the environment by eliminating negative externalities detrimental to future generations (United Nations, 2001).
In reviewing sustainable development strategies, the OECD developed ten guidelines for the management of sustainable transportfor future-oriented policy making and practices:
- Develop long-term vision of a desirable transport future that is sustainable for environment and health and provides the benefi ts of mobility and access.
- Assess long-term transport trends considering all aspects of transport, their health and environmental impacts, and the economic and social implications of continuing with business as usual.
- Defi ne health and environmental quality objectives, based on health and environmental criteria, standards and sustainability requirements.
Set quantifi ed sector-specifi c targets derived from the environmental and health quality objectives and set target dates and milestones.
Identify strategies to achieve environmentally sustainable transportand combinations of measures to ensure technological enhancement and changes in transport activity.
Assess the social and economic implications of the vision and ensure that they are consistent with social and economic sustainability.
Construct packages of measures and instruments for reaching the milestones and targets of environmentally sustainable transport .
Develop an implementation plan that involves the well-phased application of packages of instruments capable of achieving environmentally sustainable transport, taking into account local, regional and national circumstances.
Set provision for monitoring implementation and for public reporting on the environmentally sustainable transport strategy.
Build broad support and cooperation for implementing environmentally sustainable transport .
Governments have a very important role to play in achieving the environmental objectives of sustainable development of the transport industry. For the past decade, governments have introduced a variety of rules in different sectors that constitute steps towards attaining a sustainable environment. Examples of legislation included energy consumption, transport development, polluting emissions, protection of ecosystems, etc. These laws and rules increase the amount and strength of measures to protect and improve the environment. Environmental legislation is placing increasing restrictions on transport activity and companies have to respond by developing management systems enabling them to meet regulatory requirements. All the partners of the transport industry (i.e. carriers, terminal operators, shippers, stevedores, etc.) must answer these new regulatory requirements. Terminal operators and carriers must be responsible for the damage they cause to the environment. This can be translated by sanctions, fi nancial obligations or withdrawal of permits. The planning and implementation processes of investments in transport infrastructures around the globe increasingly include an environmental impact assessment (EIA) satisfying minimum standards of analysis.
An environmental impact assessment is a process for carrying out an appraisal of the full potential effects of a development project on the physical environment.
This suggests that the most effi cient means to implement strategies of environmental sustainability defi ned by governments consist in the elaboration of a policy framework giving responsibilities of sustainable development blueprint to the transport operators.
Bottom-up approach to sustainable transport
There is a wide range of responses to environmental sustainability. The various trajectories for a sustainable environment involve three steps: 1) transport operations must conform to local, national and international regulations; 2) environmental costs of transport operations must be built into the price of providing transport facilities and services; 3) environmental performance must be introduced into the organization's management. Environmental sustainability represents a growing area of responsibility for transport companies, one that is forcing them to acquire expertise in environmental management. The most important challenge for the industry is to implement environmentally sustainable transport within competitive market structures. As a result, before implementing a systematic approach to managing environmental performance, senior management of transport fi rms are considering key cost issues: inventory and resources.
- Inventory. The fi rst obstacle common to all enterprises that wish to adopt and implement an environmental policy is to collect transport data on environmental output. Planning environmentally sustainable transport rests on numerous components linked to environmental conditions, legislation and transport operations. As a result, many transport fi rms identify one or a few selected issues pertaining to transport operations, legislation and the physical environment. They will search for a proper answer that would fulfi ll their objectives in terms of sustainable environment without the formal use of an environmental impact assessment. Transport companies need fl exibility and do not necessarily have to adopt formal procedures. Often, transport companies need to decide the rhythm of their environmental performance in relation to their management capacity.
- Resources. The adoption of an environmentally sustainable transport policy involves costs in terms of time, personnel and resources that are not always available for small and medium size transport companies. The continuous process of data collection and evaluation depends on the presence within the corporate structure of experts responsible for surveying, initiating and coordinating all the measures for protecting the environment. As a result, some transport enterprises invest in the development of information technology pertaining to performance indicators of environmental impact assessment. Other companies use available commercial software. Any environmental impact assessment must consider using the best available technology at an appropriate cost. Given these inherent costs, the adoption and implementation of a set of techniques of environmental management can contribute to, but do not by themselves guarantee, optimal environmental results.
The practices of environmentally sustainable transportincreasingly affect the competitiveness of the transport industry around the world. However, there are many reasons why environmental management should be integrated with the traditional economic considerations of transport enterprises.
- Investments. The transport industry needs to invest in clean technologies, improving energy effi ciency, increasing renewable energy use, waste reduction and recycling. These various methods and techniques may reduce the fi nancial costs of the transport industry in meeting emission reduction requirements.
- Credit rates. The fi nancial sector is increasingly concerned about environmental sustainability. As a result, merchant banks are implementing credit programs charging different interest rates to terminal operators and carriers in relation to their environmental performance.
- Insurance premiums. Environmental costs infl uence insurance premiums. Transport fi rms that undertake activities that pose a potential risk to the environment pay an annual premium for any damage that might occur to the environment and must prepare some contingency plan. The conditions and insurance premiums are function of the past environmental performance of transport operators. Already, insurance companies reduce insurance premiums of fi rms that have a green certifi cation.
- Market capitalization. Increasingly, environmental components are accounted in the evaluation of the value of shares for fi rms registered in the stock market. A growing number of investors are seeking socially responsible investment opportunities.
- Revenues. Several factors permit the transport industry to increase revenues. State instruments such as fi scal advantages, government purchasing policies and government subsidies that favor through fi scal measures the purchase of green technologies permit fi rms that make use of these programs promoting environmental sustainability, to achieve important savings. Equally revenue sensitive are
environmentally differentiated fairway charges that permit carriers to increase their revenues.
- New markets. It is true that environmental management imposes restrictions that could result in more costly solutions. However, a transport enterprise that acquires expertise in environmental management also secures a marketable knowledge. This expertise can be harnessed to become a statutory and even a commercial advantage.
- Strategic alliances. An increasing number of transport operators attest in their annual reports their compliance to environmental legislation. Legal and compensation costs related to transport project development have an infl uence in global transactions of mergers and acquisition. This suggests that environmental risk reduction represents an asset for active stakeholders.
Framework for sustainable transport
All transport infrastructures vary in terms of property, investment provisions, types of activities and volume of traffi c. As a result, it is not possible to provide a unique model of environmental management as problems are mode specifi c and there are no agreed common international standards. Nevertheless, there are several environmental management systems (EMS) that provide procedures and specifi cations in a structured and verifi able manner to meet environmental objectives.
An environmental management system is a set of procedures and techniques enabling an organization to reduce environmental impacts and increase its operating effi ciency.
Obviously, transport fi rms can only manage environmental issues on which they can exert a controlling infl uence. The best environmental practices include procedures that:
- Match transport facilities, operations or projects with environmental components.
- Link environmental components with regulatory requirements.
- Assess risks, impacts and responsibilities.
- Identify those environmental issues to be addressed.
- Consider commercial strategies and operations of private and public sector organization.
- Introduce best practices.
- Undertake continuous monitoring and auditing.
These issues must be clearly understood and addressed before designing a particular framework of environmental management for a transport organization. There exist numerous environmental management systems. Obviously, the choice of a system is specifi c to each transport enterprise in relation to the problems, risks, impacts and responsibilities identifi ed and the geographical environment in which the enterprise must operate. The most often mentioned environmental management systems are EMAS and ISO 14001.
• Eco-Management and Audit Scheme. In 1993, the European Union created the norm EMAS, conceived to provide European fi rms with a framework and operational tools that would permit to better protect the environment. EMAS has developed a handbook entitled Identifi cation of environmental aspects and evaluation of their importance. This approach rests on the necessity to identify environmental impacts and the various types of environment that are affected by the operations and activities of any types of organizations including transport enterprises. The impacts are evaluated according to a step-by-step procedure that examines each activity of an enterprise and their impacts on the environment. Each impact is then assessed in relation to criteria developed by the organization. These criteria must evaluate the potential damage to the environment, the fragility of the environment, the size and frequency of the activity, the importance of that activity for the organization, the employees and the local community, and the legal obligations emanating from environmental legislation.
• ISO 14001. The International Standard Organization has developed a set of norms that represent the main industrial reference in terms of environmental management systems and sustainability. ISO 14001 offers three categories of indicators to measure the environmental performance that could be applicable to the transport industry. The indicators of environmental conditions (IEC) present the information on the environmental conditions permitting a better understanding of the impacts or the potential impacts of transport operations. The indicators of management performance (IMP) present information on the management efforts that are being made to infl uence the environmental performance of transport operations. The indicators of operational performance (IOP) present information on the environmental performance of transport operations. Generally, these indicators permit to identify the most signifi cant environmental impacts that are associated with transport operations, to evaluate, review and increase the environmental performance of transport corporations, to identify new practices and opportunities for a better management of transport operations, and to have constant, credible and measurable information and data on the relationship between the environmental performance of the fi rm and its environmental objectives, targets and policies.
EMAS has been developed to stimulate and synchronize European environmental policies. EMAS mainly addresses manufacturing and transportation issues and is site specifi c. EMAS has a focus on internal corporate activities (as ISO) but also on external stakeholders. As a result, EMAS holders are required to publish environmental statements for the public, while ISO 14001 has no such provision. In contrast, ISO 14001 is global in scope and is company specifi c. The corporate benefi ts do not differ between the two systems and studies suggest that the two standards have no practical effects on environmental performance (Freimann and Walther, 2001; Biondi, Frey and Iraldo, 2000). The most important issue is that both environmental management systems (EMS) have strength and areas to improve, but it is the corporate environmental outlook that is the real engine to a high level of environmental performance and therefore a strong EMS.
As shown in Figure 8.2, a model EMS should be fl exible and be adapted to suit the needs of a particular industry. An EMS developed for port and maritime transport should focus on issues such as water quality, air quality, waste management, habitat conservation, noise, dredging , contaminated soils, anti-fouling paints and energy consumption. For all these issues, compliances with legislation affecting shipping and port operations should be considered. An environmental management system implies interdependence and information fl ows. This is not to say that it is not possible to implement sustainable development through a piecemeal approach, but it is preferable to recognize the complementarities and dynamic feedback of the various dimensions composing the model. A key feature of environmental management consists in maintaining a balance between the environmental, legislative and commercial dimensions. Evaluating the trade-offs is one of the main challenges facing decision makers.
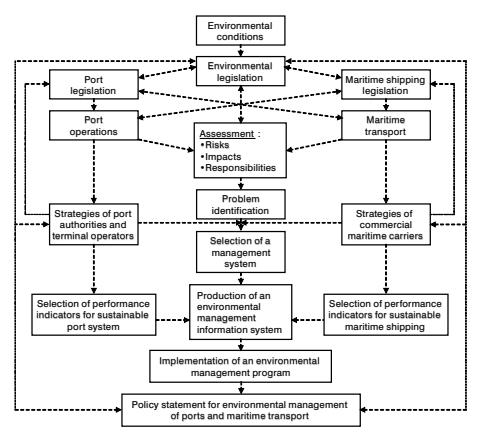
Figure 8.2 Environmental management system for port and maritime transport
Obviously, the adoption of an EMS favors the conformity and the adaptability of transport operations to environmental legislation. The issue of responsibility is at the heart of the processes of environmental sustainability. The modern history of environmental legislation reveals that different laws have been promulgated on a wide range of physical components of the environment. In the fi eld of transport, several measures have been adopted to refl ect the objectives of sustainable environment. While many of these measures are perfectible, international environmental laws and legislation tend to put pressure within and beyond national boundaries. The growth in the number and strength of environmental policies, rules and practices has increased the number of standards and has permitted the development of a wide range of techniques of environmental sustainability such as voluntary remediation programs, fl exible standards and procedures, fi nancial and technical support. The main benefi t resides in the reduction of legal costs that affect the profi ts and the productivity of the transport industry. There exist four functions that can anchor the administrative responsibility of the transport industry.
• Quantify the terms of references. Everywhere, transport companies have to adapt their environmental objectives in relation to a great variety of geographical conditions, commercial, technological changes and environmental policies, legislation and regulations. Henceforth, transport corporations cannot limit themselves to simply enunciate principles or policies in the fi eld of environment. Environmental management systems applied to transportation require a massive amount of information on environmental conditions and the dynamics of the transport system. The best practices are those adopting an analytical framework disaggregating environmental objectives. This implies homogenous, exploitable and credible units of measurement that are time referenced with a view to observe the evaluation and comparison by sector and at different geographical scales. Data must permit the environmental impacts of transport activities to be quantifi ed continuously. Reasonable objectives need to be fi xed that would in turn represent benchmarks for defi ning strategies of environmental sustainability in different sectors and at different levels. For instance, this could be the reduction of polluting emissions by a certain percentage over a given period of time in relation to a given benchmark.
- Devise calendar of operations. The objectives of sustainable environment can be very complex for several reasons: 1) the lack of data for evaluating the impact and the cost of environmental measures; 2) the importance of strategies and actions at the international level; 3) the lack of procedures or methods to solve the problems; 4) confl icts of jurisdictions; and 5) the growth in the production of polluting emissions. New problems may need to be controlled or solved while our understanding of environmental problems improves and new environmental technologies are introduced. The most effi cient strategies are those that target short, medium and long term objectives with precise values. The best strategies are dynamic and integrated within a continuous evaluation process.
- Establish benchmarking. There is a need to establish the minimum standards of quality that are sought from transport operations. Since it is almost impossible to establish a pristine reference, the standards must permit to specify the state of environmental quality that is sought. These standards must express the specifi c environmental status with regards to water, air, soil and all the other components of the physical environment within a precise geographical area. The standards will clarify the level of pollution or other impacts that can be supported by people and the environment without any risks. The best practices are those that: 1) establish standards on the basis of scientifi c criteria; 2) engage public administration in the development of procedures for writing, applying and controlling legislation; and 3) integrate these standards within the practices of territorial planning.
- Implement measures of control. It is important to impose standards of quality and parameters for the different components of the physical environment. The objective must be the eradication of any toxic substances that may present a risk for people's health and the environment. The practices and the policies of environmental sustainability within the transport industry demonstrate the need for fl exibility and adaptability of transport systems to the challenges of protecting the environment through the adoption of appropriate technologies and materials. Notwithstanding the criteria of analysis in the environmental management plan, it is important to undertake frequent assessments with a view to controlling the respect of transport operations to the existing environmental legislation. Environmental certifi cation represents the best instrument of control of the transport industry.
Implementing an environmental management system requires a broad range of instruments. Six instruments are conducive to the implementation of strategies for environmental sustainability applied to the transport industry:
- Strategic instruments. Any strategy of environmental sustainability must rest on a vision of development that defi nes general orientations and interacts with existing policies. Corporate leadership plays a key role in the success of practices of sustainable environment. A company-wide vision of sustainability facilitates the integration of sustainable environment goals within management practices. Furthermore, it may help receiving government support and encourage the participation of stakeholders.
- Legal instruments. Legislation remains one of the most important instruments to achieve sustainable environment. The best practices are associated with different
legislation emanating from public administrations at the local, regional, national and international level.
- Geographic instruments. Geographic and cartographic tools are fundamental for environmental sustainability planning. For transport enterprises, these tools permit the construction of databases on the physical characteristics of land use, inventory and mapping of freight and passenger fl ows, trip length and frequencies.
- Economic instruments. Cost-benefi t analyses are important in the elaboration of pricing and fi scal policies and fi xing quotas to protect the environment from transport activities. Economic instruments can further be modifi ed to assess more accurately the costs of environmental damage. The most effi cient "green taxes" in terms of environmental sustainability rest on the establishment of dues that refl ect the marginal costs of environmental damage.
- Communication instruments. Personnel training, research and development activities, dissemination of impact assessment and risk evaluation reports are extremely important in infl uencing the behavior of transport users and corporate decision making. The best performances in sustainable environment are achieved in transport fi rms that have adopted measures of knowledge growth and environmental responsibilities among all the personnel working in the transport organization.
- Cooperation instruments. These instruments aim at increasing the institutional capacity of the transport industry by integrating all the elements of environmental sustainability in corporate strategies. Cooperation and voluntary alliances between governments and transport industry stimulate and facilitate the identifi cation of objectives and the elaboration of strategies for a sustainable environment.
Method 1 – Transport environmental management
Environmental impact assessment
Environmental impact assessment is a key instrument in the elaboration of environmentally sustainable transport . There exists a vast literature on the different stages of environmental impact assessment (Walker and Johnston, 1999; Raymond and Coates, 2001a, 2001b; Lawrence, 2003; André, Delisle and Reveret, 2004). The process of environmental impact assessment implies numerous activities. There are many criteria to use in order to determine the interrelationships between environmental components and a given transportation activity or project. Any environmental impact assessment must be designed to accommodate these conditions.
In this section, we address three key issues at the most basic level of an environmental impact assessment taking the case of the construction of a new truck terminal. The answers will necessarily assist in identifying environmental problems linked to transport activities and developing management solutions.
The fi rst issue is to match transport facilities, operations or projects with environmental components (Table 8.1). The set of criteria are determined in relation to the physical, biological, and socio-economic characteristics of the site where the project is to be developed. The checklist serves as guidelines of the environmental and social consideration for a truck terminal project. These guidelines provide environmental and social items to be checked. It may be necessary to add or delete an item taking into account the type of project, the proposed activity and the specifi c location.
The second issue addresses the linkages between environmental components and regulatory requirements (Table 8.2). One of the factors reinforcing the adoption of an environmental impact assessment rests on the necessity to avoid risks of legal pursuit.
Table 8.1 Matching a transport project with environmental components
| Environmental and social impacts of a new truck terminal project | |||||||||||
|---|---|---|---|---|---|---|---|---|---|---|---|
| Impacts on the environment | Impacts on the built environment | Socio-economic impacts | |||||||||
| quality Water |
Air quality | Soil quality | Noise | Infrastructure Terminal/ |
structure Urban |
Landscape townscape and |
Cultural heritage |
Resettlement | minorities Ethnic |
environment Social |
|
| Types of trucks |
|||||||||||
| Truck traffi c |
|||||||||||
| in the area operating terminals of truck Number |
|||||||||||
| unloading Loading/ |
|||||||||||
| Freight traffi c |
Table 8.2 Linking environmental components with regulatory requirements
| Environmental and social impacts of a new truck terminal project | | | | | |------------------------------------------------------------------|---------------|-------------------------------------------------|--|--| | Activity | Impact | Legislation | | | | Truck traffi c | Water quality | Environmental Protection Act Articles 20 and 32 | | | | | Air quality | Regulation 1404 on air pollution | | | | | | Air Quality Act 1984 | | | | | Soil quality | Environmental Quality Act 1980 | | | | | Noise | City by-law on noise level | | |
| | Soil quality
Environmental Quality Act 1980 | | | | |
|------------------------------------------------------------------|------------------------------------------------------------------------------------------------------------------------------------------------------------------------------------------------------------------------------------------------------------------------------------------------------------------------------------------------------------------------------------|--|--|--|--|
| Noise | City by-law on noise level | | | | |
| Table 8.3
Assessing risks, impacts and responsibilities | | | | | |
| Environmental and social impacts of a new truck terminal project | | | | | |
| Issue | Comments | | | | |
| Types of trucks to be
parked in the terminal | Trucks can be classifi ed according to their weight load. This recognizes
the potential environmental problems caused by the trucking industry.
Heavy trucks will require more space, so the risks on the local community
increase. | | | | |
| Truck traffi c | The project is quantifi ed according to truck movement in the terminal. The
objective is to assess the potential impact produced by the simultaneous
operation and maintenance of trucks, including entry, exit, parking,
fuelling, washing and repair. | | | | |
| Loading and unloading
risks | This criterion assesses the risk of environmental impact caused by the
loading and unloading of dangerous substances. | | | | |
| Freight traffi c | The project must be assessed as a function of the daily average of freight
traffi c. This recognizes the potential impacts produced by freight loading
and unloading and the infrastructure and personnel requirements to
manage the transport terminal. | | | | |
| Number of truck
terminals operating in
the area | The presence of other truck terminals in the region can produce a
cumulative impact on the environment. The number and characteristics of
similar terminals need to be assessed. | | | | |
| Natural environment | This criterion recognizes that installation of truck facilities can cause an
alteration of topographic and geologic features in the surrounding areas,
can adversely affect hydrological conditions or affect natural vegetation. | | | | |
| Water, air, soil and
noise quality | This criterion evaluates pollutant emissions from trucks and ancillary
facilities and their compliance with the country's quality standards. If
signifi cant impact on global issues such as climate change is anticipated,
adequate mitigation measures should be taken. | | | | |
| Social environment | This criterion assesses the current land use present in the area where the
project is proposed. The objective is to evaluate the possibility that the
project will adversely affect the living conditions of inhabitants, economic
activities, the existing traffi c and the local landscape notably archeological,
historical, cultural and religious heritage sites. | | | | |
| Resettlement | This criterion recognizes that many negative impacts can be produced
during construction. The objective is to assess the development of
a resettlement plan, including proper compensation, restoration of
livelihoods and living standards. | | | | |
| Ethnic minorities,
indigenous people and
vulnerable groups | This criterion aims at giving considerations to reduce the impacts on
culture and lifestyle of ethnic minorities and indigenous peoples and to
pay particular attention to vulnerable groups or persons, including women,
children, the elderly and the poor. | | | | |
The third issue assesses risks, impact and responsibilities (Table 8.3). If an environmental impact assessment is required in the case of a transport project, a full description of the proposed project activities, and an assessment of the interactions, negative and positive, among the proposed activities and the environment are necessary.
References
- André, P., C.E. Delisle and J.P. Reveret (2004) L'évaluation des Impacts sur l'Environnement, Montréal: Presses Internationales Polytechnique.
- Attali, J. (1975) La Parole et l'Outil, Paris: Presses Universitaires de France.
- Barke, M. (1986) Transport and Trade, Edinburgh: Olivier & Boyd.
- Biondi, V., M. Frey and F. Iraldo (2000) "Environmental Management Systems and SMEs. Motivations, Opportunities and Barriers Related to EMAS and ISO 14001 Implementation", Greener Management International, 29, 55–69.
- Bonnafous, A. and C. Raux (2003) "Transport Energy and Emissions: Rail ", in D.A. Hensher and K.J. Button (eds) Handbook of Transport and the Environment, vol. 4, Amsterdam: Elsevier, pp. 293– 307.
- Comtois, C. and P.J. Rimmer (2004) "China's Complete Push for Global Trade: Port System Development and the Role of COSCO", in D. Pinder and B. Slack (eds) Shipping and Ports in the Twenty-fi rst Century, London: Routledge, pp. 40–62.
- Delucchi, M.A. (2003) "Environmental Externalities of Motor Vehicle Use", in D.A. Hensher and K.J. Button (eds) Handbook of Transport and the Environment, vol. 4, Amsterdam: Elsevier, pp. 429–49.
- Freimann, J. and Walther, M. (2001) "The Impacts of Corporate Environmental Management Systems. A Comparison of EMAS and ISO 14001", Greener Management International, 36, 91–103.
- Gwilliam, K.M. and Z. Shalizi (1996) Sustainable Transport: Sector Review and Lessons of Experience, Washington, DC: World Bank.
- Holmen, B.A. and D.A. Niemeier (2003) "Air quality", in D.A. Hensher and K.J. Button (eds) Handbook of Transport and the Environment, vol. 4, Amsterdam: Elsevier, pp. 61–79.
- Johansson, B. (2003) "Transportation Fuels A System Perspective", in D.A. Hensher and K.J. Button (eds) Handbook of Transport and the Environment, vol. 4, Amsterdam: Elsevier, pp. 141–57.
- Khare, M. and P. Sharma (2003) "Fuel Options", in D.A. Hensher and K.J. Button (eds) Handbook of Transport and the Environment, vol. 4, Amsterdam: Elsevier, pp. 159–83.
- Lawrence, D.P. (2003) Environmental Impact Assessment. Practical Solutions to Recurrent Problems, Hoboken, NJ: Wiley-Interscience.
- Leinbach, T.R. and J.J. Bowen (2004) "Airspaces: Air Transport, Technology, and Society", in S.D. Brunn, S.L. Cutter and J.W. Harrington (eds) Geography and Technology, Dordrecht: Kluwer Academic, pp. 285–313.
- Lenzen, M., C. Dey and C. Hamilton (2003) "Climate Change", in D.A. Hensher and K.J. Button (eds) Handbook of Transport and the Environment, vol. 4, Amsterdam: Elsevier, pp. 37–60.
- Leppäkoski, E., S. Gollasch, P. Gruszka, H. Ojaveer, S. Olenin and V. Panov (2002) "The Baltic A Sea of Invaders", Canadian Journal of Fisheries and Aquatic Sciences, 59(7), 1175–88.
- Marine Transportation System National Advisory Council (MTSNAC) (2001) Challenges and Opportunities for the US Marine Transportation System, Washington, DC: US Department of Transportation, Maritime Administration (MARAD).
- Mass, P. (2005) "The Breaking Point", New York Times Magazine, August 21.
- Organization for Economic Co-operation and Development (OECD) (1988) Transport and the Environment, Paris: OECD.
- Organization for Economic Co-operation and Development (2002) OECD Guidelines Towards Environmentally Sustainable Transport, Paris: OECD.
Raymond, K. and A. Coates (2001a) Guidance on EIA Screening, Luxembourg: Offi ce for Offi cial Publications of the European Communities.
Raymond, K. and A. Coates (2001b) Guidance on EIA Scoping, Luxembourg: Offi ce for Offi cial Publications of the European Communities.
Rubenstein, J.M. (2004) "Motor Vehicles on the American Landscape", in S.D. Brunn, S.L. Cutter and J.W. Harrington (eds) Geography and Technology, Dordrecht: Kluwer Academic, pp. 267–83.
Schipper, L.J. and L. Fulton (2003) "Carbon Dioxide Emissions from Transportation: Trends, Driving Factors and Forces for Change", in D.A. Hensher and K.J. Button (eds) Handbook of Transport and the Environment, vol. 4, Amsterdam: Elsevier, pp. 203–25.
Sperling, D. (2003) "Cleaner Vehicles", in D.A. Hensher and K.J. Button (eds) Handbook of Transport and the Environment, vol. 4, Amsterdam: Elsevier, pp. 185–99.
Talley, W.K. (2003) "Environmental Impacts of Shipping", in D.A. Hensher and K.J. Button (eds) Handbook of Transport and the Environment, vol. 4, Amsterdam: Elsevier, pp. 279–91.
United Nations (2001) Sustainable Transport Pricing and Charges. Principles and Issues, New York: United Nations.
United Nations Commission on Trade and Development (2003) Review of Maritime Transport 2003, New York: United Nations.
Valcic, I. (1980) Le Bruit et ses Effets Nocifs, Paris: Masson.
Vance, J.E. (1990) Capturing the Horizon, Baltimore, MD: Johns Hopkins University Press.
Vellas, F. (1991) Le Transport Aérien, Paris: Economica.
Walker, L.J. and Johnston, J. (1999) Guidelines for the Assessment of Indirect and Cumulative Impacts as Well as Impact Interactions, Luxembourg: Offi ce for Offi cial Publications of the European Communities.
Transport planning and policy 9
Since transportation is such an important component of contemporary society, capable of producing signifi cant benefi ts, yet giving rise to many negative externalities, appropriate policies need to be devised to maximize the benefi ts and minimize the inconveniences. At the same time, the allocation, design and construction of such transport infrastructure and services must be subject to careful planning, both by public and private agencies. In this chapter a distinction is drawn between policy and planning. The major features of the policy and planning processes are examined because they both have to refl ect the fundamental changes in society and contemporary issues and problems. The changing orientation of public policy is described and the chapter goes on to explore the evolving nature of urban transport planning and intervention methods.
Concept 1 – The nature of transport policy
Defi ning policy and planning
The terms "policy" and "planning" are used very loosely and are frequently interchangeable in many transport studies. Mixing them together is misleading. Policy and planning represent separate parts of an overall process of intervention. There are circumstances where policy may be developed without any direct planning implications, and planning is frequently undertaken outside any direct policy context. However, precise defi nitions are not easy to come by. For example, here are two defi nitions of policy:
A set of principles that guide decision-making or the processes of problems' resolution (Studnicki-Gizbert, 1974).
The process of regulating and controlling the provision of transport (Tolley and Turton, 1995).
Transport planning is facing a similar issue related to its defi nition:
Transport planning is taken to be all those activities involving the analysis and evaluation of past, present and prospective problems associated with the demand for the movement of people, goods and information at a local, national or international level and the identifi cation of solutions in the context of current and future identifi cation of economic, social, environmental, land use and technical developments and in the light of the aspirations and concerns of the society which it serves (Transport Planning Society, UK).
A programme of action to provide for present and future demands for movement of people and goods. Such a programme is preceded by a transport study and necessarily includes consideration of the various modes of transport (European Environment Information and Observation Network).
In this chapter the following defi nitions are used:
Transport policy: The development of a set of constructs and propositions that are established to achieve particular objectives relating to socio-economic development, and the functioning and performance of the transport system.
Thus, transport policy can be concomitantly a public and private endeavor, but governments are often the most involved in the policy process since they either own or manage many components of the transport system. Governments also often perceive that it is their role to manage transport systems due to the important public service they provide.
Public policy is the means by which governments attempt to reconcile the social, political, economic and environmental goals and aspirations of society with reality. These goals and aspirations change as the society evolves, and thus a feature of policy is its changing form and character. Policy has to be dynamic and evolutionary.
Transport planning deals with the preparation and implementation of actions designed to address specifi c problems.
A major distinction between the planning and policy is that the latter has a much stronger relation with legislation. Policies are frequently, though not exclusively, incorporated into laws and other legal instruments that serve as a framework for developing planning interventions. Planning does not necessarily involve legislative action, and is more focused on the means of achieving a particular goal.
Why transport policy?
Transport policies arise because of the extreme importance of transport in virtually every aspect of national life (Button, 1993). Transport is taken by governments of all types, from those that are interventionalist by political credo to the most liberal, as a vital factor in economic development. Transport is seen as a key mechanism in promoting, developing and shaping the national economy. Many regional development programs, such as the Appalachia Project in the USA in the 1960s and the contemporary Trans-European Networks (TENs) policy in the EU are transport based. Governments also seek to promote transportation infrastructure and services where private capital investment or services may not be forthcoming. Paradoxically, academics question the directness of the links between transport and economic development.
Transport frequently is an issue in national security. Policies are developed to establish sovereignty or to ensure control over national space and borders. The Interstate Highway Act of 1956, that provided the United Stateswith its network of expressways, was formulated by President Eisenhower on the grounds of national security (see Figure 9.1). Security was at the heart of the recent imposition of requirements on document clearance prior to the departure of freight from foreign countries to the USA.
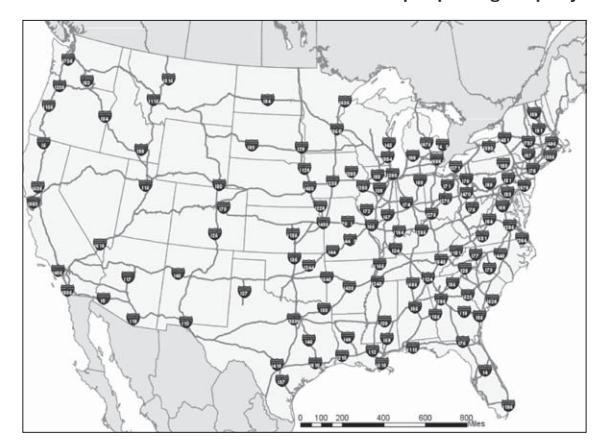
Figure 9.1 The interstate road system
Transport raises many questions about public safety and the environment. Issues of public safety have for a long time led to the development of policies requiring driving licenses, limiting the hours of work of drivers, imposing equipment standards, establishing speed limits, mandating highway codes, seat belts and other accident controls. More recently, environmental standards and control measures are being instituted, in response to the growing awareness of the environmental impacts of transport. Examples include banning leaded gasoline and mandating catalytic converters in automobiles.
Transport policy has been developed to prevent or control the inherent monopolistic tendency of many transport modes. Unrestrained competition leads to market dominance by a company thereby achieving monopoly power. Such dominance brings into question many issues affecting the public interest such as access (in a port, would smaller shipping lines be excluded?), availability (would smaller markets continue to receive air service by a monopoly carrier?) and price (would the monopolist be in a position to charge high prices?).
Other reasons for policy intervention include the desire to limit foreign ownership of such a vital industry. For example, the USA limits the amount of foreign ownership of its domestic airlines to a maximum of 49 percent, with a maximum of 25 percent control. Other countries have similar restrictions.
Policy instruments
Governments have a large number of instruments at their disposal to carry out transport policy. An extremely important instrument is public ownership. The direct control by the state of transportation is very widespread. Most common is the provision by public agencies of transport infrastructure such as roads, ports, airports, and canals. Public ownership also extends to include the operation of transport modes. In many countries, airlines, railways, ferries and urban transit are owned and operated by public agencies.
Subsidies represent an important instrument used to pursue policy goals. Many transport modes and services are capital intensive, and thus services or infrastructure that the private sector are unwilling or unable to provide may be made commercially viable with the aid of subsidies. In the nineteenth century, private railroad companies received large land grants and cash payments from governments anxious to promote rail services. In the USA, the Jones Act, which seeks to protect and sustain a US-fl agged merchant fl eet, subsidizes ship construction in US shipyards. Indirect subsidies were offered to the air carriers of many countries in the early years of commercial aviation through the awarding of mail contracts. Dredging of ship channels and the provision of other marine services such as pilotage and navigation aids are subsidies to facilitate shipping.
Both public ownership and subsidies represent instruments that require the fi nancial involvement of governments. Regulatory control represents a means of infl uencing the shape of transportation that is very widely employed. By setting up public agencies to oversee particular sections of the transport industry, governments can infl uence the entire character and performance of the industry. The agencies may exert control on entry and exit, controlling which fi rms can offer transportation services, at what prices, to which markets. Thus while the actual services may be offered by private fi rms, the regulator in fact plays a determining role. Regulatory agencies in the USA such as the Civil Aeronautics Board played a critical role in shaping the US airline industry for decades (Goetz, 2002).
Other policy instruments are less direct, although in many cases can be equally as important as the three discussed above. Many governments are major promoters of research and development in transportation. Government research laboratories are direct products of state investments in R&D, and much university and industry R&D is sustained by government contracts and programs. The fruits of this research are extremely important to the industry. It is a vital source for innovation and the development of new technologies such as intelligent vehicles and intelligent highway systems.
Labor regulations pertaining to conditions of employment, training, and certifi cation may not be directed purposefully at infl uencing transport, but as a policy they may exert signifi cant effects over the industry. Safety and operating standards, such as speed limits, may have similar effects. The restrictions on limiting the number of hours a truck driver may work may be instituted for safety reasons and to enhance the working conditions of drivers, but they shape the economics of truck transport. In the same fashion, speed limits help fi x the distance of daily trips that one driver may undertake, thereby shaping the rate structure of the trucking industry.
Trends in policy development
Public policies refl ect the interests of decision makers and their approaches to solving transport problems. These interests and approaches are both place specifi c (they apply to a particular area of jurisdiction) and time specifi c (they are established to refl ect the conditions of transport and the intended solutions at a point in time). Policies change and evolve, therefore, as the conditions change and as different sets of problems are recognized. Policies are dynamic.
The dynamic nature of policy is refl ected in the way policy instruments have been employed over the years. In the nineteenth century, when many of the modern transport systems were being developed, the prevailing political economy was one of laissezfaire, in which it was believed that the private sector should be the provider of transport services and infrastructure. Examples of private transport provision include:
- Turnpikes. The fi rst modern British roads in the eighteenth century were the outcome of private trusts aiming to derive income from tolls on roads they built and maintained. It was likely the fi rst massive private involvement in transport infrastructure provision (see Chapter 1, Concept 3).
- Canals. Many of the earliest canals were built with private capital. One of the fi rst canals that helped spark the Industrial Revolution in Britain was the Bridgewater Canal, built by the Duke of Bridgewater between 1761 and 1765 to haul coal from his mines to the growing industrial city of Manchester.
- Urban transit. In most North American cities, public transit was operated by private fi rms. The earliest examples were horsecars which followed raillines laid out on city streets. With electrifi cation at the end of the nineteenth century, the horsecars were converted to streetcars and the network was greatly expanded. In the twentieth century, buses were introduced by private companies operating on very extensive route systems (Muller, 2004).
- Ships. Most maritime companies were private enterprises. Many were family businesses, some of which became large companies, such as the Cunard Line in the UK. The main government involvement concerns military navies and ferries.
- Railways. Railways were developed by private companies during the nineteenth century, including such famous companies as Canadian Pacifi c and Union Pacifi c. In the USA, this has continued to the present day.
This situation was not completely without public policy involvement, however. The massive subsidies that were granted to US and Canadian railroads are an example of state intervention. In the early twentieth century the overprovision of rail lines, competition between carriers and market failures led to a crisis in many parts of the transport industry, particularly after 1918. This led to a growing degree of government involvement in the transport industry, both to offset market failures and jurisdictional confl icts and to ensure that services could be maintained for the sake of the "public good":
- The failure of the Canadian Northern Railway and the threat of a Canadian Pacifi c monopoly led the Canadian federal government to establish Canadian National in 1921.
- In many cities, private bus companies were taken over by municipally controlled transit commissions in the 1930s and 1940s.
- The airline industries in many countries were placed under the control of a national public carrier, for example Air France, Trans Canada Airlines, British Overseas Airways Corporation.
- Railways were nationalized in Europe after World War II, and in the USA in 1976 after the collapse of the Penn Central Railroad and several other lines, when a publicly funded passenger system (Amtrak) was set up, and a publicly owned freight railroad was established (Conrail).
In addition to the public ownership of transport modes, there emerged in the twentieth century a growing amount of regulatory control. The airline and the trucking industries saw entry limited by permits, and routes and rates were fi xed by regulatory boards that had been set up to control the industries. At the same time, greater safety regulations were being imposed and working conditions were increasingly being shaped by labor legislation. By the 1960s, therefore, transportation had come under the sway of public policy initiatives that exerted an enormous infl uence on the industries and their spatial structures.
By the 1960s, however, there was a growing body of evidence that indicated that public ownership and regulation were not always in the public interest. Transportation costs that were fi xed by the regulatory authorities were maintained at higher levels than were necessary. Research demonstrated that many regulatory boards had been "captured" by those they were supposedly regulating, so that they were frequently acting to protect the industries rather than the public. At the same time there was a crisis of public fi nances in many countries, where the costs of operating the state-owned transportation industry were seen to be unsustainable. Some economists espoused the theory of contestability, which repudiated traditional economic theory concerning monopoly power (Bailey and Baumol, 1984). Contestability theory argued that the threat of entry of a new actor was suffi cient to thwart a monopolist's ability to impose monopoly pricing. The key, therefore, is to relax entry thresholds, by allowing new fi rms to start up, something the regulatory boards were impeding.
This evidence was brought into the public policy arena by politicians who espoused market-oriented views, notably President Reagan in the USA and Prime Minister Thatcher in the UK. Although President Carter had initiated the fi rst steps towards deregulation in the USA in the mid-1970s, it was in the 1980s during the Reagan presidency that the trucking industry, the airline industry, and the railways were largely deregulated. In the UK, in addition there has been a massive move to privatize most sectors of the transport industry, including the state-owned and most municipally owned bus companies, the national airline, trucking, the railway, airports and most seaports.
Deregulation and privatization policies have spread, unequally, to many other parts of the world. New Zealand has perhaps the most open transport policy, but many others, such as Canadaand Australia, have made signifi cant steps in this direction. In the EU, the pace of deregulation and privatization is proceeding unevenly. Subsidies to state-owned transport companies have been terminated, and many airlines have been privatized. The government-owned railroads still exist in France, Germany, Italy and Spain, but the tracks have been separated from the traction and rail service operations, and have been opened up to new service providers. In Latin America, most of the stateowned transport sector has been deregulated. While the former centrally-planned states have had to make the furthest adjustments to a more open market economy, several, such as China , have opened up large sections of the transport industry to joint ventures with foreign private enterprises. In China, many new highways and most of the major ports are being developed with private capital. Thus, at the beginning of the twentyfi rst century, transportation is under less direct government economic control worldwide than at any period over the last 100 years.
The changing nature of policy interventions
The recent trends in transport policy towards liberalization and privatization have not necessarily weakened government interventions. Controls over monopoly power are still in place, and even in the most liberal of economies there is still strong evidence of public policy intervention even in such capitalist countries as the USA, for example:
• Ownership of ports and airports in the United States . Terminals continue to be largely under State or municipal ownership. Thus the Port of Los Angeles is a department of the City of Los Angeles; the port of Hampton Roads is owned by the Virginia Port Authority; New York's port and three major airports are owned by the Port Authority of New York and New Jersey.
- Highway provision remains one of the most signifi cant and enduring commitments of public funds.
- The Surface Transportation Board, the new regulatory agency controlling the railways , refused to sanction the proposed merger between Canadian National and Burlington Northern and Santa Fe Railroads in 2002. This was the fi rst time in 20 years that the regulator had turned down an application for merger. It cited concerns of concentration of ownership.
Government policy orientations have changed, however. Governments are beginning to exert greater control over environmental and security concerns, issues that are replacing former preoccupations with economic matters. The environment is becoming a signifi cant issue for government intervention. Coastal zone legislation has made it increasingly diffi cult for ports to develop new sites in the USA. Air quality is a major factor infl uencing the allocation of US federal funds for urban transport infrastructure. In Europe, environmental issues are having an even greater infl uence on transport policy. The EU Commission is promoting rail and short sea shipping as alternatives to road freight transport. Projects are assessed on the basis of CO2 reduction. All transportation projects are subject to extensive environmental assessments, which may lead to a rejection of proposals, despite strong economic justifi cation, such as the case of the Dibden Bay proposal for expanding the port of Southampton in the UK. As a major source of atmospheric pollution and environmental degradation, the transportation industry can anticipate many further government environmental policy interventions.
Security has always been a policy issue. Legislation imposing speed limits, mandating seat belts, and other measures have sought to make travel safer. These continue to proliferate. However, it is in the area of security that the most recent set of policy initiatives have been drawn. Screening of people and freight has become a major concern since 9/11 (see Concept 3 in Chapter 5). Both the US government and such international organizations as the International Maritime Organization (IMO) and the International Civil Aviation Organization (ICAO) have instituted new measures that impact on operations, and represent additional costs to the transport industry.
Thus, while there may have been some reduction of policy involvement in economic regulations, the infl uence of public policy on transport overall is still powerful.
Concept 2 – The policy process
Problem defi nition
Policies are developed in response to the existence of a perceived problem or an opportunity; they never exist in a vacuum. The context is extremely important because it will shape the kinds of actions considered. For example:
- Who has identifi ed the problem? Is it widely recognized by society as a whole or is it limited in scope, to a local pressure group for example? In the case of the former there may be a greater willingness to intervene than in the latter, depending on the political power exerted by the pressure group.
- Do the public authorities have the interest or will to respond? There are usually many more problems than the policy makers are willing to address. Many issues remain unaddressed.
- Do the public authorities wish to wield the instruments necessary to carry out a policy response? The problem may be recognized, but public authorities may have
little ability to effect change. Such is the case of many environmental problems that require global solutions.
• What is the timescale? How pressing is the problem, and how long would a response take? Policy makers are notoriously prone to attempt only short-term interventions, since their mandates are usually of relatively short duration. Long-term issues may not attract policy makers because the results of any policy intervention may be decades away.
These questions lie at the heart of the need to correctly identify the problem or opportunity. No policy response is likely to be effective without a clear defi nition of the issue. The following elements need to be considered in defi ning a problem:
- Who has identifi ed the problem, and why should it be seen to be a problem? Many problems exist, but few are taken up because they are not brought before a wide audience.
- Is there agreement on the problem? If there is no agreement that a problem exists, it is unlikely that a strong policy response will be forthcoming. Effective policies are more likely to be formulated if there is widespread recognition of a problem and its causes. A problem for the Kyoto Accord on global warming is that decision makers in the USA have not been convinced that the problem is due to human-induced carbon dioxide emissions.
- Is it an issue that can be addressed by public policy? The price of oil is regarded by many as a problem, but individual countries have no power to affect the price of this commodity.
- Is it too soon to develop a policy? This argument was used by the lobby in California that opposed stricter emission controls on vehicles in the early 1990s, based on the argument that the technology of alternative energyfor vehicles was not suffi ciently advanced.
- Is the problem seen differently by groups with different values? Environmentalists see many transport issues differently than many other interest groups. Divergence of opinions may affect how the problem is addressed.
- Is the problem fully understood? Do we know the causal relationships that may be necessary to provide a solution? Transport and development, and the role of transport in global warming are issues around which there is a debate.
- Can the relationships between the factors that make up the problem be quantifi ed? Problem defi nition is better when it is possible to measure the scale and scope of the issues involved.
In defi ning the problem or opportunity and to help address the questions above, background studies are required. The state of affairs needs to be described which will identify the actors, the issues and the possible means that are available. It is also important to forecast trends in order to identify whether the issue is likely to change.
Policy objectives and options
The eventual success of a policy depends upon establishing clear goals. If there are multiple objectives they must be consistent. They must be fl exible enough to change over time as the circumstances evolve. In simple terms the objectives must:
- Identify the present conditions and situation.
- Indicate what the goals are.
- Identify the barriers to achieving the goals.
- Identify what is needed from other agencies.
- Determine how success will be judged.
- Identify what steps are required to achieve success.
Having defi ned the problem and objectives, policy options must be formulated and evaluated. In many cases more than one solution has to be considered for policy adoption. The objectives may be realized in many different ways. Best practices from other jurisdictions may be considered, and all other possible solutions need to be considered. By evaluating the options it may be possible to identify the one that best meets the goals that have been established and at the same time is the best fi t for local circumstances. These types of evaluations are referred to as ex ante, because the outcomes are being assessed even before the policy is put into practice. Although one can never completely anticipate the outcome of different prospective policy options, ex ante evaluations are capable of bringing to light what problems may develop when the preferred option is implemented. Thus, when the future policy is to be evaluated (ex post), problems of data, reporting, and identifi cation of success criteria may have already been anticipated and resolved through an earlier ex ante assessment.
Many types of evaluation methods are employed in both ex ante and ex post assessments. These include cost-benefi t analysis, multi-criteria analysis, economic impact and Delphi forecasting. Because evaluation takes place at several of the steps in the policy process, it is now regarded as a critically important issue. New ideas involving managing the policy process include performance-based management, where evaluation is built into the entire process (Picciotto, 1997). This means that in the policy process a great deal of attention has to be paid to how the goals, results, and benefi ciaries are to be measured. The selection of indicators has to be agreed upon by policy managers from the inception.
Policy implementation
The implementation of the selected option represents a critical aspect of the policy process. The most carefully crafted policy that is widely accepted by those it affects can fl ounder because of improper implementation. It is impossible to defi ne an optimal implementation procedure because of the wide range of socio-economic circumstances that policies are applied to, and also because of the diversity of policies themselves. However, a ten-step model of policy implementation can be considered (Hogwood and Gunn, 1984):
1 Policies must not face insurmountable external constraints. This means that the policy must not exceed the jurisdictional or constitutional limits of the agency. This is a common issue in federal states, where different transport modes may be under different jurisdictions. One of the factors that impeded the success of Montreal's second airportat Mirabel was that the Provincial government, which had opposed the site selected by the Federal government, refused to build an expressway to provide better access to the city. Other examples include cases where the transport issue cannot be resolved because of international borders. However, transnational agreements, especially within the European Union, have considerably reduced external constrains in transport policy implementation.
- 2 In implementing the policy there must be an adequate time frame and resources. The policy may be appropriate, but may fail because its implementation took longer or was more expensive than budgeted. A recent example is that of airport and port divestiture in Canada, where the two policies had similar goals but different implementation procedures (Dion et al., 2002). Airports had access to much greater fi nancial assistance to carry out the transfer process; that of the ports was much smaller. As a result the port policy took much longer to be carried out.
- 3 The implementing agency must have adequate staff and resources to carry out the policy. A growing problem with environmental legislation is that the agencies do not have the means to ensure guidelines and standards are enforced. This has been a particular problem for many of the East European countries being admitted into the EU in 2004 that have to adopt stricter standards than before (Caddy, 1997).
- 4 The premises of policy and theory must be compatible. At one time, public ownership was seen as a valid policy alternative. Today, it may be a valid option in theory in some circumstances, but in most countries it is not politically acceptable.
- 5 Cause-and-effect relationships in the policy must be direct and uncluttered. A successful policy must be seen to be based on clear and unambiguous relationships. Complex policies are more likely to be misunderstood. It took many years for the new urban transport policy of the USA to be implemented. The Intermodal Surface Transportation Effi ciency Act of 1991 (ISTEA) was an extremely complex piece of legislation that left many local agencies who were required to carry out the Act quite perplexed (Paaswell, 1995). It required simplifi cation under the 1998 Transportation Effi ciency Act for the Twenty-fi rst Century (TEA21).
- 6 Dependency relationships should be kept to a minimum. If the agency in charge of implementing the policy has to rely on others to carry it out, the authority will become more fragmented. The implementing agency will become more dependent on others with not necessarily the same interests.
- 7 The basic objectives of the policy need to be agreed upon and understood. All actors in the policy process must possess a clear understanding of the policy and what is required to carry it out. It goes without saying that all those involved must understand the policy and have knowledge about their roles in carrying it out. Information and training are essential elements in the policy process.
- 8 Tasks must be specifi ed in an appropriate sequence. Implementation is a process with connected steps from conception to the end. If the steps are not carried out in the correct sequence the policy may fail. Diffi culties may arise, for example, if evaluation is completed without the indicators of success being agreed upon beforehand, or if another agency is involved before necessary pre-conditions for its participation have been completed.
- 9 Communication and coordination need to be on the same wavelength. Those implementing the policy have to possess the same information base, have to interpret it in the same way, and to communicate well with each other.
- 10 There must be compliance. Those agencies involved in implementing the policy must work towards total compliance. Many times policies are formulated but their compliance is lacking (see steps 3 and 7 above).
Policy evaluation and maintenance
The implementation stage is not the fi nal step in the policy process. The effectiveness of the policy needs to be assessed after a certain period of time, and steps must be taken to ensure that there are resources and means to maintain a successful policy. In the past, this tended to be overlooked, and after a while policies would be sidetracked by other newer initiatives. The long-term effect was the presence of many different policy initiatives, frequently with confl icting goals. Prior to the ISTEA, US federal highway policy was marked by an accumulation of interventions, the so-called "entitlements" that were added one after the other, with little thought as to compatibility or integration with other funding (Paaswell, 1995). The result was that policies in place frequently confl icted with each other in terms of goals or implementation measures.
On-going program evaluation is thus central to the maintenance of policy. This has tended to be a diffi cult issue for managers who today fi nd their programs being assessed by methods and data requirements that were never built into the policy initially. Performance-based management has become an essential tool in the policy process as a result (Picciotto, 1997). Under this system, evaluation is built into all stages of the policy process, and indicators are agreed upon by the managers who carry out the programs as well as the units that undertake evaluation.
Concept 3 – Transport planning
The traditional transport planning process
Transport planning is usually focused on specifi c problems or on broad transport concerns at a local level. It has traditionally been a preoccupation of lower tier governments, such as the state or municipality. Because of this fact, transport planning is most developed in the urban sphere, and it is there where most experience has been gathered. The planning process, however, has a number of similarities with the policy process. Identifying a problem, seeking options and implementing the chosen strategy are essential steps in planning too. Because it tends to deal with localized problems, the solutions adopted in transport planning tend to be much more exact and specifi c than policy directives.
Many aspects and issues involved in urban transport planninghave already been covered in Chapter 7. For a long time it was a fi eld dominated by traffi c engineers who gave it a distinctly mechanistic character, in which the planning process was seen as a series of rigorous steps undertaken to measure likely impacts and to propose engineering solutions. There were four major steps: trip generation, trip distribution, modal split , and route selection. They involved the use of mathematical models, including regression analysis, entropy-maximizing models, and critical path analysis.
There are many reasons why the results of these models should be treated with caution:
- They are only as good as the data they manipulate and in many cases the data is inaccurate or incomplete.
- They are based on assumptions that the mathematical relationships between variables remain constant.
- They can be manipulated to produce the outcome that the analyst knows the client prefers.
- Because the predictions were rarely subjected to subsequent evaluation, their validity is largely questioned, and the modeler is happy to predict the future.
The predictions of future traffi c fl ows produced by the four-stage sequence are then used to identify planning options. Since the most common prediction of the modeling is that present capacities will be unable to cope with traffi c growth, the tendency has
been to produce planning solutions that call for an expansion of capacity. This has been referred to as predict and accommodate. It is the solution that has typifi ed so much urban transport planningfrom the 1940s to the 1980s. It has given rise to the enormous expansion of highwayconstruction that reinforces the dominance of the automobile. Rarely are there postmortems of the prediction models, and as has been learned by empirical observation, the issue of induced demand has distorted the actual traffi c.
Contemporary transport planning
In cities, traffi c problems have increased signifi cantly over the last 50 years, despite a great deal of urban transport planning . There is a growing realization that perhaps planning has failed and that the wrong questions have been asked. Rather than estimate traffi c increases and then provide capacity to meet the expected growth, it is now accepted that what is required is better management of the transport system through new approaches to planning. Just as urban planning requires the inputs of many specialists, so transport planning is beginning to utilize multi-disciplinary teams in order to broaden the scope of the planning process. Planning is still a multi-step process, but it has changed considerably over the last twenty years.
- Goals and objectives. While the goal of traditional transport policy, improving accessibility, is still useful, it has to be considered in the context of other desirable goals. For instance improving safety and health, reducing emissions from vehicles, improving equity, enhancing economic opportunities, improving community livability, and promoting mobility are all valid. But which goal(s) are pursued results in a very different planning process. Defi ning goals becomes a much more complicated stage in contemporary planning. Increasingly goals have turned to consider managing demand, rather than trying to build capacity.
- Options. Given the possible range of goals that transport planners have to consider, it becomes necessary to provide a set of possible options. Several objectives may be desirable, and thus it is important to consider what they imply. Several scenarios may have to be considered, and they must become important components of the planning process.
- Identifi cation of actors, institutions, and stakeholders. Given that transport planning has the potential to infl uence so many elements of society – economic wellbeing, environmental conditions, social integration – it is important that those affected by the transport problem and its potential resolution should be identifi ed so that they can be engaged. This would be a much wider list of affected parties than simply those involved in transportation activity itself, and requires recognizing a role for citizen participation.
- Predicting outcomes, identifying benefi ts, and assessing costs. The stage of predicting the outcomes for each of the options is a critical step in the process. Models continue to play an important role, but whereas the traditional models were based on the number of trips, increasingly modeling is becoming more activity based. Transport is seen in the context of scheduling household decisions in time and space. Demographic and social data are used extensively, and the mathematical models have become more sophisticated. Nevertheless there are roles for other types of analyses, including non-objective forecasts. The predicted outcomes must then be assessed as to their benefi ts and costs. These may be expressed in monetary terms, but many transport planningsituations call for measurement in other terms, such as visual impacts, environmental dislocations, and employment impacts.
• Choosing a course of action. Evaluation of the scenarios has to consider the costs and benefi ts from the frequently confl icting perspectives of the stakeholders and actors. Extensive public consultation may be required. The information has to be disseminated and explained so that an informed public can participate in the debate. Ultimately it will be the politicians who decide, but they are swayed by the strength of the arguments presented by the transport professionals, and in publicly contentious cases by pressure brought to bear by citizens groups.
Transport demand management
In rejecting the former paradigm of building capacity, transport planners have turned increasingly to managing both demand and the transport system. Building roads has produced a car-oriented society in which the other modal alternatives have little opportunity to co-exist.
Car ownership is beyond the ability of the transport planner to control directly. But car use and ownership is affected by land use and density, both elements that planners can affect. High population densities, in particular, favor walking, bicycling and public transit use. It is for this reason that a great deal of attention in planning is being paid to densifi cation and integration. This includes concentrating development along wellserved transport corridors (transit-oriented development) and increasing densities in areas undergoing rehabilitation.
Managing the demand for transport is made up of a large number of small interventions that cumulatively can impact on car use, but in particular improve the livability of cities (Victoria Transport Policy Institute, 2005). A sample of well-practiced and successful interventions includes:
- Park and ride. Parking spaces are provided, usually close to an expressway, where drivers can board buses that provide service to the city center. This has become a staple feature in the outer zones of many US and British cities. Its success is variable, however, and there is some evidence from the UK that park and ride may actually increase car use, as people who may have used regular bus services now use their cars to drive to the car parks (Parkhurst and Richardson, 2002).
- Traffi c calming. Measures that seek to reduce the speed of vehicles in urban areas, such as speed bumps and street narrowing. For residential streets, the goal is to make their use by car drivers unattractive because of the obstacles; for thoroughfares, the objective is to reduce the average speeds. The measures indicate the need for much greater attention to street design and layout (Ewing, 1999).
- Priority lanes for buses and high occupancy vehicles. Lanes on major thoroughfares and expressways that are reserved for buses, taxis and passenger vehicles with several occupants. This has become an important feature of transport planningin North America, where major highway expansion projects offer priority lanes. The goal is to encourage use of buses and high occupancy vehicles that can be seen to travel at higher speeds along the reserved lanes by other drivers who may be stuck in traffi c jams.
- Alternative work schedules. Encouraging work hours other than the dominant 9 to 5 schedule. One of the great problems in transport planning is that demand is concentrated in two main peak periods. In the past, efforts were made to meet this demand by increasing road capacity, which was never suffi cient, and resulted in an under-use of the capacity the other 20 hours each day. Promoting fl exible schedules and encouraging telecommuting are policies that are seeking to spread out the demand
for transport over more hours and even reducing the demand altogether (Janelle and Gillespie, 2004).
- Promoting bicycle use. In some countries, particularly the Netherlands, the bicycle is an important mode of travel. It is a green and healthy mode, but in automobiledependent cities, the bicycle does not share the roads easily with trucks and cars. Encouraging greater use of the bicycle requires signifi cant planning adjustments, such as the provision of bicycle lanes and bike stands.
- Car sharing. Encouraging drivers to share car use with neighbors or co-workers.
- Enhancing pedestrian areas. In most cities, vehicles dominate the streets. In many areas of high population density, the quality of life (enhanced safety, less pollution, etc.) and the visual attractiveness of streetscapes can be enhanced by excluding vehicles from streets altogether, or limiting access to public transport vehicles. In Europe, this has become a distinctive feature of the historic cores of many cities.
- Improving public transit. For 50 years or more, public transit use has declined in most cities. Yet it is the only major alternative to the car in these cities, and thus enhancing the use of transit has become a major planning objective. Improvements include making transit more attractive, by improving bus schedules and improving the appearance and comfort of transit vehicles and stations. At the same time efforts are under way to widen the range of transit alternatives. These include extending commuter rail services, and constructing new systems such as light and heavy rail modes (Litman, 2005).
- Parking management. Restricting on-street parking, charging higher rates for parking.
Pricing
While planning interventions may have a positive cumulative effect in shaping transport demand, some economists suggest that a more direct approach involving imposing more stringent cost measures on car users is necessary. It is widely accepted that car users pay only a small proportion of the actual costs of their vehicle use. Economists argue that the external costs should be borne by the users. As intuitively rational as this argument may be, there are several problems with its application.
- First, there are diffi culties in measuring externalities, with considerable variations in estimates between different studies. Different types of use, speeds, engines, vehicle weight, driving conditions, etc. make it diffi cult to produce broadly accepted values. Decision makers have diffi culty in agreeing to impose charges when there is a diversity of evidence about external costs.
- Second, there are practical diffi culties in collecting these costs. One of the easiest (and most widely used) methods is a gasoline tax. It is a crude approach, however, because it imperfectly distinguishes between driving conditions and engine type – a fuel-effi cient vehicle may have just as high a consumption in heavy urban traffi c as a gas-guzzler in a rural setting.
- Third, is the political diffi culty of imposing such additional costs on the public. In North America in particular, access to "free" roads is regarded as a birthright, and it is intensely unpopular to propose any new forms of revenue generation that hints at additional taxation.
The effectiveness of economic controls is evident by the experience of Hong Kong, where, despite high incomes, car ownership and use remains at a very low level. This is due in the main to the high cost of parking. An even more drastic example is Singapore, where extreme measures limiting car purchases, high vehicle licenses, electronic tolls on highways, and cordon pricing in the downtown area have restrained car use (Goh, 2002).
The use of pricing mechanisms may be less in other countries, but the trend towards greater application of some forms of tolling is accelerating. Cordon pricing has been applied in a number of jurisdictions, especially in Norway in Oslo, Bergen and Trondheim. Under cordon pricing, access to certain areas, usually the CBD, is tolled. The most famous application was the decision to charge private vehicles for entry into Central London in early 2003, a program that has proved to be successful, despite a great deal of opposition.
Another form of charging is the imposition of tolls on new highways and bridges. In North America, the public had become used to the notion that highways are "free", a legacy of the Interstate Highways Act, funded largely by Congress. In both Canada and the US, legislation now permits private companies to build and operate private roads and bridges, and to collect tolls to cover costs. In Canada, Highway 407 outside Toronto and the Confederation Bridge linking Prince Edward Island to the mainland are examples of tolled facilities developed and operated by private corporations. The same trend applies to developing countries such as China where many new roads and bridges are toll based.
Another form of pricing is congestionor fair pricing. Here certain lanes of a highway are tolled, but at variable rates. When traffi c is moving freely, the charges for the tolled lanes are nil. But as traffi c builds up and speeds are reduced, the costs of using the reserved lanes increase. Collection of the tolls is electronic, and drivers are informed of the current charges by large signs. Drivers are given a choice therefore, to stay in the slower lanes for free, or move to the tolled lanes at a cost that is proportionate to the speed on the congested lanes. This system is now in place in several US states, after successful tests in California and Texas.
Intelligent vehicles and intelligent highways
Technology is seen by many transport planners as a solution to a wide range of transport problems. This is an approach that has achieved wide acceptance in the USA, where there has always been a strong emphasis on seeking engineering solutions to urban transport problems . It involves using information technologies (ITS) to provide better information and control over traffi c fl ow and individual vehicle use. Many of the solutions involve the application of remote sensing techniques along with ITS.
One of the most promising approaches involves interactive highways. They are a means of communication between the road and driver that warn of approaching road conditions. Warnings include electronic message boards that suggest alternative routes to approaching motorists, and designated radio frequencies that give updated traffi c reports. The system is based on a closed-circuit TV system (CCTV) that records laneby-lane occupancy, volume and speed. At the same time, ramp meters record in real time the amount of traffi c entering the highway . This information is analyzed and processed at a control center that can dispatch emergency equipment to accidents as they happen, and can inform other drivers of road conditions, accidents, construction and delays.
A further technology is emergency signal priority. This is a means of providing emergency vehicles and public transport buses priority at traffi c lights in congested areas. The system allows a vehicle equipped with a system emitter to send a coded infrared message to the system detector, installed at the traffi c intersection. When activated, the
detector receives the coded message and then either holds the existing green light until the vehicle passes through or changes the existing red light to a green light.
ITS is being applied in many further innovative ways to improve the effi ciency of emergency vehicles. For example, in Montreal mathematical models are being used to predict where road accidents are likely to occur given the time of day, traffi c volumes and weather conditions. Ambulances can be assigned to these zones. Once deployed and assigned to a specifi c event, optimal routing is determined and relayed to drivers. When the fi rst responders have identifi ed the extent and type of injuries, the information is relayed to a control center that determines availability of doctors and nurses at which hospital emergency room, and suggests a routing for the ambulance using a least-time model estimation.
ITS is providing many solutions to the problems of road pricing. Toll collection is increasingly using electronic means to collect tolls without requiring vehicles to stop at toll booths. In its simplest form, vehicles equipped with a transponder that emits details of the vehicle are allowed to pass through toll lanes without stopping to pay. Receptors at the booth record the passage and debit the account. This is at the heart of the cordon pricing and most other new toll systems.
This technology, however, is being wedded to global positioning systems (GPS), which is likely to produce radical changes in the way vehicular traffi c is priced. As reviewed by Sorenson and Taylor (2005), this combination of technologies will permit a more effective means of applying road pricing than the road tax. Vehicles will be required to have an on-board unit that includes a GPS receiver, a set of digital maps showing jurisdictional boundaries, an odometer feed, a set of distance rate charges, and a wireless communication system to report billing data. During each trip, the GPS determines the jurisdictional zones, the odometer calculates the distance traveled in each zone, and the computer tabulates the running total of fees, and periodically signals the data to the billing agency. These systems are presently being evaluated in several states in the USA. A comparable system is already in place in Germany, where since late 2004 all truck movements are charged an environmental tax based on distance traveled and vehicle characteristics.
Freight planning
The vast preponderance of transport planning , certainly at the urban level, has been devoted to passengers. The automobile and public transit issues have pre-occupied planners since individual mobility can be a highly political issue (drivers are also voters). Yet freight traffi c represents a signifi cant part of many problems that planning seeks to address. However, the models and data inputs used in transportation planning are of little relevance when applied to freight movements. For example, demographic data, such as household size, the backbone of passenger analysis, are irrelevant for freight. The bi-polar daily peak of traffi c movements applies only to passengers, freight movements being distributed in a different profi le over a 24-hour period.
While trucks account for approximately 10 percent of vehicles on the road, their size, low maneuverability, noisiness, and high pollution output make their presence particularly objectionable. Truck pick-up and delivery in city centers is particularly problematic because of limited parking. At the same time, trucks are vital to the economy and well-being of society. Commerce is dominated by trucking, and the logistics industry in particular is dependent on road transport for pick-up and delivery. Garbage pick-up, snow removal, and fi re protection are among many essential services that are truck oriented.
Planning for freight movements is still in its infancy. As a largely private sector activity, freight transportis diffi cult to control and many of the decisions that affect trucking are made by the industry itself. The emergence of large logistics /distribution centers on the outer fringes of metropolitan areas is taking place without public control or oversight. In Europe, some attempt to manage such development by establishing publicly-promoted freight villages has only had limited success.
Several cities are seeking to limit trucking as pressures keep mounting up. In many jurisdictions, limits on heavy trucks in urban areas are in place and there are restrictions on the times of delivery and pick-up, which in some European cities extend to the exclusion of all trucks in the urban core during daytime hours. The question remains about constraining urban freight circulation while not impairing the economy.
All these steps are tackling the problem at the edges. In many cities there are no census data on freight traffi c, so that planning in the few cases where it takes place is inevitably hit and miss. There needs to be a much greater focus on freight planning overall, since it is almost universally recognized that freight transport is important.
Method 1 – Cost–benefi t analysis
The framework
Cost–benefi t analysis (CBA or COBA) is a major tool employed to evaluate projects. It provides the researcher with a set of values that are useful to determine the feasibility of a project from an economic standpoint. Conceptually simple, its results are easy for decision makers to comprehend, and it therefore enjoys a great deal of favor in project assessments. The end product of the procedure is a benefi t/cost ratio that compares the total expected benefi ts with the total predicted costs. In practice, CBA is quite complex because it raises a number of assumptions about the scope of the assessment, the timeframe, as well as technical issues involved in measuring the benefi ts and costs.
Before any meaningful analysis can be pursued, it is essential that an appropriate framework be specifi ed. An extremely important issue is to defi ne the spatial scope of the assessment. Transport projects tend to have negative impacts over short distances from the site, and broader benefi ts over wider areas. Thus extending a runway may impact severely on local residents through noise generation, and if the evaluation is based on such a narrowly defi ned area, the costs could easily outweigh any benefi ts. On the other hand, defi ning an area that is too broad could lead to spurious benefi ts. "The aim of the study area defi nition should be to include all parts of the transport network which are likely to include signifi cant changes in fl ow, cost or time as a result of the project" (UN, 2003, p. 17).
Because transport projects have long-term effects, and because the analysis is carried out on a real-term basis, the benefi ts and costs must be assessed using specifi c and pre-determined parameters. For example: when is the project start date, when will it be completed, over what period of time will the appraisal run, and what discount rate will be used to depreciate the value of the costs and benefi ts over the appraisal period? These and other parameters must be agreed upon. Costs and benefi ts are presented in nominal values, i.e. monetary values of the start year and discounted for infl ation over the project period. Because most transport projects are assessed for a 30-year period, employing different discount rates may greatly infl uence the outcomes.
Costs and benefi ts
Costs associated with the project are usually easier to defi ne and measure than benefi ts. They include both investment and operating costs. Investment costs include the planning costs incurred in the design and planning, the land and property costs in acquiring the site(s) for the project, and construction costs, including materials, labor, etc. Operating costs typically involve the annual maintenance costs of the project, but may include additional operating costs incurred, for example the costs of operating a new light rail system.
Benefi ts are much more diffi cult to measure, particularly for transport projects, since they are likely to be diffuse and extensive. Safety is a benefi t that needs to be assessed, and while there are complex issues involved, many CBA studies use standard measures of property savings per accident avoided, fi nancial implications for reductions in bodily injury or deaths for accidents involving people. For example, Transport Canada uses \$1.5 million in 1991 dollars for each fatality saved. One of the most important sets of benefi ts are effi ciency gains as a result of the project. These gains might be assessed by estimating the time savings or increased capacity made possible by the project.
Measurement of other costs and benefi ts
Many other elements relating to social impacts, aesthetics, health and the environment are more diffi cult to assess. The latter, in particular, is a major factor in contemporary project assessment, and usually separate environmental impact analyses are required. Where possible, these factors must be considered in CBA, and a variety of measures are used as surrogates for environmental benefi ts and costs. For example, the commercial losses of habitat destruction and property damage can be estimated; the difference in the values of properties adjacent to airports and those further away are used to assess the costs of noise.
Results
Three separate measures are usually obtained from CBA to aid decision making:
- Net present value (NPV). This is obtained by subtracting the discounted costs and negative effects from the discounted benefi ts. A negative NPV suggests that the project should be rejected because society would be worse off.
- Benefi t–cost ratio. This is derived by dividing the discounted costs by the discounted benefi ts. A value greater than 1 would indicate a useful project.
- Internal rate of return (IRR). The average rate of return on investment costs over the life of the project.
The fi rst two measures are broadly similar, though with signifi cant differences. A project may have a high B/C ratio but still generate a small NPV. The results should be subjected to a sensitivity analysis. This would include considering the robustness of the predictions of costs and benefi ts, and usually involves the identifi cation of aspects that would introduce uncertainty into the predictions. If certain elements are shown to be subject to variations (infl ation, higher fuel charges, etc.), various scenarios would be prepared, and the cost/benefi t values re-evaluated.
References
- Bailey, E.E. and W.J. Baumol (1984) "Deregulation and the Theory of Contestable Markets", Yale Journal on Regulation, 1, 111–37.
- Button, K. (1993) Transport Economics, 2nd edn, Aldershot: Edward Elgar.
- Caddy, J. (1997) "Hollow Harmonisation? Closing the Gap in Central European Environmental Policy", European Environment, 7, 73–9.
- Dion, S., B. Slack and C. Comtois (2002) "Port and Airport Divestiture in Canada: A Comparative Analysis", Journal of Transport Geography, 10, 187–94.
- Ewing, R.H. (1999) Traffi c Calming: State of the Practice, Washington, DC: Institute of Transportation Engineers.
- Goetz, A.R. (2002) "Deregulation, Competition, and Antitrust Implications in the US Airline Industry", Journal of Transport Geography, 10, 1–19.
- Goh, M. (2002) "Congestion Management and Electronic Road Pricing in Singapore", Journal of Transport Geography, 10, 29–38.
- Hogwood, B. and L.A. Gunn (1984) Policy Analysis for the Real World, Oxford: Oxford University Press.
- Janelle, D.G. and A. Gillespie (2004) "Space-time Constructs for Linking Information and Communication Technologies with Issues in Sustainable Transportation", Transport Reviews, 24, 665–77.
- Litman, T. (2005) Rail Transit in America: A Comprehensive Evaluation of Benefi ts, http://www.vtpi. org/railben.pdf.
- Muller, P.O. (2004) "Transportation and Urban Form: Stages in the Evolution of the American Metropolis", in S. Hanson and G. Giuliano (eds) Geography of Urban Transportation, 3rd edn, New York: Guilford.
- Paaswell, R.E. (1995) "ISTEA; Infrastructure Investment and Land Use" in D. Banister (ed) Transport and Urban Development, London: Spon, pp. 36–58.
- Parkhurst, G. and J. Richardson (2002) "Modal Integration of Bus and Car in Local UK Transport Policy", Journal of Transport Geography, 10, 195–206.
- Picciotto, R. (1997) "Evaluation in the World Bank", in E. Chelimsky and W. Shadrish (eds) Evaluation for the 21st Century, Thousand Oaks, CA: Sage.
- Sorenson, P. and B. Taylor (2005) "Paying for Roads: New Technology for an Old Dilemma", Access, 26, 2–9.
- Studnicki-Gizbert, K.W. (1974) Issues in Canadian Transport Policy, Toronto: Macmillan.
- Tolley, R. and B. Turton (1995) Transport Systems, Policy, and Planning, London: Longman.
- United Nations (2003) Cost–Benefi t Analysis of Transport Infrastructure Projects, New York: United Nations.
- Victoria Transport Policy Institute (2005) Transportation Demand Encyclopedia, Victoria: VTPI. www. vtpi.org/tdm/index.php.
Conclusion 10
Issues and challenges in transport geography
In this fi nal chapter some of the main issues confronting transportation today and which are likely to have an even greater impact in the future are reviewed. What are the major questions that will confront future transport geographers, the readers of this book? What role will transport geographers play in addressing future challenges? These are complex questions, and inevitably given the breadth of the fi eld of transport geographythere has had to be a selection of topics. In looking back over the other chapters of this book, three different issues stand out for their present-day importance and their potential to reshape future geographies. Congestion has been selected because it is a feature with profound consequences today, and it is almost certainly an issue that transport geographers will have to deal with in the future. The environment is already infl uencing transportation, and because of increasing pressures from the environment and growing awareness of the problems, it will be a factor of growing importance. The third issue relates to the need to understand the management responses required to cope with future transport developments, and the way that an understanding of spatial relationships can contribute to better management of the system. Finally, the role of geographers in addressing these issues is discussed.
Issues
Congestion
The issue of congestion has been addressed in many chapters of this book. In Chapter 3 it was introduced as an important negative factor on the economy, precipitating delays and lost income. In Chapter 5 it was shown that there is a growing concentration of traffi c in major terminals, which is giving rise to delays and demands for expansion. It was in Chapter 7 where the issue was addressed most clearly, since congestion tends to be an urban phenomenon, as it is in the cities where the greatest amount of traffi c congestion occurs. In Chapter 9 relieving congestion was identifi ed as an important planning goal, with the lack of success of earlier solutions giving rise to a search for new approaches.
The causes of congestion are well understood, even if the solutions are not. Congestion arises from two causes. Most important is when the demand for mobility exceeds the capacity to support it. It can also occur when random events bring about a temporary disruption to service, such as an accident or a natural hazard such as fl ooding. In the case of the second set of causes, it is possible to mitigate their effects if the occurrence is frequent, such as accidents, or if the risks are great, as for the example of fl ooding in a fl ood plain. In the fi rst case a solution is to increase capacity. However, as has been shown, increasing capacity engenders a hidden demand, so that adding lanes to an expressway tends to attract even more cars. Furthermore, demand is increasing ceaselessly, so that the practicality of this solution may be questioned.
The issue of congestionis likely to remain one of the great ongoing issues in transport geographybecause unprecedented demands for transportation are being generated by a global economythat is ever more dependent upon the transport industry. The growth of demand is likely to have major impacts on the nature and form of the future transport industry.
In the short term at least, road transport is likely to continue its domination of the transport industry. There are two basic reasons for this assertion. In the developed world, cars and trucks already dominate the market, and the spatial patterns of people, industries and services have adjusted themselves somewhat to the demands of these modes. Such low density, space extensive patterns are pushing the traffi c congestion ever further out from urban centers, and make it very diffi cult for other higher capacity modes to compete. At the same time, the demand for mobility is growing as a result of the rapid industrialization of countries such as Chinaand India . There too a modal shift is occurring in favor of road transport. Increasing prosperity in these countries represents a great potential for growth in road transport.
Congestion is not limited to internal urban-generated traffi c. International trade is likely to continue to be dominated by maritime transport(in terms of weight) and air transport(in terms of value). This has already led to a concentration of traffi c at a relatively small number of hubs, which are capable of extracting scale economies. For example, the 20 largest container ports handled more than 52 percent of global traffi c in 2002. The traffi c concentration however is already producing capacity problems in many of these hubs. International tradeis expected to grow at a faster rate than the global economy , and thus the threat of hub congestion is likely to grow still further.
For geographers there are a whole range of issues arising out of the growth of demand and the paralysis of congestion . Here, they are grouped into two categories: fi rst are a series of questions surrounding how to provide solutions, second are the effects on future spatial patterns.
Providing solutions: fi nancing
Regardless of the specifi c solutions to congestion that are considered, increasing demand is placing unprecedented demand for investments in transport. A major question confronting all countries of the world is how to fi nance the construction of transport infrastructures. Governments have traditionally been the primary source of funding in the transport sector, but the costs of keeping pace with the growth in demand are making it diffi cult for even the richest countries to countenance public funding on the scale required.
Public-private partnerships and completely private solutions are one set of solutions. For many developing countries this is the only solution, since public fi nances are inadequate to the task. Thus, in the future, a greater private involvement in the provision of transport infrastructure is to be expected. Several models are already well tested: BOT (Build-Operate-Transfer), where the private sector builds and operates a facility or system for a period of time, but then transfers it back to the government after an agreed period; BLT (Build-Lease-Transfer), where after building the facilities, it is leased for a fi xed period for operation, and fi nally transferred back; ROT (Rehabilitate-Operate-Transfer), where the private party refurbishes an existing facility to be operated for a term prior to being turned back to the state.
The diffi culties are not to be underestimated, however. Most transport infrastructure projects are long term, but are typifi ed by the heaviest capital investment requirements
being incurred over a short initial phase. Most private enterprises cannot take a longterm perspective, because they need to cover their expenses over a short period of time. Attempts to involve the private sector in transportation infrastructures such as roads and bridges in North America have not been very successful.
Another approach that is gaining momentum is charging for use of transport infrastructure. As discussed in Chapter 9, pricing is becoming an important feature of transport planning in urban areas. Whether it is cordon pricing, congestion pricing, or tolling, drivers are being forced to pay for their use of roads. With the growing concerns over the environment, charging for the externalities of transport modes is becoming a reality in many jurisdictions. How effective are these alternatives? What effects do they have over travel behavior?
Providing solutions: alternative methods
In the past, the solution to congestionwas to provide more capacity by building more infrastructure. As mentioned in Chapter 9, such a response depended heavily on engineering solutions. As has been learned over the last few decades, the model of "predict and accommodate" has not worked well. It is now recognized that a multidisciplinary approach is required. It is recognized that there will still be a heavy reliance on engineering skills to design and construct infrastructure and systems, and to develop further technological innovations required for the "intelligent highway ". However, transport policy and planning requires a broader perspective, one that considers different goals and alternatives, responds to different needs for mobility, and one that seeks ways to manage demand. Under what conditions and in what types of locations can travel demand be modifi ed? Does the current emphasis on proposing densifi cation as a solution to reducing car dependence work? How might freight transport be better integrated in the urban environment?
Assessing the impacts
Congestion is a phenomenon that is spatially bound. It takes place in specifi c locations with impacts at a multitude of scales, from a particular highwayintersection that may delay traffi c over a few hundred meters, to blockage in a port that may disrupt the fl ow of goods over half a continent. Each event produces a spatial response, from the car driver who searches out an alternative route in future to the shipper who selects a different mode for succeeding shipments.
Increased demand and the rising likelihoods of congestion will intensify new spatial responses and thus it appears very likely that new spatial fl ows and structures will come into being. What will be the effects? What kinds of impact will be evident at the local, regional or global scales? Will congestion be suffi cient to counteract the strong forces favoring concentration? Already there is evidence in air transportfor growth in passengers and freight in some smaller airports. Will congestion in the newly industrializing countries act as a brake on development?
Environmental challenges
As discussed in Chapter 8, the issue of sustainability has become an increasingly important consideration for the transport industry. It is now broadly recognized that there needs to be a balance between economic effi ciency, social factors and the environment. Of these three, the issue of economic effi ciency has always been to the forefront, and governments have been important in regulating social conditions (safety, security, and working conditions). Despite the strong historic relationships between transport and the environment, the latter has tended to be overlooked by the industry. This is changing, and environmental issues are likely to play an ever more important role in the transport industry.
- Transport and energy. With increases in energy costs, signifi cant adjustments in transport modes may be expected in the future. While technologies may make alternative fuel vehicles a commercial option to the internal combustion engine, the main question is the effect of higher prices on cars and trucks. If the costs are passed on to users, will the global production systems that depend upon cheap transport be impacted? How will the logisticsindustry that exploits the most energy ineffi cient modes be affected? Will a modal shift to more energy effi cient modes, such as rail or shipping, take place? What forms of transport and mobility will take shape as the energy transition away from fossil fuels takes place?
- Transport and atmospheric pollution. Air quality standards are being implemented with increasing rigor in more and more countries around the world. There are still striking differences between regions and between the modes. For example, most of the countries of the developing world still have to go a long way to fi xing and enforcing standards. In North America, passenger vehicles are more rigorously controlled than trucks, and ships are much less controlled than other modes. However, the trend is towards greater control over emissions. What will be the modal effects and the impacts on modal competition? Despite international accords, global warming is unlikely to be overturned in the immediate future. Already, a higher incidence of severe climatic events such as hurricanes and storms are being ascribed to atmospheric warming. Which regions and what transport systems are most likely to be impacted?
- Transport and water quality. The contribution of transport to the pollution of rivers and oceans is considerable, and is only recently being addressed by international legislation. Considerable progress has been made in a number of areas, such as ballast water, waste and oil spills. As the legislation increases in its comprehensiveness, the more the transport industry is impacted. This is particularly evident in matters relating to dredging , where environmental constraints are placing a growing fi nancial burden on ports that are seeking to deepen channels in order to keep pace with the growth of vessel size. Will these constraints serve to reduce the competitiveness of some ports? Will increased dredging costs bring about a break in the growth of vessel size? Similar questions arise out of coastal zone legislation, especially the provisions for protecting wetlands.
- Transport and land take. Increased demand for transport is already placing enormous pressures on new infrastructures. Many of these transport facilities such as airports and ports require very large amounts of land for their own internal operations and for the external transport links that have to be provided. A fundamental question is, can the environment and society afford to provide sites of the scale required by the transport industry? Will the transport industry have to move away from its preferred model of massive hubs and load centers?
Management of transport systems
The transportation industry is changing so signifi cantly in form and function that it is easy to overlook the very important changes in the way it is organized and managed. Yet it is through different management practices that the spatial manifestations of the industry are expressed. It is perhaps easiest to see the changes in management through
the lens of governance, where an industry that used to be largely managed and controlled by the state has become increasingly controlled by the private sector. The privatization of transport companies and infrastructures has been an important feature of the last decade, and is likely to continue further into the present century. However, there are still many questions about the role of the state in transportation. Under what conditions and in what circumstances should continued state control be maintained and even strengthened? What are the best models of public-private partnerships in the transport industry?
The growing role of the private sector over an industry that is becoming global and multi-functional has necessitated a shift in management and ownership relationships that are still evolving. They include:
- The emergence of horizontally linked global corporations that through a series of acquisitions and mergers have bought up similar operating companies in different markets. A good example is the portterminal operators, such as Hutchison Port Corporation, a Hong Kong based fi rm with major investments in Europe, China and the Americas.
- The development of vertically integrated fi rms that have grown by merger and acquisition to control several segments of the transport chain. Examples include A. P. Moller, a company that controls the world's largest containerfl eet, an airline, terminal operating activities, trucking, barge, railroad services and logistics services in many parts of the world.
- Intermediaries that provide transport services on a global scale, without direct ownership of infrastructure. Third-party logistics companies such as Kuhn and Nagel, Schenker and Excel operate in many markets and are major actors in the transport chain.
- Alliances, informal groupings of transport providers that pool resources and offer joint services between major global markets. Examples include the One World and Star airline alliances.
At the same time, transport is being increasingly integrated in global production systems. It is becoming an integral part of production and distribution chains. Can it still be considered a derived demandtherefore? What are the reciprocal relations between transport and production/distribution systems? How are Walmart's distribution networks shaped by transport, and how is transport impacted by Walmart?
These management and business structures give rise to distinct patterns of spatial organization, with different operating practices. The impact of South West Airlines on the spatial structure of the US airline industry has been considerable, for example, and the operational interests of a vertically integrated enterprise are different than one that is horizontally linked. This highlights the need to understand the nature of the organization of the businesses involved in transport as a means of explaining existing patterns and predicting their future forms. The concentration of traffi c (and resultant congestion) is as much explained by the organization of transport fi rms as it is by traditional explanations involving demand and capacity. In turn, the organization of the global fi rms themselves is shaped by the conditions of local spatial markets. A distinct geography of transport fi rms exists, a geography that is still largely terra incognita.
The role of geographers
Geographers have played a relatively small role in the fi eld of transport studies, a fi eld that has been dominated by engineers and economists. This was due in part to the needs of the industry being focused on providing infrastructures and technologies, at what cost and benefi ts and at what level of pricing. The contemporary industry is much more complex, with issues as varied as safety, aesthetics, working conditions, gender, deprivation, the environment, governance and heritage being necessary considerations. A much broader set of skills are required therefore, and transport studies today are essentially multi-disciplinary. Geographers have important opportunities to contribute to transport studies, transport planningand transport operations, in part because of the breadth of the approach and training.
It is also a fundamental fact that transport is a spatial activity. It has always been a space adjusting service, but over the last few decades it has become increasingly global in scope. Contemporary transport operates at a wider range of scales than ever before. There are complex interactions between the local and the global. For example, the issues surrounding the expansion of an airport are usually decided at the local level, and the impacts are likely to be felt locally. However, the effects on passenger and freight fl ows may have a global impact. The spatiality of transport and the many scale levels at which it operates are elements that are the particular concerns of geographers. No other discipline has as its core interest the role of space in shaping human activities.
One reason for the success of engineers and economists in transport studies and applications is that their training has been rigorous in the application of mathematics and multivariate statistics. They have demonstrated the ability to provide precise answers to the questions that decision makers have required – what to build, at what cost, with what cost effects. A culture has evolved in the transport industry that unless it can be quantifi ed it is of little value. Many transport geographers have the quantitative skills that have made their work accepted by the broader scientifi c community. There is little doubt that training in mathematical programming, graph theory, and multivariate statistics is required. However, there are newer techniques that provide geographers with opportunities to contribute to transport studies. GIS-T , in particular should be an essential element in the training of a transport geographer. The multi-scalar, multivariate nature of the transport industry makes GIS-T an invaluable tool, and one that will raise the profi le of geographers in the transportation industry.
One of the great challenges in transport studies is data availability. In many cases, offi cial census and survey data are inadequate or unavailable in the form required. Knowledge of survey techniques and their limitations is an important part of the transport geographer's toolkit. Many of the traditional tools and approaches of geographers are still relevant. They allow us to address problems that are frequently overlooked by other disciplines because of the lack of data. Questionnaires and interviews represent a vital source of information in many situations. Content analysis is extremely useful in providing quantifi ed data from non-quantifi ed sources. At the same time, fi eld work provides the opportunity to obtain detailed understanding of the particularities of the local conditions that cannot be obtained from reading texts and offi cial documents.
The prospects for transport geographyand transport geographers appear to be excellent. Look back at the subject matter and topics covered in this book. They indicate an industry that is growing in signifi cance and changing. The kinds of issues that are achieving greater importance – sustainability, congestion, governance and management – are ones to which geographers have the opportunity to contribute. As the transport industry becomes more complex, old approaches, focusing on a narrow range of factors, have to be replaced by more nuanced analysis and solutions. In the transport industry itself, in public planning, and in research institutions, the scope for geographers appears bright. We hope that this book has ignited in you the spark of interest to continue your studies in transport or to recognize the importance of transport in the subject fi eld you choose to pursue.

Many of the glossary terms are adapted from the Bureau of Transportation Statistics, the European Conference of Ministers of Transport, the Intermodal Association of North America and the Mineta Transportation Institute.
access
The capacity to enter and exit a transport system. It is an absolute term implying that a location has access or does not.
accessibility
The measure of the capacity of a location to be reached by, or to reach different locations. It is a relative term. The capacity and the structure of transport infrastructure are key elements in the determination of accessibility.
aerodrome
A defi ned area on land or water (including any buildings, installations, and equipment) intended to be used either wholly or in part for the arrival, departure, and movement of aircraft. Aerodromes may include airports, heliports, and other landing areas.
aframax
A tanker of standard size between 75,000 and 115,000 dwt. The largest tanker size in the AFRA (Average Freight Rate Assessment) tanker rate system.
agglomeration economies
See economies of agglomeration.
air cargo
Total volume of freight, mail and express traffi c transported by air. Includes the following: freight and express-commodities of all kinds, includes small package counter services, express services and priority reserved freight.
air carrier
Commercial system of air transportation, consisting of domestic and international scheduled and charter service.
air space
The segment of the atmosphere that is under the jurisdiction of a nation or under an international agreement for its use. They include two major components, one being land-based (takeoffs and landings) and the other air-based (mainly composed of air corridors). These corridors can superimpose themselves to altitudes up to 22,500 meters. The geography of air transport is limited to the use of predetermined corridors.
air transportation
Includes establishments that provide domestic and international passenger and freight services, and establishments that operate airports and provide terminal facilities.
airport
1) An area of land or water that is used or intended to be used for the landing and takeoff of aircraft, including its buildings and facilities, if any; 2) A facility used primarily by conventional, fi xed-wing aircraft; 3) A facility, either on land or water, where aircraft can take off and land. Usually consists of hard-surfaced landing strips, a control tower, hangars and accommodations for passengers and cargo; 4) A landing area regularly used by aircraft for receiving discharging passengers or cargo.
alternative fuels
Low-polluting fuels which are used to propel a vehicle instead of high-sulfur diesel or gasoline. Examples include methanol, ethanol, propane or compressed natural gas, liquid natural gas, low-sulfur or "clean" diesel and electricity.
Amtrak
Operated by the National Railroad Passenger Corporation of Washington, DC. This rail system was created by President Nixon in 1970, and was given the responsibility for the operation of intercity, as distinct from suburban, passenger trains between points designated by the Secretary of Transportation.
arterial street
A major thoroughfare, used primarily for through traffi c rather than for access to adjacent land, that is characterized by high vehicular capacity and continuity of movement.
average vehicle occupancy (AVO)
The number of people traveling by private passenger vehicles divided by the number of vehicles used.
average vehicle rideship (AVR)
The ratio of all people traveling by any mode, including cars, buses, trains and bicycles (or telecommuting), in a given area during a given time period to the number of cars on the road. A key measure of the effi ciency and effectiveness of a transportation network – the higher the AVR, the lower the level of energy consumption and air pollution.
balance of payments
A record of receipts from and payments to the rest of the world by a country's government and its residents. The balance of payments includes the international fi nancial transactions of a country for commodities, services and capital transactions.
balance of trade
The difference between a country's total imports and exports. If exports exceed imports, a positive balance of trade exists.
barge
A non-motorized water vessel, usually fl at-bottomed and towed or pushed by other craft, used for transporting freight. Predominantly used on river systems.
barrel
A unit of volume equal to 42 US gallons (or 159 liters) at 60 degrees Fahrenheit, often used to measure volume in oil production, price, transportation and trade.
base fare
The price charged to one adult for one transit ride; excludes transfer charges, zone charges, express service charges, peak period surcharges and reduced fares.
254 • Glossary
berth
A specifi c segment of wharfage where a ship ties up alongside at a pier, quay, wharf, or other structure that provides a breasting surface for the vessel. Typically, this structure is a stationary extension of an improved shore and intended to facilitate the transfer of cargo or passengers.
bill of lading
A document that establishes the terms of a contract between a shipper and a transportation company. It serves as a document of title, a contract of carriage and a receipt for goods.
block
A group of railcars destined to the same location.
bridge
A structure including supports erected over a depression or an obstruction, such as water, highway, or railway, and having a track or passageway for carrying traffi c or other moving loads, and having an opening measured along the center of the roadway of more than 20 feet between undercopings of abutments or spring lines of arches, or extreme ends of openings for multiple boxes; it may also include multiple pipes, where the clear distance between openings is less than half of the smaller contiguous opening.
British thermal unit (Btu)
The amount of energy required to raise the temperature of 1 pound of water 1 degree Fahrenheit (F) at or near 39.2 degrees F and 1 atmosphere of pressure.
bulk cargo
Refers to freight, both dry or liquid, that is not packaged such as minerals (oil, coal, iron ore) and grains. It often requires the use of specialized ships such as oil tankers as well as specialized transshipment and storage facilities. Conventionally, this cargo has a single origin, destination and client. It is also prone to economies of scale.
bulk carriers
All vessels designed to carry bulk cargo such as grain, fertilizers, ore and oil.
bulk terminal
A purpose-designed berth or mooring for handling liquid or dry commodities, in unpackaged bulk form, such as oil, grain, ore, and coal. Bulk terminals typically are installed with specialized cargo handling equipment such as pipelines, conveyors, pneumatic evacuators, cranes with clamshell grabs, and rail lines to accommodate cargo handling operations with ships or barges. Commodity-specifi c storage facilities such as grain silos, petroleum storage tanks, and coal stock yards are also located at these terminals.
bus (motorbus)
Any of several types of self-propelled vehicles, generally rubber-tired, intended for use on city streets, highways, and busways, including but not limited to minibuses, forty and thirty-foot buses, articulated buses, double-deck buses, and electrically powered trolley buses, used by public entities to provide designated public transportation service and by private entities to provide transportation service including, but not limited to, specifi ed public transportation services. Self-propelled, rubber-tired vehicles designed to look like antique or vintage trolleys are considered buses.
bus, trolley
An electric, rubber-tired transit vehicle, manually steered, propelled by a motor drawing current through overhead wires from a central power source not on board the vehicle. Also known as "trolley coach" or "trackless trolley".
cable car
An electric railway operating in mixed street traffi c with unpowered, individuallycontrolled transit vehicles propelled by moving cables located below the street surface and powered by engines or motors at a central location not on board the vehicle.
cabotage
Transport between two terminals (a terminal of loading/embarkment and a terminal of unloading/disembarkment) located in the same country irrespective of the country in which the mode providing the service is registered. Cabotage is often subject to restrictions and regulations. Under such circumstances, each nation reserves for its national carriers the right to move domestic freight or passenger traffi c.
canal
An artifi cial open waterway constructed to transport water, to irrigate or drain land, to connect two or more bodies of water, or to serve as a waterway for watercraft.
Capesize
Refers to a rather ill-defi ned standard for ships which have the common characteristic of being incapable of using the Panama or Suez canals, not necessarily because of their tonnage, but because of their size. These ships serve deepwater terminals handling raw materials, such as iron ore and coal. As a result, "Capesize" vessels transit via Cape Horn (South America) or the Cape of Good Hope (South Africa). Their size ranges between 80,000 and 175,000 dwt.
carbon dioxide (CO2 )
A colorless, odorless, non-poisonous gas that is a normal part of the ambient air. Carbon dioxide is a product of fossil fuel combustion.
carbon monoxide (CO)
A colorless, odorless, highly toxic gas that is a normal by-product of incomplete fossil fuel combustion. Carbon monoxide, one of the major air pollutants, can be harmful in small amounts if breathed over a certain period of time.
carpool
An arrangement where two or more people share the use and cost of privately owned automobiles in traveling to and from pre-arranged destinations together.
carrier
A company moving passengers or freight.
catchment area
Area or region whose economic, political, cultural, social, etc. infl uence is felt over a larger area; it is the radius of action of a given point. In transportation, it consists in the area under infl uence of a focal point towards which centripetal fl uxes converge; an interception zone of several carriers. Also known as "area of infl uence" or "hinterland".
charter
Originally meant a fl ight where a shipper contracted hire of an aircraft from an air carrier, but has usually come to mean any non-scheduled commercial service.
256 • Glossary
class I railroad
An American railroad with an annual gross operating revenue in excess of \$250 million based on 1991 dollars.
Clean Air Act (CAA)
Federal legislation that sets national air quality standards.
coach service
Transport service established for the carriage of passengers at special reduced passenger fares that are predicated on both the operation of specifi cally designed aircraft space and a reduction in the quality of service regularly and ordinarily provided.
combi
A type of aircraft whose main deck is divided into two sections, one of which is fi tted with seats and one which is used for cargo.
commercial geography
Investigates the spatial characteristics of trade and transactions in terms of their cause, nature, origin and destination. It leans on the analysis of contracts and transactions.
commodity chain
A functionally integrated network of production, trade and service activities that covers all the stages in a supply chain, from the transformation of raw materials, through intermediate manufacturing stages, to the market. The chain is conceptualized as a series of nodes, linked by various types of transactions, such as sales and intrafi rm transfers. Each successive node within a commodity chain involves the acquisition or organization of inputs for the purpose of added value.
common carrier
A transportation line engaged in the business of handling persons or goods for compensation and for all persons impartially.
commuter
A person who travels regularly between home and work or school.
commuter bus service
A fi xed route bus service, characterized by service predominantly in one direction during peak periods, limited stops, use of multi-ride tickets, and routes of extended length, usually between the central business district and outlying suburbs. Commuter bus service may also include other service, characterized by a limited route structure, limited stops, and a coordinated relationship to another mode of transportation.
commuter rail
Railroad local and regional passenger train operations between a central city, its suburbs, and/or another central city. It may be either locomotive-hauled or self-propelled, and is characterized by multi-trip tickets, specifi c station-to-station fares, railroad employment practices, and usually only one or two stations in the central business district. Also known as "suburban rail".
comparative advantages
The relative effi ciencies with which countries can produce a product or service.
compressed natural gas (CNG)
Natural gas which is comprised primarily of methane, compressed to a pressure at or above 2,400 pounds per square inch and stored in special high-pressure containers. It is used as a fuel for natural gas powered vehicles, mainly by buses.
conference
An association of ship owners operating in the same trade route who operate under collective conditions and agree on tariff rates.
congestion
Occurs when transport demand exceeds transport supply in a specifi c section of the transport system. Under such circumstances, each vehicle impairs the mobility of others. Urban congestion mainly concerns two domains of circulation, often sharing the same infrastructures.
consignee
A person or company to whom commodities are shipped. Offi cially, the legal owner of the cargo.
consolidated shipment
A method of shipping whereby an agent (freight forwarder or consolidator) combines individual consignments from various shippers into one shipment made to a destination agent, for the benefi t of preferential rates. (Also called "groupage".) The consolidation is then de-consolidated by the destination agent into its original component consignments and made available to consignees. Consolidation provides shippers access to better rates than would be otherwise attainable.
container
A large standard size metal box into which cargo is packed for shipment aboard specially confi gured oceangoing containerships and designed to be moved with common handling equipment enabling high-speed intermodal transfers in economically large units between ships, railcars, truck chassis, and barges using a minimum of labor. The container, therefore, serves as the transfer unit rather than the cargo contained therein.
container on fl atcar (COFC)
The movement of a container on a railroad fl at car. This movement is made without the container being mounted on a chassis.
containerization
Refers to the increasing and generalized use of the container as a means of freight transport . As a standard and versatile means, the container has greatly contributed to intermodal transportation of merchandise and its widespread use; therefore, is responsible for profound mutations in the transport sector. Through reduction of handling time, labor costs, and packing costs, container transportation allows considerable increases in speed of rotation along a circuit and thus entails a better optimization of time and money.
containership
A cargo vessel designed and constructed to transport, within specifi cally designed cells, portable tanks and freight containers which are lifted on and off with their contents intact. There are two types of containerships: full and partial. Full containerships are equipped with permanent container cells with little or no space for other types of cargo. Partial containerships are considered multi-purpose container vessels, where one or more but not all compartments are fi tted with permanent container cells, and the remaining compartments are used for other types of cargo. This category also includes container/ car carriers, container/rail car carriers, and container/roll-on/roll-off vessels.
corporate average fuel economy (CAFE) standards
CAFE standards were originally established by Congress for new automobiles, and later for light trucks, in Title V of the Motor Vehicle Information and Cost Savings Act (15 U.S.C. 1901, et seq.) with subsequent amendments. Under CAFE, automobile
258 • Glossary
manufacturers are required by law to produce vehicle fl eets with a composite salesweighted fuel economy which cannot be lower than the CAFE standards in a given year, or for every vehicle which does not meet the standard, a fi ne of \$5.00 is paid for every one-tenth of a mpg below the standard.
corridor
A broad geographical band that follows a general directional fl ow connecting major sources of trips that may contain a number of streets, highways, transit routes, raillines, or air paths alignments.
costs–insurance–freight (CIF)
The price of a good is a uniform delivered price for all customers everywhere, with no spatially variable shipping price, which implies that the average shipping price is built into the price of a good. The CIF cost structure can be expanded to include several rate zones.
cross-docking
A form of inventory management where goods are received at one door of the distribution center/sorting facility and shipped out through the other door on a very short amount of time without putting them in storage. It consequently contributes in the reduction of operating costs with an increase in the throughput and with a reduction of inventory levels.
crude oil petroleum
A naturally occurring, oily, fl ammable liquid composed principally of hydrocarbons. Crude oil is occasionally found in springs or pools but usually is drilled from wells beneath the Earth's surface.
deadhead
Miles and hours that a vehicle travels when out of revenue service. This includes leaving and returning to the garage, changing routes, etc., and when there is no reasonable expectation of carrying revenue passengers. However, it does not include charter service, school bus service, operator training, maintenance training, etc. For non-scheduled, nonfi xed-route service (demand responsive), deadhead mileage also includes travel between the dispatching point and passenger pick-up or drop-off.
deadweight tons
The lifting capacity of a ship expressed in long tons (2,240 lb), including cargo, commodities, and crew. Refl ects the weight difference between a fully loaded and an unloaded ship.
demand responsive
Non-fi xed-route service utilizing vans or buses with passengers boarding and alighting at pre-arranged times at any location within the system's service area. Also called "Diala-Ride".
deregulation
Consists in a shift to a competitive economic climate by reorienting and/or suppressing regulatory mechanisms. Deregulation, however, does not necessarily refer to complete absence of free market regulation measures but rather to the promotion of competitioninducing ones (which can seek elimination of monopolies, for example). Particularly observed in the transport and telecommunications sectors.
distribution center (freight)
Facility or a group of facilities that perform consolidation, warehousing, packaging, decomposition and other functions linked with handling freight. Their main purpose is to provide value-added services to freight and are a fundamental component of freight distribution. Distribution centers are often in proximity to major transport routes or terminals. They can also perform light manufacturing activities such as assembly and labeling.
double stack
The movement of containers on articulated rail cars which enables one container to be stacked on another for better ride quality and car utilization.
drayage
The movement of a container or trailer to or from the railroad intermodal terminal to or from the customer's facility for loading or unloading.
dry bulk cargo
Cargo which may be loose, granular, free-fl owing or solid, such as grain, coal, and ore, and is shipped in bulk rather than in package form. Dry bulk cargo is usually handled by specialized mechanical handling equipment at specially designed dry bulk terminals.
dwell time
The scheduled time a vehicle or train is allowed to discharge and take on passengers at a stop, including opening and closing doors.
dynamic routing
In demand-response transportation systems, the process of constantly modifying vehicle routes to accommodate service requests received after the vehicle began operations, as distinguished from predetermined routes assigned to a vehicle.
economic evaluation (also called appraisal or analysis)
Refers to various methods for determining the value of a policy, project or program to help individuals, businesses and communities make decisions that involve tradeoffs. Economic evaluation is an important part of transportation decision-making.
economies of agglomeration
Refer to the benefi ts of having activities locate (cluster) next to another, such as the use of common infrastructures and services.
economies of scale
Cost reductions or productivity effi ciencies achieved through size-increase. The outcome is a decrease in the unit cost of production associated with increasing output. For example, freight rates usually decline as the volume of cargo tonnage shipped increases. Simplistically, the more passengers share the same taxi (up to the maximum size), the less their individual fares will be.
economies of scope
Cost savings resulting from increasing the number of different goods or services produced.
energy
The capacity for doing work as measured by the capability of doing work (potential energy) or the conversion of this capability to motion (kinetic energy). Energy has several forms, some of which are easily convertible and can be changed to another form useful for work. Most of the world's convertible energy comes from fossil fuels that are
260 • Glossary
burned to produce heat that is then used as a transfer medium to mechanical or other means in order to accomplish tasks. Electrical energy is usually measured in kilowatt hours, while heat energy is usually measured in British thermal units.
energy intensity
In reference to transportation, the ratio of energy inputs to a process to the useful outputs from that process; for example, gallons of fuel per passenger-mile or Btu per ton-mile.
environmental impact assessment
A process for carrying out an appraisal of the full potential effects of a development project on the physical environment.
environmental management system
A set of procedures and techniques enabling an organization to reduce environmental impacts and increase its operating effi ciency.
ethanol
An alternative fuel; a liquid alcohol fuel with vapor heavier than air; produced from agricultural products such as corn, grain and sugar cane.
exclusive right-of-way
A highway or other facility that can only be used by buses or other transit vehicles.
externality (external cost)
Economic cost not normally taken into account in markets or in decisions by market players.
fare
The price paid by the user of a transport service at the moment of use.
fare elasticity
The extent to which ridership responds to fare increases or decreases.
fare structure
The system set up to determine how much is to be paid by various passengers using a transit vehicle at any given time.
feeder
Short sea shipping service which connects at least two ports in order for the freight (generally containers) to be consolidated or redistributed to or from a deep-sea service in one of these ports. By extension, this concept may be used for inland transport services and air transportation.
ferryboat
A boat providing fi xed-route service across a body of water, which can be short or long distance.
fi xed cost
Costs that do not vary with the quantity shipped in the short-run, i.e. costs that must be paid up-front to begin producing transportation services.
fi xed route
Service provided on a repetitive, fi xed-schedule basis along a specifi c route with vehicles stopping to pick up and deliver passengers or freight to specifi c locations; each fi xed-route trip serves the same origins and destinations, unlike demand responsive. The terms apply to many modes of transportation, including public transit, air services and maritime services.
fl ag state
Country of registry of a sea-going vessel. A sea-going vessel is subject to the maritime regulations in respect of manning scales, safety standards and consular representation abroad of its country of registration.
fl at car
A freight car having a fl oor without any housing or body above. Frequently used to carry containers and/or trailers or oversized/odd-shaped commodities. The three types of fl at cars used in intermodal are conventional, spine and stack cars.
fl eet
The vehicles in a transport system. Usually, "fl eet" refers to highway vehicles and rail vehicles as well as ships.
forwarding agent/freight forwarder
Intermediary who arranges for the carriage of goods and/or associated services on behalf of a shipper.
free trade zone
A port or an area designated by the government of a country for duty-free entry of any non-prohibited goods. Merchandise may be stored, displayed, used for manufacturing, etc., within the zone and re-exported without duties.
freight on board (FOB)
The price of a good is the combination of the factory costs and the shipping costs from the factory to the consumer. The consumer pays for the freight transport costs. Consequently, the price of a commodity will vary according to transportation costs.
freight consignee and handlers
Freight consignees are independent of shippers or producers. They are commissioned by the latter to accomplish all transport operations including storage, transport, management, sometimes re-expedition, etc. from origin to fi nal destination. The notion of freight handler is broader. It comprises any actor involved in transport of freight from origin to destination including transport terminals and sub-contractual services, for instance.
freight distribution center
See distribution center.
freight forwarder
An individual or company that accepts less-than-truckload (LTL) or less-than-carload (LCL) shipments from shippers and combines them into carload or truckload lots. Carriers collecting small shipments to be cumulatively consolidated and transported rely upon a single or several modes of transportation to a given destination. Functions performed by a freight forwarder may include receiving small shipments (e.g. less than container load) from consignors, consolidating them into larger lots, contracts with carriers for transport between ports of embarkation and debarkation, conducting documentation transactions, and arranging delivery of shipments to the consignees.
262 • Glossary
fringe parking
An area for parking usually located outside the Central Business District (CBD) and most often used by suburban residents who work or shop downtown. Commonly corresponds to an access point of a transit system, such as a rail or subway station.
fuel cell
A device that produces electrical energy directly from the controlled electrochemical oxidation of fuel, commonly hydrogen. It does not contain an intermediate heat cycle, as do most other electrical generation techniques.
gasohol
A blend of motor gasoline (leaded or unleaded) and alcohol (generally ethanol but sometimes methanol) limited to 10 percent by volume of alcohol. Gasohol is included in fi nished leaded and unleaded motor gasoline.
gasoline
A complex mixture of relatively volatile hydrocarbons, with or without small quantities of additives, obtained by blending appropriate refi nery streams to form a fuel suitable for use in spark ignition engines. Motor gasoline includes both leaded or unleaded grades of fi nished motor gasoline, blending components, and gasohol.
gateway
A location offering accessibility to a large system of circulation of freight, passengers and/or information. Gateways reap the advantage of a favorable physical location such as highway junctions, confl uence of rivers, seaboards, and have been the object of a signifi cant accumulation of transport infrastructures such as terminals and their links. A gateway generally commands the entrance to and the exit from its catchment area. In other words, it is a pivotal point for the entrance and the exit of merchandise in a region, a country, or a continent.
general cargo
Products or commodities such as timber, structural steel, rolled newsprint, concrete forms, agricultural equipment that are not conducive to packaging or unitization. Breakbulk cargo (e.g. packaged products such as lubricants and cereal) are often regarded as a subdivision of general cargo.
geographic information system (GIS)
A special-purpose system composed of hardware and software in which a common spatial coordinate system is the primary means of reference. GIS contain subsystems for: data input; data storage, retrieval, and representation; data management, transformation, and analysis; and data reporting and product generation.
GIS-T
Acronym for Transportation-oriented Geographic Information System.
graph theory
A branch of mathematics concerned about how networks can be encoded and their properties measured.
great circle distance
The shortest path between two points on a sphere. The circumference inferred from these two points divides the Earth in two equal parts, thus the great circle. The great circle distance is useful to establish the shortest path to use when traveling at the intercontinental air and maritime level. The great circle route follows the sphericity of the globe; any shortest route is the one following the curve of the planet, along the parallels.
gross domestic product (GDP)
A measure of the total value of goods and services produced by a domestic economy during a given period, usually one year. Obtained by adding the value contributed by each sector of the economy in the form of profi ts, compensation to employees, and depreciation (consumption of capital). Only domestic production is included, not income arising from investments and possessions owned abroad, hence the use of the word domestic.
gross national product (GNP)
The total market value of goods and services produced during a given period by labor and capital supplied by residents of a country, regardless of where the labor and capital are located. GNP differs from GDP primarily by including the capital income that residents earn from investments abroad and excluding the capital income that nonresidents earn from domestic investment.
Handy and Handymax
Traditionally the workhorses of the dry bulk market, the Handy and more recent Handymax types remain popular ships with less than 50,000 dwt. This category is also used to defi ne small-sized oil tankers.
headway
Time interval between vehicles moving in the same direction on a particular route.
heavy rail
An electric railway with the capacity for a "heavy volume" of traffi c and characterized by exclusive rights-of-way, multi-car trains, high speed and rapid acceleration, sophisticated signaling, and high platform loading.
high-occupancy-vehicle lane (HOV)
A highway or road lane reserved to vehicles that have a specifi c level of occupancy, with at least one passenger. Often used to alleviate congestion and favor carpooling.
hinterland
Land space over which a transport terminal, such as a port, sells its services and interacts with its clients. It accounts for the regional market share that a terminal has relative to a set of other terminals servicing this region. It regroups all the customers directly bounded to the terminal. The terminal, depending on its nature, serves as a place of convergence for the traffi c coming by roads, railways or by sea/fl uvial feeders.
hub
Central point for the collection, sorting, transshipment and distribution of goods for a particular area. This concept comes from a term used in air transport for passengers as well as freight. It describes collection and distribution through a single point ("hub and spoke" concept).
infl ation
Increase in the amount of currency in relation to the availability of assets, commodities, goods and services. Commonly the outcome of an indirect confi scation of wealth through an over-issuance of currency ("money printing") by central banks and governments.
infrastructure
1) In transport systems, all the fi xed components, such as rights-of-way, tracks, signal equipment, terminals, parking lots, bus stops, maintenance facilities, etc. 2)
264 • Glossary
In transportation planning, all the relevant elements of the environment in which a transportation system operates.
integrated carriers
Carriers that have both air and ground fl eets; or other combinations, such as sea, rail, and truck. Since they usually handle thousands of small parcels an hour, they are less expensive and offer more diverse services than regular carriers.
intermodal terminal
A terminal which can accommodate several modes of transportation. They increasingly tend to specialize at handling specifi c types of passengers or freight traffi c, while they may share the same infrastructures.
intermodal transport
The movement of goods in one and the same loading unit or road vehicle, which uses successively two or more modes of transport without handling the goods themselves in changing modes. Enables cargo to be consolidated into economically large units (e.g. containers, bulk grain railcars), optimizing use of specialized intermodal handling equipment to effect high-speed cargo transfer between ships, barges, railcars, and truck chassis using a minimum of labor to increase logistic fl exibility, reduce consignment delivery times, and minimize operating costs.
intermodalism
A system of transport whereby two or more modes of transport are used to transport the same loading unit or truck in an integrated manner, without loading or unloading, in a transport chain. Typically used in three contexts: 1) Most narrowly, it refers to containerization, piggyback service, or other technologies that provide the seamless movement of goods and people by more than one mode of transport. 2) More broadly, intermodalism refers to the provision of connections between different modes, such as adequate highways to ports or bus feeder services to rail transit. 3) In its broadest interpretation, intermodalism refers to a holistic view of transportation in which individual modes work together or within their own niches to provide the user with the best choices of service, and in which the consequences on all modes of policies for a single mode are considered. This view has been called balanced, integrated, or comprehensive transportation in the past.
International Air Transportation Association (IATA)
Established in 1945, a trade association serving airlines, passengers, shippers, travel agents, and governments. The association promotes safety, standardization in forms (baggage checks, tickets, weight bills), and aids in establishing international airfares. The IATA headquarters are in Geneva, Switzerland.
international airport
Any airport designated by the contracting state in whose territory it is situated as an airport of entry and departure for international air traffi c.
International Civil Aviation Organization (ICAO)
A specialized agency of the United Nations whose objective is to develop the principles and techniques of international air navigation and to foster planning and development of international civil air transport. ICAO regions include: (AFI) African Indian Ocean Region, (CAR) Caribbean Region, (EUR) European Region, (MID/ASIA) Middle East/ Asia Region, (NAM) North American Region, (NAT) North Atlantic Region, (PAC) Pacifi c Region, (SAM) South American Region.
International Maritime Organization (IMO)
Established as a specialized agency of the United Nations in 1948. The IMO facilitates cooperation on technical matters affecting merchant shipping and traffi c, including improved maritime safety and prevention of marine pollution. The IMO headquarters are in London, England.
International Organization for Standardization (ISO)
A worldwide federation of national standards bodies from some 100 countries, one from each country. ISO is a non-governmental organization established in 1947. The mission of ISO is to promote the development of standardization and related activities in the world with a view to facilitating the international exchange of goods and services, and to developing cooperation in the spheres of intellectual, scientifi c, technological and economic activity. ISO's work results in international agreements which are published as International Standards.
jet stream
A migrating stream of high-speed winds present at high altitudes.
just-in-time
The principle of production and inventory management in which goods arrive when needed for production or consumption. Warehousing tends to be minimal or nonexistent, but in all cases much more effi cient and more limited in duration.
knot, nautical
The unit of speed equivalent to one nautical mile: 6,080.20 feet per hour or 1.85 kilometers per hour.
lading
Refers to the freight shipped; the contents of a shipment.
landbridge
An intermodal connection between two ocean carriers separated by a land mass, linked together in a seamless transaction by a land carrier.
layover time
Time built into a schedule between arrival at the end of a route and the departure for the return trip, used for the recovery of delays and preparation for the return trip.
less than truckload (LTL)
A shipment that would not by itself fi ll the truck to capacity by weight or volume.
level of service
1) A set of characteristics that indicate the quality and quantity of transportation service provided, including characteristics that are quantifi able and those that are diffi cult to quantify. 2) For highway systems, a qualitative rating of the effectiveness of a highway or highway facility in serving traffi c, in terms of operating conditions. A rating of traffi c fl ow ranging from A (excellent) through F (heavily congested), and compares actual or projected traffi c volume with the maximum capacity of the intersection or road in question. 3) For paratransit, a variety of measures meant to denote the quality of service provided, generally in terms of total travel time or a specifi c component of total travel time. 4) For pedestrians, sets of area occupancy classifi cations to connect the design of pedestrian facilities with levels of service.
light-rail transit (LRT)
A fi xed guideway transportation mode that typically operates on city streets and draws electric power from overhead wires; include streetcars, trolley cars and tramways.
266 • Glossary
Differs from heavy rail – which has a separated right of way, and includes commuter and intercity rail – in that it has lighter passenger capacity per hour and more closely spaced stops.
lighter-aboard-ship (LASH)
A type of barge-carrying vessel equipped with an overhead crane capable of lifting barges of a common size and stowing them into cellular slots in athwartship position. LASH is an all-water technology analogous to containerization.
line haul costs
Costs that vary with distance shipped, i.e. costs of moving goods and people once they are loaded on vehicles.
liner
Derived from the term "line traffi c," which denotes operation along defi nite routes on the basis of defi nite, fi xed schedules. A liner thus is a vessel that engages in this kind of transportation, which usually involves the haulage of general cargo as distinct from bulk cargo.
liquefi ed natural gas (LNG)
An alternative fuel; a natural gas cooled to below its boiling point of –260 degrees Fahrenheit so that it becomes a liquid; stored in a vacuum type container at very low temperatures and under moderate pressure. LNG vapor is lighter than air.
load factor
The ratio of passengers or freight actually carried versus the total passenger or freight capacity of a vehicle or a route.
logistics
The process of designing and managing the supply chain in the wider sense. The chain can extend from the delivery of supplies for manufacturing, through the management of materials at the plant, delivery to warehouses and distribution centers, sorting, handling, packaging and fi nal distribution to point of consumption. Derived from Greek logistikos (to reason logically), the word is polysemic. Nineteenth-century military referred to it as the art of combining all means of transport, revictualling and sheltering of troops. A more fi tting meaning consists in the set of all operations required for goods (material or nonmaterial) to be made available on markets or to specifi c destinations. With increasing multimodal and containerized freight transport that complexify the coordination itineraries, logistics rely heavily on highly performing computerized information management implementation. The term also applies to passenger transportation.
logistics center
A geographical grouping of independent companies and bodies dealing with freight transport (for example, freight forwarders, shippers, transport operators, customs) and with accompanying services (for example, storage, maintenance and repair), including at least a terminal. Also called "freight village".
logit model
A probabilistic model for representing a discrete choice behavior of individuals. On any choice occasion the individual is assumed to choose the mode of highest preference. Over repeated choice occasions preferences are assumed to have a probabilistic component. For the logit model this random component of preference is taken to have a double exponential distribution.
long ton
2,240 pounds.
maglev (magnetic levitation)
Technology enabling trains to move at high speed above a guideway on a cushion generated by magnetic force.
manifest
A list of the goods being transported by a carrier.
maritime routes
Corridors of a few kilometers in width trying to avoid the discontinuities of land transport by linking ports, the main elements of the maritime/land interface. Maritime routes are a function of obligatory points of passage, which are strategic places, of physical constraints (coasts, winds, marine currents, depth, reefs, ice) and of political borders. As a result, maritime routes draw arcs on the Earth's water surface as intercontinental maritime transportation tries to follow the great circle distance.
maritime terminal
A designated area of a port, which includes but is not limited to wharves, warehouses, covered and/or open storage spaces, cold storage plants, grain elevators and/or bulk cargo loading and/or unloading structures, landings, and receiving stations, used for the transmission, care, and convenience of cargo and/or passengers in the interchange of same between land and water carriers or between two water carriers.
market area
The surface over which a demand offered at a specifi c location is expressed. Commonly, a customer is assumed to go to a location where a product or service can be acquired or a part or a fi nished good has to be shipped from the place of production to the place of consumption.
materials management
Considers all the activities related in the manufacturing of commodities in all their stages of production along a supply chain. It includes production and marketing activities such as production planning, demand forecasting, purchasing and inventory management. It must insure that the requirements of supply chains are met by dealing with a wide array of parts for assembly and raw materials, including packaging (for transport and retailing) and, ultimately, recycling discarded commodities. All these activities are assumed to induce physical distribution demands.
methanol
An alternative fuel; a liquid alcohol fuel with vapor heavier than air; primarily produced from natural gas.
microbridge
A cargo movement in which the water carrier provides a through service between an inland point and the port of load/discharge.
minibridge
A joint water, rail or truck container move on a single Bill of Lading for a through route from a foreign port to a US port destination through an intermediate US port or the reverse.
mobility
Refers to a movement of people or freight. It can have different levels linked to the speed, capacity and effi ciency of movements.
268 • Glossary
modal share
The percentage of total passengers or freight moved by a particular type of transportation.
modal split (share)
1) The proportion of total person trips that uses each of various specifi ed modes of transportation. 2) The process of separating total person trips into the modes of travel used. 3) A term that describes how many people use alternative forms of transportation. It is frequently used to describe the percentage of people who use private automobiles, as opposed to the percentage who user public transportation.
mode, transport
The physical way a movement is performed.
model
An analytical tool (often mathematical) used by transportation planners to assist in making forecasts of land use, economic activity, travel activity and their effects on the quality of resources such as land, air and water.
monorail
An electric railway in which a rail car or train of cars is suspended from or straddles a guideway formed by a single beam or rail. Most monorails are either heavy rail or automated guideway systems.
motorway/highway
A road, specially designed and built for motor traffi c, which does not serve properties bordering on it, and which 1) is provided, except at special points or temporarily, with separate carriageways for the two directions of traffi c, separated from each other either by a dividing strip not intended for traffi c or exceptionally by other means; 2) does not cross at level with any road, railway or tramway track, or footpath; 3) is specially signposted as a motorway and is reserved for specifi c categories of road motor vehicles. Entry and exit lanes of motorways are included irrespectively of the location of the sign-posts. Urban motorways are also included.
multimodal platform
A physical converging point where freight and/or passenger transshipment takes place between different modes of transportation, usually a transport terminal.
NAFTA (North American Free Trade Agreement)
Came into force on January 1st 1994. NAFTA binds Canada, the United States and Mexico in respect of a series of common economics rules. Beside the liberalization of exchange of goods and services, the NAFTA regulates investments, intellectual property, public markets and the non-tariff barrier. The NAFTA is a result of a tradition of trade negotiations between Canada and the USA that became explicit with the 1989 Free Trade Agreement (FTA) and the 1991 Canada–US Trade Agreement (CUSTA).
National Transportation System
An intermodal system consisting of all forms of transportation in a unifi ed, interconnected manner to reduce energy consumption and air pollution while promoting economic development and supporting the Nation's preeminent position in international commerce. The NTS includes the National Highway System (NHS), public transportation and access to ports and airports.
net tonnage
The net or register tonnage of a vessel is the remainder after deducting from the gross tonnage of the vessel the tonnage of crew spaces, master's accommodation, navigation spaces, allowance for propelling power, etc. It is expressed in tons of 100 cubic feet.
network
Framework of routes within a system of locations, identifi ed as nodes. A route is a single link between two nodes that are part of a larger network that can refer to tangible routes such as roads and rails, or less tangible routes such as air and sea corridors.
ocean bill of lading
A receipt for the cargo and a contract for transportation between a shipper and the ocean carrier. It may also be used as an instrument of ownership which can be bought, sold, or traded while the goods are in transit.
off-peak period
Non-rush periods of the day when travel activity is generally lower and less transit service is scheduled. Also called "base period".
operating cost
Costs that vary with the quantity shipped in the short-run. 1) Fixed operating cost: refers to expenditures that are independent of the amount of use. For a car, it would involve costs such as insurance costs, fees for license and registration, depreciation and fi nance charges; 2) Variable operating cost: expenditures which are dependent on the amount of use. For a car, it would involve costs such as the cost of gasoline, oil, tires, and other maintenance.
pallet
A raised platform, normally made of wood, facilitating the handling of goods. Pallets are of standard dimensions.
panamax
A maritime standard corresponding to about 65,000 deadweight tons. It refers to a ship with dimensions that allow it to pass through the Panama canal: maximum length 295 m, maximum beam overall 32.25 m, maximum draught 13.50 m.
park and ride
An access mode to transit in which patrons drive private automobiles or ride bicycles to a transit station, stop, or carpool/vanpool waiting area and park the vehicle in the area provided for the purpose. They then ride the transit system or take a car- or vanpool to their destinations.
passenger miles – km
The total number of miles (km) traveled by passengers or freight on vehicles; determined by multiplying the number of unlinked passenger trips times the average length of the trips.
payload
Weight of commodity being hauled. Includes packaging, pallets, banding, etc., but does not include the truck, truck body, etc.
peak period
Represents a time period of high usage of a transport system. For transit, it refers to morning and afternoon time periods when ridership is at its highest.
270 • Glossary
physical distribution
The collective term for the range of activities involved in the movement of goods from points of production to fi nal points of sale and consumption. It must insure that the mobility requirements of supply chains are entirely met. Physical distribution comprises all the functions of movement and handling of goods, particularly transportation services (trucking, freight rail, air freight, inland waterways, marine shipping, and pipelines), transshipment and warehousing services (e.g. consignment, storage, inventory management), trade, wholesale and, in principle, retail. Conventionally, all these activities are assumed to be derived from materials management demands.
piggyback trailers
Trailers which are designed for quick loading on railcars.
pipeline
A continuous pipe conduit, complete with such equipment as valves, compressor stations, communications systems, and meters for transporting natural and/or supplemental gas from one point to another, usually from a point in or beyond the producing fi eld or processing plant to another pipeline or to points of utilization. Also refers to a company operating such facilities.
planning
Refers to a process that allows people's needs, preferences and values to be refl ected in decisions. Planning occurs at many different levels, from day-to-day decisions made by individuals and families, to major decisions made by governments and businesses that have comprehensive, long-term impacts on society. Management can be considered a short-term form of planning, while planning can be considered a longer-term form of management.
port
A harbor area in which are located marine terminal facilities for transferring cargo between ships and land transportation.
port authority
An entity of state or local government that owns, operates, or otherwise provides wharf, dock and other marine terminal investments at ports.
port of entry
A port at which foreign goods are admitted into the receiving country. Also refers to an air terminal or land access point (customs) where foreign passengers and freight can enter a country.
product life cycle
The period that starts with the initial product design (research and development) and ends with the withdrawal of the product from the marketplace. A product life cycle is characterized by specifi c stages, including research, development, introduction, maturity, decline and obsolescence.
propane
An alternative fuel; a liquid petroleum gas (LPG) which is stored under moderate pressure and with vapor heavier than air; produced as a by-product of natural gas and oil production.
public transportation
Passenger transportation services, usually local in scope, that are available to any person who pays a prescribed fare. It operates on established schedules along designated routes or lines with specifi c stops and is designed to move relatively large numbers of people at one time.
rail, commuter
Railroad local and regional passenger train operations between a central city, its suburbs and/or another central city. It may be either locomotive-hauled or self-propelled, and is characterized by multi-trip tickets, specifi c station-to-station fares, railroad employment practices and usually only one or two stations in the central business district. Also known as "suburban rail".
rail, heavy
An electric railway with the capacity for a "heavy volume" of traffi c and characterized by exclusive rights-of-way, multi-car trains, high speed and rapid acceleration, sophisticated signaling and high platform loading. Also known as "rapid rail," "subway," "elevated (railway)" or "metropolitan railway (metro)".
rail, high-speed
A rail transportation system with exclusive right-of-way which serves densely traveled corridors at speeds of 124 miles per hour (200 km/h) and greater.
rail, light
An electric railway with a "light volume" traffi c capacity compared with heavy rail. Light rail may use shared or exclusive rights-of-way, high or low platform loading and multi-car trains or single cars. Also known as "streetcar," "trolley car" and "tramway".
railroad
All forms of non-highway ground transportation that run on rails or electro-magnetic guideways, including: 1) commuter or other short-haul rail passenger service in a metropolitan or suburban area, and 2) high-speed ground transportation systems that connect metropolitan areas, without regard to whether they use new technologies not associated with traditional railroads. The term does not include rapid transit operations within an urban area that are not connected to the general railroad system of transportation.
rapid transit
Rail or motorbus transit service operating completely separate from all modes of transportation on an exclusive right-of-way.
rate
The price of transportation services paid by the consumer of them. They are the negotiated monetary cost of moving a passenger or a unit of freight between a specifi c origin and destination. Rates are often visible to the consumer since transport providers must provide this information to secure transactions.
reefer ship
General cargo ship with 80 percent or more insulated cargo space.
ridership
The number of rides taken by people using a public transportation system in a given time period.
ridesharing
A form of transportation, other than public transit, in which more than one person shares the use of the vehicle, such as a van or car, to make a trip. Also known as "carpooling" or "vanpooling".
272 • Glossary
roll on/roll off (RO/RO) vessel
Ships which are especially designed to carry wheeled container trailers, or other wheeled cargo, and use the roll-on/roll-off method for loading and unloading.
semi-trailer
A non-powered vehicle for the carriage of goods, intended to be coupled to a motor vehicle in such a way that a substantial part of its weight and of its load is borne by the motor vehicle.
shipper
The company sending goods.
shunting
The operation of moving a rail vehicle or set of rail vehicles inside a railway station or other railway installation (depot, workshop, marshalling yard, etc.).
shuttle
A public or private vehicle that travels back and forth over a particular route, especially a short route or one that provides connections between transportation systems, employment centers, etc.
Silk Road
Historical trade route linking the Eastern Mediterranean basin to Central and East Asia. Named as such because of many prized commodities, namely silk, tea and jade, that were carried from China. Was operational between the fi rst century BC and the sixteenth century.
single-occupant vehicle (SOV)
A vehicle with one occupant, the driver, who is sometimes referred to as a "drive alone".
spatial interaction
A realized movement of people, freight or information between an origin and a destination. It is a transport demand/supply relationship expressed over a geographical space. Spatial interactions cover a wide variety of movements such as journeys to work, migrations, tourism, the usage of public facilities, the transmission of information or capital, the market areas of retailing activities, international trade and freight distribution.
spatial structure
The manner in which space is organized by the cumulative locations of infrastructure, economic activities and their relations.
suezmax
This standard, which represents the limitations of the Suez Canal, has evolved. Before 1967, the Suez Canal could only accommodate tanker ships with a maximum of 80,000 dwt. The canal was closed between 1967 and 1975 because of the Israel–Arab confl ict. Once it reopened in 1975, the Suezmax capacity increased to 150,000 dwt. An enlargement to enable the canal to accommodate 200,000 dwt tankers is being considered.
tanker
An oceangoing ship specially designed to haul liquid bulk cargo in world trade, particularly oil.
tare weight
1) The weight of a container and the material used for packing. 2) As applied to a car/ trailer, the weight of the car/trailer exclusive of its contents.
tariff
A general term for any listing of rates or charges. The tariffs most frequently encountered in foreign trade are: tariffs of international transportation companies operating on sea, land, and in the air; tariffs of international cable, radio, and telephone companies; and the customs tariffs of the various countries which list goods that are duty free and those subject to import duty, giving the rate of duty in each case.
terminal
Any location where freight and passengers either originate, terminate, or are handled in the transportation process. Terminals are central and intermediate locations in the movements of passengers and freight. They often require specifi c facilities to accommodate the traffi c they handle.
terminal costs
Costs of loading and unloading. They do not vary with distance shipped.
thalweg
The deepest water at any point in a river. The longitudinal line of greatest continuous depth in the river channel.
threshold
The minimum and vital market size required to support a given type of economic activity. A mean number of passengers per trip can be identifi ed to sustain profi tability of a coach line, for example. A threshold thus rests on a level of demand and can play a determining role in organizing both freight and passenger transport structures on the basis of demographic dynamics, geographic relations to markets and intensity of economic activities.
ton
A unit a measurement of weight, frequently used in freight transport statistics. A metric ton is equivalent to 1,000 kilograms or 2,205 pounds. A short ton is equivalent to 2,000 pounds or 0.908 metric tons (in the United States the term ton is commonly used but implies short ton). A long ton, a term not as frequently used, is equivalent to 2,240 pounds or 1.06 metric tons.
track gauge
The distance between the internal sides of rails on a railway line. It is generally 1.435 m. Other gauges are generally used in some European countries: for instance, 1.676 m in Spain and Portugal, 1.524 m in the Russian Federation.
trailer on fl at car (TOFC)
A rail trailer or container mounted on a chassis that is transported on a rail car. Also known as piggyback.
tramp
An oceangoing vessel that does not operate along a defi nite route or on a fi xed schedule, but rather calls at any port where cargo is available.
transaction costs
Costs required for gathering information, negotiating, and enforcing contracts and transactions. Often referred as the cost of doing business.
274 • Glossary
transit system
An organization (public or private) providing local or regional multi-occupancy-vehicle passenger service. Organizations that provide service under contract to another agency are generally not counted as separate systems.
transport costs
Monetary measure of what the transport provider must pay to produce transportation services and comes as fi xed (infrastructure) and variable (operating). They depend on a variety of conditions related to geography, infrastructure, administrative barriers, energy , and on how passengers and freight are carried. Three major components, related to transactions, shipments and distance, impact on transport costs.
transport geography
A sub-discipline of geography concerned about movements of freight, people and information. It seeks to link spatial constraints and attributes with the origin, the destination, the extent, the nature and the purpose of movements.
transportability
The convenience at which passengers, freight or information can be moved. It refers to transport costs, but also to the attributes of what is being transported (fragility, perishable, price). Some political factors can also infl uence transportability such as laws, regulations, borders and tariffs. When transportability is high, activities are less constrained by distance.
transshipment
The transfer of goods from one carrier to another and/or from one mode to another.
trip assignment
In planning, a process by which trips, described by mode, purpose, origin, destination, and time of day, are allocated among the paths or routes in a network by one of a number of models.
trip generation
In planning, the determination or prediction of the number of trips produced by and attracted to each zone.
twenty-foot equivalent unit (TEU)
A standard unit based on an ISO container of 20 feet length (6.10 m), used as a statistical measure of traffi c fl ows or capacities. One standard 40' ISO Series 1 container equals 2 TEUs.
ultra large crude carrier (ULCC)
A tanker ship from 300,000 to 550,000 dwt in size. Used for carrying crude oil on long haul routes from the Persian Gulf to Europe, America and East Asia, via the Cape of Good Hope or the Strait of Malacca . The enormous size of these vessels requires custom built terminals.
unit load
Packages loaded on a pallet, in a crate or any other way that enables them to be handled as a unit.
unlinked passenger trips
The number of passengers who board public transportation vehicles. A passenger is counted each time he/she boards a vehicle even though he/she may be on the same journey from origin to destination.
upstream/downstream
Refers to the relative location of a given activity along a supply chain.
variable cost
A cost that varies in relation to the level of operational activity.
very large crude carrier (VLCC)
A crude oil carrying ship of between 150,000 and 320,000 deadweight tons. They offer a good fl exibility for using terminals since many can accommodate their draft. They are used in ports that have depth limitations, mainly around the Mediterranean, West Africa and the North Sea. They can be ballasted through the Suez Canal.
vessel
Every description of watercraft, used or capable of being used as a means of transportation on the water.
warehouse
A place for the reception, delivery, consolidation, distribution, and storage of freight.
waterway
River, canal, lake or other stretch of water that by natural or man-made features is suitable for navigation.
waybill
A document covering a shipment and showing the forwarding and receiving station, the names of consignor and consignee, the car initials and number, the routing, the description and weight of the commodity, instructions for special services, the rate, total charges, advances and waybill reference for previous services and the amount prepaid.
weight
Gross: The weight of the goods including packing, wrappers, or containers, both internal and external. The total weight as shipped. Net: The weight of the goods themselves without the inclusion of any wrapper. Tare: The weight of the packaging or container. Weight/Measurement ton: In many cases, a rate is shown per weight/measurement ton, carrier's option. This means that the rate will be assessed on either a weight ton or measurement ton basis, whichever will yield the carrier the greater revenue. Weight ton: Metric measure equal to 1,000 kilograms; in Imperial measure a short ton is 2,000 pounds, a long ton is 2,240 pounds.
wharf
A landing place where vessels may tie up for loading and unloading of cargo.
yard
A system of auxiliary tracks used exclusively for the classifi cation of passenger or freight cars according to commodity or destination; assembling of cars for train movement; storage of cars; or repair of equipment.
Index
| access 4–5, 136–7, 252 accessibility 4–5, 87, 89–90, 189, 252; attractiveness 31; connectivity 28–30; contiguous 28; defi nition 27–8; distance 28; emissiveness 31; geographic/potential 30–1; location 28; spatial structure 11; topological |
vehicles 239; production 25; promoting bicycle use 240; provision of urban space 177–80; tolls 241; traffi c calming 239 average vehicle occupancy (AVO) 253 average vehicle rideship (AVR) 253 |
|---|---|
| 28; urban transit 189 | Bailey, E.E. and Baumol, W.J. 232 |
| aerodrome 252 | balance of payments 253 |
| aframax 252 | balance of trade 253 |
| agglomeration economies see economies of | barge 253; services 118 |
| agglomeration | Barke, M. 208 |
| Agusdinata, B. and Klein, W. de 111 air cargo 112, 252 |
barrel 253 barriers to movement: absolute 9; relative 9 |
| air carrier 111, 252 | base fare 253 |
| Air Deregulation Act (1978) 110–11 | benefi t–cost ratio 244 |
| air space 109, 252 | benzene and volatile components (BTX) 211 |
| air transport 23, 24, 108–12, 121, 150, 252; | berth 254 |
| alliances 111; bilateral agreements 109; | bicycles 22, 177, 240 |
| capital intensive 109; development 109; | bill of lading 115, 254 |
| freedom rights 109–10; freedom of route choice 108–9; government approvals 109; hub |
Biondi, V. et al. 219 Bird, J.H. 132–3 |
| 111–12; intercontinental 108; international | block 254 |
| 108; liberalization process 110–11; low-cost | BLT (Build-Lease-Transfer) 247 |
| carriers 111; no frills/charter 121; passenger/ | Bonnafous, A. and Raux, C. 206 |
| freight 112; regional 108 | BOT (Build-Operate-Transfer) 247 |
| airport 253; sites 133–4 | Bremen rule 129 |
| alternative fuels 206–8, 253 Amtrak 253 |
bridge 254 British thermal unit (Btu) 254 |
| André, P. et al. 222 | Brooks, M. 107 |
| Antwerp rule 129 | bulk cargo 128, 254 |
| appraisal/analysis see economic evaluation | bulk carriers 105–6, 254 |
| arterial street 253 | bulk terminal 254 |
| Attali, J. 204 | Burgess concentric model 182 |
| automated identity system (AIS) 138 | bus (motorbus) 187, 254 |
| automated transport systems 27 automobile: alternative work schedules 239–40; |
cable car 255 |
| car sharing 240; cordon pricing 241; | cabotage 104, 110, 255 |
| densifi cation/integration 239; dependency on | Caddy, J. 236 |
| 192–3; development 186; dominance 192; | canal 231, 255 |
| effectiveness of economic controls 240–1; | Capesize 255 |
| enhancing pedestrian areas 240; fair pricing | capital costs 46 |
| 241; improving public transit 240; measuring externalities 240; ownership 191; park and |
capital productivity measures 123 carbon dioxide (CO2 ) 211, 233, 255 |
| ride 239; parking management 176–7, 240; | carbon monoxide (CO) 211, 255 |
| political diffi culty 240; practical diffi culties | carpool 255 |
| 240; priority lanes for buses/high occupancy | carrier 255 |
| catchment area 255 | 247–8; technological innovation 248; urban |
|---|---|
| Caves, R.E. and Gosling, G.D. 127 | transit 175, 179, 194 |
| central business district (CBD) 174, 175, 183 | consignee 257 |
| Central Place Theory 84 | consolidated shipment 257 |
| Cervero, R. 188 | container 116–17, 257 |
| Charlier, J. 133 | container on fl atcar (COFC) 257 |
| charter 255 | container ship 106, 257–8 |
| Chicago Area Transportation Study (CATS) 197, | containerization 24, 53, 123, 257; consumption |
| 198 | of space 117; costs 116; double-stacking |
| chlorofl uorocarbons (CFCs) 211 | 118; empty travel 117; fl exibility of usage |
| Civil Aeronautics Board 230 | 116; illicit trade 117; infrastructure of costs |
| class I railroad 256 | 117; intermodal 116–18; management 116; |
| Clean Air Act (CAA) 256 | management logistics 117; security 117; |
| climate 8 | speed 117; standard transport product 116; |
| closed-circuit TV (CCTV) 241 | warehousing 117 |
| clusters 130–1 | cordon pricing 241 |
| coach service 256 | corporate average fuel economy (CAFE) |
| colonial period 17–18 | standards 258 |
| combi 256 | corridor 163, 258 |
| combinatory costs 121–2 | cost–benefi t analysis (CBA/COBA): defi nitions |
| commercial geography 256; defi nition 38; | 244; framework 243; measurement 244; |
| economic opportunities 76; international | results 244 |
| 40–1; personal consumption 41; production | costs-insurance-freight (CIF) 46, 258 |
| 41; regional 40; tendencies in 40–1; and trade | Cox, W. 195 |
| 38–40 | cross-docking 258 |
| commodity chain 256; agricultural 155; | crude oil petroleum 258 |
| cargo type 156; centralized production | |
| 153; chemical 155; consignment size | De Langen, P.W. 130–1 |
| 156; construction industry 155; defi nition | deadhead 258 |
| 151; distribution 152; energy 155; freight | deadweight tons 258 |
| transport 154–7; functional integration 153; | Delphi forecasting 141, 235; administration of |
| geographical coverage 155; geographical | questionnaire 142; areas of disagreement |
| integration 153; global 153; management | 142; feedback 142; identifi cation of problem |
| of shipments 155; manufactured goods | 141; level of agreement on predetermined |
| 153, 156–7; manufacturing assembly 152; | value 142; procedure 141–2; researcher |
| manufacturing industry 155; metal 155; | summarizers responses 142; selection of |
| mode 156; raw materials 152, 156; regional | experts 142 |
| production 153; regional specialization 153; | Delucchi, M.A. 211 |
| semi-fi nished products 152–3, 156; sequential | demand responsive 258 |
| process 152; time constraint 155; vertical | Department of Homeland Security 137, 139 |
| transnational integration 154; wood/paper | deregulation 43, 111, 115, 232, 259 |
| 155 common carrier 256 |
derived demand: direct 2; indirect 3 Dion, S. et al. 236 |
| commuter 173, 256; bus service 256; cycling | distribution center (freight) 243, 259 |
| 174; driving (no freeways) 174; driving (with | distribution systems see logistics |
| freeways) 174; jobs/location of workplace | divestiture 43 |
| 185; rail 187, 256; streetcar 174; time 175–6; | double stack 118, 259 |
| walking 174 | drayage 259 |
| comparative advantage 79, 257 | dry bulk cargo 259 |
| competition 45 | dwell time 259 |
| compressed natural gas (CNG) 257 | dynamic routing 259 |
| Computer Assisted Passenger Prescreening | |
| System (CAPPS II) 137 | Eco-Management and Audit Scheme (EMAS) |
| Comtois, C. and Rimmer, P.J. 210 | 218–19 |
| conference 257 | economic development: airways/information |
| congestion 192, 193–4, 246–7, 257; assessing | 78; coal 78; commodity market 79; cycles |
| impact 248; freight 194; passenger terminals 126–7; predict and accommodate 248; socio |
77–9; direct impacts 74; electrifi cation 78–9; globalization 76–7; importance of transport |
74–6; indirect impacts 74; information
economic impact 80; solutions, fi nancing
278 • Index
systems 79; labor market 79; macroeconomic level 76; market area analysis 94–100; market areas/types of commodities 76; mass production 76; microeconomic level 76; mobility 74–5; plastics/electronics 79; railways 78; rivers/canals 78; roads 78; seaports 78; socio-economic impacts 80–1; technological innovation 78; timing 77; types of impacts 77; water power, textiles, iron 78 economic evaluation (appraisal/analysis) 259 economic impacts 122–3 economies of agglomeration 11, 90, 111, 259 economies of scale 13, 23, 45, 76, 259; connections 48; hubs 48; road transport 102; shared transshipment facilities 48 economies of scope 76, 260 edge cities 86 effi ciency 122–3, 130 elasticity 58–9 Electronic Data Interchange (EDI) 41, 115–16, 129–30 energy 45, 204–5, 260; administration of business 205; air transportation 206; alternative fuels 206–8; biogas 207; consumption 205–6; electricity 207; fossil fuels 207–8; freight transportation 206; hydrogen 207; intensity 260; land transportation 205–6; maritime transportation 206; non-fossil fuels 208; passenger transportation 206; production/trade 205; transportation infrastructure construction/ maintenance 205; vehicle manufacture, maintenance, disposal 205; vehicle operation 205 entry costs 58 environment 208–14, 229, 233; activities 214; air quality 211; atmospheric pollution 249; biodiversity 212; causes 214; challenges 248– 9; climate change 211; cumulative 213; direct 213; end results 214; energy 249; hydrology 209; impacts of transport 210–14; indirect 213; land take 213, 249; natural hazards 209; noise 211; outputs 214; overcoming 209–10; physical distance 208; soil quality 212; sustainability 214–22; topography 208–9; water quality 211–12, 249 environmental impact assessment (EIA) 216, 222–4, 260 environmental management system (EMS) 218–22, 260; communication instruments 222; cooperation instruments 222; defi nition 218; devise calendar of operation 221; eco-management and audit scheme 218–19; economic instruments 222; establish benchmarking 221; geographic instruments 222; implement measures of control 221; ISO 14001 219; legal instruments 221–2; quantify terms of reference 220–1; strategic instruments 221 ethanol 260 European Environment Information and Observation Network 228 European Union (EU) 147, 218, 228 Ewing, R.H. 239 exclusive right-of-way 260 externality (external cost) 260 factor substitution 123 fare 260 fare elasticity 260 fare structure 260 feeder 260 ferryboat 260 fi xed cost 261 fi xed route 261 fl ag state 261 fl at car 261 fl eet 261 Fleming, D.K. and Hayuth, Y. 135 fl ow 38, 162; distribution systems 159–60; imbalances 41; international 40–1; value 39; volume 39–40 Fordist era 22–3 forwarding agent/freight forwarder 261 fossil fuels 25–6 fourth party logistics providers (4PL) 119 free trade zone 261 freight 56; bulk 128; commodity chain 154–7; distribution 192; freight villages 243; general cargo 128; loading/unloading equipment 128; logistics/distribution centers 243; planning 242–3; standard measures of weight/value 128–9; storage 128; terminals 128–9; value added contribution 129 freight on board (FOB) 46, 261 freight consignee and handlers 261 freight distribution: commercialization 41–3; expansion/interconnection 42; integrated demand 42; introduction 42; standardization/ integration 42 freight distribution center see distribution center freight forwarder 261–2 Freimann, J. and Walther, M. 219 fringe parking 262 fuel cell 27, 262 gasohol 262 gasoline 262 gateway 83, 85, 262 general cargo 128, 262 geographers 250–1 geographic information system (GIS) 262; market area analysis 98–100 geographic information systems for transportation (GIS-T) 32, 262; analysis 33; analysis/modeling 33, 35–6; applications 33, 36–7; data representations 33; encoding 32; enterprise/multidimensional 35; fi eld-based data models 34; management 32–3; network
analysis 34–5; object-based data models 34; raster models 34; reporting 33; representations 33–5; vector models 34 Gini coeffi cient: calculating 140–1; defi nition 139–40 global economy 40, 87, 144–6; production networks 153; trade patterns 146–8 global positioning system (GPS) 242 Goetz, A.R. and Szyliowicz, J.S. 134 Goh, M. 241 Gottman, J. 85 Graham, B. 109, 111 graph theory 59–67, 262; Alpha 65–6; articulation node 63; basic structural properties 62; Beta 65; buckle 61; chain 62; circuit 62; complementary 63; completeness 63; connection 61; connectivity 63; cycle 62; defi nition 59; detour 64; diameter 64; edge (link) 60–1; Eta 65; Gamma 66; graph 60; indexes 64; isthmus 63; length of link, connection, path 62; links/structures 61–2; measures 63; network density 64; non-planar graph 61; number of cycles 64; order (degree) of node 64; path 61; Pi 64–5; planar graph 61; root 63; sub-graph 61; symmetry/asymmetry 63; Theta 65; trees 63; vertex (node) 60 gravity model: calibration 168–9; extension 168; formulation 167–8 great circle distance 9–11, 263 greenfi eld sites 134 gross domestic product (GDP) 41, 263 gross national product (GNP) 263 Gwilliam, K.M. and Shalizi, Z. 215 Haezendonck, E. 129 Handy/Handymax 263 Hayuth, Y. 115 headway 263 heavy metals 211 heavy rail 187, 240, 263 Hesse, M. 157 high-occupancy-vehicle lane (HOV) 263 hinterland 136, 263 Hogwood, B. and Gunn, L.A. 235 Holmen, B.A. and Niemeier, D.A. 211 Hotelling 97–8 Hoyle, B.S. 133 hub 48, 135, 163, 263; air transport 111–12 Huff's law 97, 98 hydrography 8 indicators of management performance (IMP) 219 indicators of operational performance (IOP) 219 Industrial Revolution 18–20 infl ation 264 information technologies (ITS) 241–2 infrastructure 45, 264; expansion 13 innovation: technological 26, 78–9, 248; transport integrated carriers 264 integrated transport chain 118 Integrated Transportation and Land Use Package (ITLUP) 201 intermediary fi rms 47 Intermodal Surface Transportation Effi ciency Act (ISTEA) (1991) 236, 237 intermodal terminal 264; rail facilities 134 intermodal transport 56, 264 intermodalism 264; barge services 118; container/ maritime transport 116–17; data handling, processing, distribution systems 115–16; doorto-door service 118; maximizing linehaul 114; nature/concept 114–16; production systems 118–19; rail transport 118; technology 115 internal combustion engine 22–3 internal rate of return (IRR) 244 International Air Transportation Association (IATA) 264 international airport 264 International Civil Aviation Organization (ICAO) 233, 265 International Maritime Organization (IMO) 138, 233, 265 International Ship and Port Security (ISPS) code 138 International Standards Organization (ISO) 41, 265 international trade 144–6; distribution-based 146; geographical/economic changes 147; integration processes 146; market size 148; patterns 146–8; production systems 146; regulation-based 146; technology 147; trade imbalances 148; transaction-based 146; transport 148–50; transport effi ciency 146 international transport 148–50; air 150; chains 149–50; commodity chains 151–7; enabling factor 149; environment 149; gravity model 167–9; growth 150; infrastructures 149; logistics 157–69; spatial interactions 164–7; maritime 150; services 149 Internet 41 Interstate Highways Act (1956) 228, 241 investment 43 Isard, W. 183 ISO 14001 218, 219 Janelle, D.G. and Gillespie, A. 240 jet stream 265 Johansson, B. 207 journey to work (JTW) 197 just-in-time (JIT) 24, 157, 265 Khare, M. and Sharma, P. 207 knot, nautical 265 lading 265
280 • Index
| land rent theory 183–4 | market area 267 |
|---|---|
| land use: Burgess concentric model 182; formal | market area analysis 94–100; competition |
| 180; functional 180; hybrid model 182–3; | 96; competition over market areas 97–8; |
| land rent theory 183–4; models 181–4; sector/ | concentric circles 98–9; coverage 97; |
| nuclei model 182; spatial interactions 180; | economic defi nition 95–6; GIS 98–100; |
| transport system 180–1; urban dynamics | income levels 96; infl ation 96; market range |
| 184–5; Von Thunen's regional model 181–2 | 94; market threshold 94; price 97; profi t |
| landbridge 54, 265 | 96; range expansion 97; savings 96; share |
| Lawrence, D.P. 222 | by polygon 99; size/shape 94–5; spatial |
| layover time 265 | smoothing 99; star map 99; taxation 96; |
| Lenzen, M. et al. 206, 211 | transport distance 99–100; utility 96 |
| Leppäkoski, E. 212 | Mass, P. 207 |
| less than truckload (LTL) 152, 265 | materials management 158, 267 |
| level of service 265–6 | Medieval period 16–17 |
| light-rail transit (LRT) 240, 266 | megalopolis 85 |
| lighter-aboard-ship (LASH) 115, 266 | Merlin, P. 1 |
| line haul costs 46, 266 | methane (CH4 ) 211 |
| linear programming 92; advanced 93; constraint | methanol 267 |
| set 91; feasible point 91; inequalities 90–2; | metro system 187 |
| optimal solution 92 | metro systems 22 |
| liner 266 | microbridge 54, 267 |
| liquefi ed natural gas (LNG) 266 | minibridge 54, 268 |
| Litman, T. 240 | mobility 172–3, 268 |
| load factor 266 | modal share 268 |
| location 86–90; accessibility 87, 89–90; | modal split (share) 113, 200, 268 |
| coeffi cient 124–5; factors 87–9; importance | mode: air 108–12; compete/complement 112; |
| 86–7; ports/airports 86; primary | diversity 101–14; economic development 114; |
| (environmental endowments) 88; quaternary | geographical variations 114; intermodal |
| (high-level services) 88; roads/railroads 86; | 114–19; modal competition 112–14; |
| secondary (costs) 88; site 87; socio-economic | passenger vs freight 119–21; pipelines 103–4; |
| environment 88; telecommunications 87; | rail 102–3; road 101–2; technical performance |
| terminals 131–6; tertiary (market proximity) | indicators 121–5; terminal cost structure |
| 88 | 112–13; transport 45, 56, 268; water 104–7 |
| logistics 157–69, 266; center 162, 243, 266; | model 268 |
| control 158; corridor structures of distribution | monorail 268 |
| 163; defi nition 157; demand driven 161; | Morse, Samuel 22 |
| distribution systems 159–61; features 160–1; | motorway/highway 268 |
| fl exibilization 160; fl ows 162; geographical | Muller, G. 115 |
| dimension 161–4; globalization 160; gravity | multimodal platform 268 |
| model 167–9; hub-and-spoke networks 163; | multimodal transport 114–15 |
| location 157; networks 163; nodes/location | |
| 162–3; point-to-point distribution 163; | NAFTA (North American Free Trade Agreement) |
| production 157; routing networks 164; spatial | 40, 147, 268 |
| interactions 164–7; supply driven 161; time | National Household Transport Survey (NHTS) |
| 157 | 197 |
| logit model 267 | National Transportation System 269 |
| long ton 267 | net present value (NPV) 244 |
| Lorenz curve 139–40 | net tonnage 269 |
| Lowry transportation/land use model 201 | network 163, 269; clearly defi ned/delimited |
| 51; defi nition 47; effi ciency 49; expansion | |
| McCalla, R.J. 133, 141 | 53–4; fractionalization 52; graph theory |
| McLean, Malcolm 24 | 59–67; hub-and-spoke 48; implementation |
| maglev (magnetic levitation) 26–7, 267 | 48; instantaneity 52; models 181; and space |
| manifest 267 | 51–3; typology/topology 49–51; ubiquity |
| maritime routes 267 | 52; vaguely defi ned/delimited 51; without |
| maritime terminal 267 | defi nition 51 |
| maritime transport 116–18, 150 | network data models: basic representation 70–1; |
| Maritime Transportation and Security Act (2002) | cartography 68; classifi cation/labelling 72; |
| 138 | direction 72; geocoding 69; layer-based |
approach 71–2; linear referencing system 72;
   link table 70; nature/utility 67–70; node table
   70; object-oriented approach 72; overcrossing/
   undercrossing 72; routing/assignment 69–70;
   segment travel costs 72; topology 67; turn
   penalties 72
Notteboom, T.E. and Winkelmans, W. 136
nuclei land use model 182
object-based data models 34; discrete/identifi able
   34; real-world features 34
ocean bill of lading 269
OECD 211, 215
off-peak period 269
oil 25–6
operating cost 269
origin/destination (O/D) matrices 165–6
Paaswell, R.E. 236, 237
pallet 269
Panama Canal 21
panamax 269
paratransit system 188
park and ride 189, 239, 269
Parkhurst, G. and Richardson, J. 239
passenger miles/km 55–6, 122, 269
passenger terminals: airport complexity 127;
   congestion 126–7; little specifi c equipment
   126; measurement of activities 127; transfers
   127
passengers 56
passengers vs freight 119–21; advantages/
   disadvantages 119–20; air transport 121;
   growing divergence 120–1; major problems
   119; rail 120–1; roads 121; share routes 119;
   shipping 120
payload 270
peak period 270
pedestrians 176, 192, 240
performance of transport modes 121–2
physical distribution 158, 270; see also logistics
Picciotto, R. 235, 237
piggyback trailers 115, 270
pipelines 103–4, 270; operating costs 104;
   routing 104
planning 270; choosing course of action 239;
   contemporary 238; defi nition 227–8; demand
   management 239–40; distinction with policy
   228; emergency signal priority 241–2; freight
   242–3; global positioning systems 242;
   goals/objectives 238; identifi cation of actors,
   initiatives, stakeholders 238; interactive
   highways 241; options 238; predicting
   outcomes, identifying benefi ts, assessing
   costs 238; pricing 240–1; toll collection 242;
   traditional process 237–8
policy: adequate staff/resources 236; adequate
   time frame/resources 236; cause-and-
   effect relationships 236; changing nature
                                                         of interventions 232–3; communication/
                                                         cordination 236; compliance 236; context
                                                         233–4; defi nition 227–8; dependency
                                                         relationships 236; deregulation/privatization
                                                         232; development trends 230–2; distinction
                                                         with planning 228; economic development
                                                         228; elements 234; evaluation/maintenance
                                                         236–7; ex ante/ex post evaluation 235;
                                                         identifi cation 233; implementation agreed
                                                         upon/understood 236; insurmountable external
                                                         constraints 235; labor regulations 230; limit
                                                         foreign ownership 228; national security 228;
                                                         objectives/options 234–5; on-going program
                                                         237; policy instruments 229–30; policy/
                                                         theory compatibility 236; prevent/control
                                                         inherent monopolistic tendency 228; problem
                                                         defi nition 233–4; process 233–7; public
                                                         ownership 229; public safety/environment
                                                         228, 233; public/private 228; regulatory
                                                         control 230, 231; research and development
                                                         230; safety/operating standards 230; specifi ed
                                                         in appropriate sequence 236; subsidies 230;
                                                         timescale 234
                                                      pollutants: air quality 81; land take 81; noise 81;
                                                         water quality 81
                                                      port 232, 270
                                                      port authority 270
                                                      port of entry 270
                                                      port sites 132–3; Anyport concept 133; expansion
                                                         133; setting 132–3; specialization 133
                                                      Porter, M.E. 130
                                                      post-Fordist era 23–6
                                                      priority lanes 239
                                                      product life cycle 270
                                                      production 41, 79–80; distribution 151;
                                                         geographic specialization 79; increased
                                                         competition 80; increased land value 80;
                                                         industrial linkages 151; intermodal 118–19;
                                                         large-scale 80; production factors 150–1;
                                                         systems 150–1
                                                      production-consumption cycle 122
                                                      propane 271
                                                      public transport 58, 172, 271
                                                      rail 22, 24, 102–3, 120–1, 231; capital costs 102;
                                                         commuter 271; entry barriers 102; gauge
                                                         102–3; greenfi eld 134; heavy 271; high speed-
                                                         high capacity service 103; high-speed 271;
                                                         intermodal 118; intermodal facilities 134;
                                                         light 271; passenger 134; terminal sites 134
                                                      railroad 271
                                                      rapid transit 271
                                                      raster models 34; tessellation 34
                                                      rate 271; defi nition 44; zonal 46–7
                                                      Raymond, K. and Coates, A. 222
                                                      reefer ship 271
                                                      regulations 45, 230, 231–2
                                                      Reilly's law 97, 98
                                                      ridership 272
282 • Index
| spatial relations 7; complementarity 7; location |
|---|
| 7; scale 7 |
| spatial structure 272; accessibility 11; |
| agglomeration 11; concentration/dispersion |
| 12; costs 11; historical considerations 11; new |
| developments 11–12; physical attributes 11; |
| segregation 12; specialization 12 |
| specialization index 124 |
| specialized fi rms 47 |
| Sperling, D. 207 |
| standards 230, 258 |
| Studnicki-Gizbert, K.W. 227 |
| Suez Canal 21 |
| suezmax 272–3 |
| supply and demand: context 54–6; defi nitions |
| 54–5; derived transport demand 54; elasticity |
| 58–9; entry costs 58; freight 57; functions |
| 56–7; information 57; intermodal 56; |
| measurement 55; modal 56; passengers |
| 57; public sector 58; relationships 57–9; |
| supporting mobility 54 |
| Surface Transportation Board 233 |
| sustainability 214–22; bottom-up approach |
| 216–18; credit rates 217; environmental |
| impact assessment 216, 222–4; framework |
| 218–22; insurance premiums 217; investments |
| 217; market capitalization 217; new markets |
| 218; revenues 217–18; strategic alliances 218; |
| top-down approach 214–16 |
| Talley, W.K. 212 |
| tanker 273 |
| tare weight 273 |
| tariff 273 |
| taxi 188 |
| technical performance indicators 121–5; |
| economic impact 122–3; location coeffi cient |
| 124–5; specialization index 124; transport/ |
| economic impact relationship 123 |
| technology 26, 47, 87, 241–2 |
| telecommunications 22, 23, 24, 41, 53, 88 |
| terminals 232, 273; access 136–7; administration |
| 129; agglomeration of related activities |
| 130; airport sites 133–4; centrality 135; |
| clusters 130–1; costs 46, 129–31, 273; crowd |
| control/safety 136; defi nition 126; Delphi |
| forecasting 141–2; effi ciency 13; focus of |
| concern 136; freight 128–9, 138–9; function |
| 126–31; Gini coeffi cient 139–41; hinterland/ |
| foreland 135–6; important economic activity |
| 130; infrastructure 129; intermediacy 135; |
| location 131–6; passenger 126–7, 137–8; port |
| sites 132–3; rail terminal sites 134; reducing |
| 129–30; relative 131, 135; security 136–9; site |
| 131; transshipment 129 |
| thalweg 273 |
| third party logistics providers (3PL) 119 threshold 273 |
industrial revolution 18–20; intermediaries
connectivity 195; convergence 189–90; decentralization 195; fi xity 195; high density
Encoding and Referencing) model 72
time effi ciency 121–2, 123
Tolley, R. and Turton, B. 227
tolls 241, 242
ton 273
ton-km 122
topography 8
Total Factor Productivity (TFP) 123
track gauge 102–3, 273
trade: availability 39; defi nition 38; liberalization
   41; transaction/fl ows 38–41; transactional
   capacity 39; transferability 39
trade imbalances 45
traffi c calming 239
traffi c counting 195–7; bending plate 196;
   inductive loop 196; intrusive 195–6; manual
   observation 196; microwave-doppler/radar
   196; non-intrusive 195; passive magnetic
   196; passive/active infra-red 196; piezo-
   electric sensor 196; pneumatic road tube 196;
   ultrasonic/passive accoustic 196; video image
   detection 196
traffi c surveys 197–8; comparability between
   surveys 98; coverage bias 98; face-to-face
   home interviews 197; mailed questionnaires
   197; non-response bias 98; sampling 197–8;
   telephone 197; travel diaries 197; unreporting
   of trips 98
trailer on fl at car (TOFC) 115, 118, 273
tramp 274
Trans-European Networks (TENs) 228
transaction costs 274; negotiation 38; policing/
   enforcement 38; search/information 38
transit system 187–8, 189–90, 274
transport costs 90, 274; capital 46; competition/
   regulation 45; costs-insurance-freight 46;
   defi nition 43; economies of scale 45; energy
   45; freight on board 46; geography 44;
   infrastructures 45; line haul 46; mode 45;
   negotiate/bid 43; rates 44; terminal 46; trade
   imbalances 45; type of product 44–5; types
   45–7
transport geography 274; defi nition 5; emergence
   5–6; fl ows 6; locations 6; multidisciplinarity
   7; terminals 7
Transport Planning Society (UK) 227
transportability 2, 274
transportation 1; access is not accessibility
   fallacy 4–5; aliances 250; chains 149–50;
   commercialization of industry 41–3; concepts/
   dimensions 5–8; distance is not time fallacy
   5; economic 4; economic development 76–9;
   economic importance 74–6; emergence of
   modern systems 20–2; environmental 3;
   as factor of production 79–80; Fordist era
   22–3; future possibilities 26–7; growth of
                                                         250; location 86–90; management of systems
                                                         249–50; mode/technology 76; physical
                                                         constraints 8–9, 11; political 3; post-Fordist
                                                         era 23–6; pre-industrial era 14–18; problem
                                                         90–3; purpose of 1–3; reduction of costs 4;
                                                         resource-based 76; social 3; socio-economic
                                                         impacts 80–1; space/time relationships 12–14;
                                                         spatial organization 81–6; spatial structure
                                                         11–12; vertically integrated fi rms 250
                                                      Transportation Effi ciency Act for the Twenty-fi rst
                                                         Century (TEA21) 236
                                                      Transportation Security Authority 137
                                                      transportation/land use modeling (TLUM)
                                                         198–201; assignment to various road links
                                                         200; calibration factors 200; data requirements
                                                         200–1; decision-taking environment 199;
                                                         four-stage 199–200; friction of space factors
                                                         200; interactions between systems 199;
                                                         ITLUP 201; land use 200; Lowry 201;
                                                         MEPLAN 201; modal split 200; regional
                                                         economic forecast 201; static 199; system
                                                         199; transportation networks 200–1; travel
                                                         generation factors 200; trip distribution 200;
                                                         trip generation 200; types 198–9
                                                      transshipment 274
                                                      trip assignment 274
                                                      trip generation 274
                                                      trolley bus 255
                                                      turnpikes 231
                                                      twenty-foot equivalent unit (TEU) 116–17, 274
                                                      ultra large crude carrier (ULCC) 23, 105–6, 274
                                                      UNCTAD 212
                                                      unit load 275
                                                      United Nations 215
                                                      United States Marine Transportation System
                                                         National Advisory Council 206
                                                      unlinked passenger trips 275
                                                      upstream/downstream 275
                                                      urban dynamics 184; employment/workplaces
                                                         185; land use 184–5; movements 185;
                                                         population/housing 185; transport network
                                                         185
                                                      urban form 171, 173
                                                      urban mobility: automobile era 186; captive
                                                         market 190; distribution 190; electric
                                                         streetcar/transit era 186; evolution 185–6;
                                                         increased 185–6; modal constraint 190;
                                                         obligatory 190; pendular 190; personal 190;
                                                         professional 190; touristic 190; types 190–1;
                                                         urban transit 186–90; voluntary 190; walking/
                                                         horse-car era 186
                                                      urban (spatial) structure 172
                                                      urban transit 231; accessibility 189; adaptive
                                                         cities 188; adaptive transit 188; bus system
                                                         187; challenge 194–5; competition 195;
TIGER (Topologically Integrated Geographic
demand 4; historical 3; horizontally linked global corporations 250; importance 3–5;
284 • Index
188; integration 190; metro system 187; paratransit system 188; public service 186–7; publicly owned 188; shuttle system 188; taxi system 188; transit rail system 187–8 urban transport 22, 237; accidents/safety 192; accumulation/concentration of economic activities 191–2; automobile dependency 192–3; central business district 174; clustering of activities 179; collective (public transit) 172; completely motorized network 177–8; congestion 192, 193–4; congestion problems 179; contemporary era 175; cycling areas 177; decentralization of activities 175; dispersed urban land development patterns 175; doughnut effect 179; elements 171–4; environmental impacts/energy consumption 192; evolution 174–6; freight 173; freight distribution 192; geographical challenges 191–2; individual 172–3; industrial revolution 175; inter-urban movements 179; land consumption 192; land use 180–5; level of motorization 176; linkages 172; loss of public space 192; mandatory trips 194; nodes 172; parking 194; parking diffi culties 192; pedestrian areas 176; pedestrians 192; planning/investment practices 193; preindustrial era 174–5; problems 191–5; public transport inadequacy 192; random events 194; ring-roads 179–80; roads/parking areas 176–7; spatial imprint 176–7; strong center 178; suburbs 175; traffi c counts/surveys 195–8; traffi c limitation 178–9; transit systems 177; transport terminals 177; travel
186; high short distance demands 186; hybrids
time 176; underpricing/consumer choice 193; urban transit challenge 194–5; voluntary trips 194; weak center 178
Valcic, I. 211 Vance, J.E. 209 variable cost 275 vector models 34; lines 34; points 34; polygons 34 Vellas, F. 206 vertical integration 123 very large crude carrier (VLCC) 275 vessel 275 Victoria Transport Policy Institute 239 VLCCs (Very Large Crude Carriers) 23 Von Thunen's regional land use model 181–2
Walker, L.J. and Johnston, J. 222 warehouse 275 water transport 104–7; bulk carriers 105–6; cabotage 104; conferences (formal agreements) 107; drawbacks 105; fl ags of convenience 106; general cargo ships 106; kinds of services 106; openness of shipping industry 106; operating costs 105, 107; passenger vessels 105; physical barriers 104–5; registry costs 107; regulation 106 waterway 275 waybill 275 weight 129, 275 wharf 275 work schedules 239–40 World Trade Organization (WTO) 40

A library at your fingertips!
eBooks are electronic versions of printed books. You can store them on your PC/laptop or browse them online.
They have advantages for anyone needing rapid access to a wide variety of published, copyright information.
eBooks can help your research by enabling you to bookmark chapters, annotate text and use instant searches to find specific words or phrases. Several eBook files would fit on even a small laptop or PDA.
NEW: Save money by eSubscribing: cheap, online access to any eBook for as long as you need it.
Annual subscription packages
We now offer special low-cost bulk subscriptions to packages of eBooks in certain subject areas. These are available to libraries or to individuals.
For more information please contact webmaster.ebooks@tandf.co.uk
We're continually developing the eBook concept, so keep up to date by visiting the website.
www.eBookstore.tandf.co.uk